. 2023 Feb 21;11(2):e0252722.
doi: 10.1128/spectrum.02527-22. Online ahead of print.

Modulation of Biofilm Formation and Permeability in Streptococcus mutans during Exposure To Zinc Acetate

Affiliations

Modulation of Biofilm Formation and Permeability in Streptococcus mutans during Exposure To Zinc Acetate

Kara M Buzza et al. Microbiol Spectr. .

Abstract

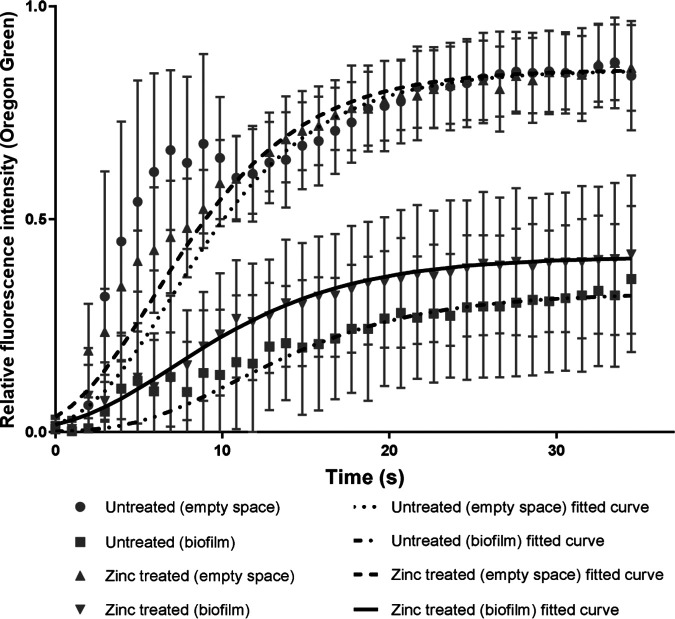
The penetration of biofilms by antimicrobials is a potential limiting factor in biofilm control. This is relevant to oral health, as compounds that are used to control microbial growth and activities could also affect the permeability of dental plaque biofilm with secondary effects on biofilm tolerance. We investigated the effects of zinc salts on the permeability of Streptococcus mutans biofilms. Biofilms were grown with low concentrations of zinc acetate (ZA), and a transwell transportation assay was applied to test biofilm permeability in an apical-basolateral direction. Crystal violet assays and total viable counts were used to quantify the biofilm formation and viability, respectively, and short time frame diffusion rates within microcolonies were determined using spatial intensity distribution analysis (SpIDA). While the diffusion rates within biofilm microcolonies were not significantly altered, exposure to ZA significantly increased the overall permeability of S. mutans biofilms (P < 0.05) through decreased biofilm formation, particularly at concentrations above 0.3 mg/mL. Transport was significantly lower through biofilms grown in high sucrose conditions. IMPORTANCE Zinc salts are added to dentifrices to improve oral hygiene through the control of dental plaque. We describe a method for determining biofilm permeability and show a moderate inhibitory effect of zinc acetate on biofilm formation, and that this inhibitory effect is associated with increases in overall biofilm permeability.

Keywords: S. mutans; antimicrobial; biofilm; dental; oral; permeability; plaque; toothpaste; zinc.


Conflict of interest statement

The authors declare a conflict of interest. This work was funded by Colgate-Palmolive (USA). P.K.S. was an employee of Colgate-Palmolive when this project was conceived and conducted. A.J.M. conducts research and advises companies in the areas of antimicrobials, biofilms, microbiome, and microbial control. K.M.B., A.P., and R.G.L. declare no competing interests.

Figures

FIG 1
FIG 1
Biofilm formation of S. mutans in the presence of zinc acetate (0.0025 to 8.0 mg/mL) was determined using a crystal violet assay. The error bars show the standard deviation, which is representative of three biological replicates.
FIG 2
FIG 2
Biofilms were grown on transwells in the presence of 0.2% or 2% sucrose. Biofilms were stained with Toto -1 iodide and Syto 60, demonstrating a thicker layer of extracellular DNA, a biofilm component, and greater bacterial intracellular staining when grown in the presence of 2% sucrose (right), in comparison to 0.2% sucrose (left). Scale bar = 50 μm.
FIG 3
FIG 3
The permeability of the S. mutans biofilms was determined by adapting a transwell transportation assay and measuring the amount of a fluorescent tracer, Oregon Green (OG), which travelled through the biofilm in an apical-basolateral direction. The results were normalized and are shown as the relative concentration of OG over time. Biofilms were grown in the absence or presence of 25% or 50% of the MIC of zinc acetate (0.25 and 0.5 mg/mL, respectively) for 5 d before the testing and OG measurements were performed at 15, 30, 60, and 90 min. The error bars represent the standard deviation based on six biological replicates. *, P < 0.05 for 0.5 mg/mL ZA versus a control, #, P < 0.05 for 0.25 mg/mL ZA versus a control.
FIG 4
FIG 4
The correlation between biofilm permeability and viable count data is shown as a scatterplot with a linear trend line. Pearson’s correlation coefficient was calculated and gave a moderate negative correlation of −0.57 (P < 0.05).
FIG 5
FIG 5
Representative time-series images showing the diffusion of 100 μL of 1 mM Oregon Green through the ibidi channel slide and into the microcolony (nucleic acids stained red with 5 μM DRAQ5). The untreated sample is shown on the left, and the sample treated with 0.25 mg/mL ZA is shown on the right. The scale bar is 100 μm.
FIG 6
FIG 6
Showing the diffusion of Oregon Green (OG) into the empty space and zinc-treated or untreated S. mutans microcolonies within the ibidi channel slides. The data points represent averages of three biological replicates with four technical repeats each. The curves show models fitted to each series of data points based on the SGompertz predefined function in GraphPad Prism (dotted line = untreated, solid line = zinc treated). The error bars represent the standard error of the mean.
FIG 7
FIG 7
The initial diffusion rates (A) and relative effective diffusivities (B) of OG in zinc-treated and untreated S. mutans biofilms are shown as aligned dot plots, with ● representing individual data points and horizontal lines showing the means and standard deviations. The initial diffusion rate was defined as (slope of OG entering a microcolony) / (slope of OG in empty space) between 2 and 15 s. The relative effective diffusivity was calculated as the ratio between the diffusion coefficient of OG in the biofilm (De) and the diffusion coefficient in water (Daq). The values represent three biological replicates with four technical replicates.
FIG 8
FIG 8
Diagram showing the setup of the transwell transportation assay used to measure the penetration of Oregon Green, a fluorescent tracer, through mature S. mutans biofilms.
FIG 9
FIG 9
Illustration showing the structure of the Ibidi μ-Slide I channel slide. (A) Top-down view, showing the reservoirs, channel openings, and channel. (B) Side-on view, with an excerpt (in the dashed line box) showing the location and dimensions of the channel within the slide, with gas exchange occurring across the bottom of the channel. Illustration adapted from Ibidi (39).

Similar articles

References

    1. Pihlstrom BL, Michalowicz BS, Johnson NW. 2005. Periodontal diseases. Lancet 366:1809–1820. doi:10.1016/S0140-6736(05)67728-8. - DOI - PubMed
    1. Wen PYF, Chen MX, Zhong YJ, Dong QQ, Wong HM. 2022. Global burden and inequality of dental caries, 1990 to 2019. J Dent Res 101:392–399. doi:10.1177/00220345211056247. - DOI - PubMed
    1. Eke PI, Dye BA, Wei L, Slade GD, Thornton-Evans GO, Borgnakke WS, Taylor GW, Page RC, Beck JD, Genco RJ. 2015. Update on prevalence of periodontitis in adults in the United States: NHANES 2009 to 2012. J Periodontol 86:611–622. doi:10.1902/jop.2015.140520. - DOI - PMC - PubMed
    1. Holt R, Roberts G, Scully C. 2000. ABC of oral health. Dental damage, sequelae, and prevention. BMJ 320:1717–1719. doi:10.1136/bmj.320.7251.1717. - DOI - PMC - PubMed
    1. Steele JG, Treasure ET, O'Sullivan I, Morris J, Murray JJ. 2012. Adult Dental Health Survey 2009: transformations in British oral health 1968–2009. Br Dent J 213:523–527. doi:10.1038/sj.bdj.2012.1067. - DOI - PubMed

LinkOut - more resources