. 2023 Apr 25;14(2):e0330322.
doi: 10.1128/mbio.03303-22. Epub 2023 Feb 21.

Live Cell Imaging Reveals HBV Capsid Translocation from the Nucleus To the Cytoplasm Enabled by Cell Division

Affiliations

Live Cell Imaging Reveals HBV Capsid Translocation from the Nucleus To the Cytoplasm Enabled by Cell Division

Sofia Romero et al. mBio. .

Abstract

Hepatitis B virus (HBV) capsid assembly is traditionally thought to occur predominantly in the cytoplasm, where the virus gains access to the virion egress pathway. To better define sites of HBV capsid assembly, we carried out single cell imaging of HBV Core protein (Cp) subcellular trafficking over time under conditions supporting genome packaging and reverse transcription in Huh7 hepatocellular carcinoma cells. Time-course analyses including live cell imaging of fluorescently tagged Cp derivatives showed Cp to accumulate in the nucleus at early time points (~24 h), followed by a marked re-distribution to the cytoplasm at 48 to 72 h. Nucleus-associated Cp was confirmed to be capsid and/or high-order assemblages using a novel dual label immunofluorescence strategy. Nuclear-to-cytoplasmic re-localization of Cp occurred predominantly during nuclear envelope breakdown in conjunction with cell division, followed by strong cytoplasmic retention of Cp. Blocking cell division resulted in strong nuclear entrapment of high-order assemblages. A Cp mutant, Cp-V124W, predicted to exhibit enhanced assembly kinetics, also first trafficked to the nucleus to accumulate at nucleoli, consistent with the hypothesis that Cp's transit to the nucleus is a strong and constitutive process. Taken together, these results provide support for the nucleus as an early-stage site of HBV capsid assembly, and provide the first dynamic evidence of cytoplasmic retention after cell division as a mechanism underpinning capsid nucleus-to-cytoplasm relocalization. IMPORTANCE Hepatitis B virus (HBV) is an enveloped, reverse-transcribing DNA virus that is a major cause of liver disease and hepatocellular carcinoma. Subcellular trafficking events underpinning HBV capsid assembly and virion egress remain poorly characterized. Here, we developed a combination of fixed and long-term (>24 h) live cell imaging technologies to study the single cell trafficking dynamics of the HBV Core Protein (Cp). We demonstrate that Cp first accumulates in the nucleus, and forms high-order structures consistent with capsids, with the predominant route of nuclear egress being relocalization to the cytoplasm during cell division in conjunction with nuclear membrane breakdown. Single cell video microscopy demonstrated unequivocally that Cp's localization to the nucleus is constitutive. This study represents a pioneering application of live cell imaging to study HBV subcellular transport, and demonstrates links between HBV Cp and the cell cycle.

Keywords: core protein; hepatitis B virus; live cell imaging; nuclear export; subcellular trafficking; virus assembly.


Conflict of interest statement

The authors declare no conflict of interest.

Figures

FIG 1
FIG 1
Changes to the subcellular distribution of HBV Cp over time. (A) Cartoon illustration of Cp divided into the N-terminal Assembly Domain and C-Terminal Domain (CTD). The CTD encodes the nuclear localization signal (NLS). The HBV Cp dimer crystal structure shown is based on PBD:3J2V. The position of the Cp-Y132A mutation is highlighted in blue, shown on the red Cp subunit. (B) Outline of HBV expression and time course analysis workflow based on immunofluorescence (IF) detection of WT HBV Cp or Cp-Y132A. Images were developed using BioRender. (C) Representative images and quantification from IF time-course analysis of Huh7 cells expressing WT Cp with packageable pgRNAs, or the Cp-Y132 (no assembly) control. Cells were fixed at the indicated time points with WT Cp or Cp-Y132A detected using polyclonal anti-HBc antiserum. White dashed lines differentiate nuclei (N) from cytoplasm (C). Red dashed boxes highlight regions of interest, with red arrows indicating WT Cp puncta consistent with assembled capsids. Image scale bars represent 10 μm. Plots on the right present ratios of C/N mean fluorescence intensity (MFI) for 100 cells per condition per time point. The red dashed line at 1 indicates equivalent levels of nuclear and cytoplasmic fluorescence signals. Greater than 1 indicates more cytoplasmic MFI relative to the nucleus. Less than 1 indicates more nuclear MFI relative to the cytoplasm.
FIG 2
FIG 2
Cp forms high-order assemblages in the nucleus. (A) Illustrations of Cp dimer and capsid structures highlighting the HBV Cp binding sites for the mAb3120 and polyclonal (anti-HBc) antibodies used for the dual labeling strategy. (B) Representative images from IF analysis of cells expressing WT Cp or Cp-Y132A, and incubated with the indicated antibodies, to confirm binding specificity. mCherry (inset, red) was co-transfected with the Cp variant to assist in identifying transfected cells prior to fixation, staining with DAPI (blue), and staining for IF (green). mAb3120 was confirmed as unable to detect Cp-Y132A (central panels). (C) Images and analysis of dually labeled Huh7 cells expressing WT Cp and detected using mAb3120 (cyan) and polyclonal anti-HBc (green). Transect analysis illustrates differential detection of Cp with polyclonal (predominantly nuclear) and mAb3120 (predominantly cytoplasmic) at 72h in a representative cell; consistent with unassembled Cp trafficking to the nucleus, even when the assembled capsid population is predominantly in the cytoplasm. Scale bars represent 10 μm. (D) Bar graphs quantifying the subcellular localization of WT Cp for 100 cells per condition, detected using the indicated antibody and corresponding to the experiment in (C). Error bars represent the standard deviation of the mean for 3 biological replicates. (E) Bar graphs as for (D) confirming a similar subcellular localization of WT Cp distribution over time when expressed from a plasmid encoding envelope glycoproteins (Env+).
FIG 3
FIG 3
Intracellular nuclear puncta exhibit similar morphology to HBV capsids isolated by velocity-sedimentation. (A) IF detection of WT Cp using mAb3120 expressed in Huh7 cells for either isolated capsids from velocity sedimentation (fraction #7), or within the nuclear compartment of Cp-expressing cells fixed at 24 h posttransfection. Images were background subtracted and subjected to image analysis comparing the circulatory and diameter of objects (puncta), as described in Materials and Methods. Mean values are denoted by black and red dashed lines, respectively. A circularity value of 1.0 represents a perfect circle. (B) Circularity and diameter distributions for >200 puncta from 5 independent nuclei presented in cyan and dark orange dot plots, respectively, compared to puncta in the cytoplasm (Cyto-A) or isolated capsids (capsids). Error bars represent the standard deviation of the mean.
FIG 4
FIG 4
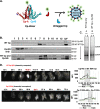
Live cell analysis reveals that assembly-dependent relocalization of Cp to the cytoplasm occurs predominantly during cell division. (A) Illustration detailing the co-expression of engineered Cp-NG (NeonGreen) and untagged Cp to support assembly of chimeric fluorescent HBV capsids. The NG tag is represented as a green circle attached to the Cp apical region between Cp amino acids D78 and P79. (B) Velocity sedimentation analysis of Cp multimerization, showing that tagged HBV (Cp-NG, ~55 kD), when expressed alone, sediments in fractions 2 to 4, but shifts to capsid fractions 7 and 8 when co-expressed with untagged Cp (~22 kD), consistent with formation of fluorescent chimeric capsids. (C) Southern blot detection of HBV reverse transcribed viral DNA for (A) WT Cp only or (B) WT Cp + Cp-NG (chimeric capsid) conditions. Bands corresponding to rcDNA or ssDNA are indicated. (D) Images from live cell detection and tracking of assembly-competent Cp-NG (top panel) or assembly-incompetent Cp-Y132A-NG (lower panel). Time-course images correspond to Movies S1 and S2. Time points labeled in red designate the initiation of a cell division event. On the right, MFI for nuclear (black line) or cytoplasmic (green line) Cp-NG or Cp-Y132A-NG signals are plotted for a representative cell tracked over 72 h of live cell imaging. Gray box highlights a 10 h window that encompasses a cell division event.
FIG 5
FIG 5
Inducing cell cycle arrest using aphidicolin that entraps HBV Cp/capsids in the nucleus. Representative images showing Huh7 cells expressing WT HBV, treated with 10 μg/mL APC for the indicated time period (e.g., 24, 48, and 72 h post-gene expression). In the presence of APC, WT Cp remained predominantly nuclear at all time points, as detected by both capsid-specific mAb3120 and anti-HBc polyclonal antibody. Smaller images (top) bordered in red show WT HBV control WT Cp expression and relocalization from the nucleus to the cytoplasm in the absence of APC. Scale bars represent 10 μm. Bar graphs present data from 3 independent experiments, measuring 100 cells per condition and time point, with error bars representing the standard deviation of the mean.
FIG 6
FIG 6
Increasing rates of capsid assembly does not affect Cp’s preferential accumulation in the nucleus at early time points. (A) Representative images of cells expressing rapid assembly mutant Cp-V124W tracked over a 72 h time course using dual label IF analysis. The red arrows indicate cytoplasmic co-localization of capsid/Cp detected by both mAb3120 and polyclonal anti-HBc antisera, respectively. Graphs present relative levels of nuclear versus cytoplasmic Cp-V124W distribution for 100 cells per time point. Error bars represent the standard deviation of the mean for 3 independent experiments. (B) Images from live single cell detection of fluorescent Cp-V124W-NG co-expressed with untagged Cp-V124W over an ~70 h time course. Time point labeled in red (28.5h) designates a cell division event. Please reference Movie S3 for the complete video file. Graph shows tracking of nuclear and cytoplasmic Cp-V124W-NG MFI for a representative cell, plotted over time. Gray box highlights an ~6 h time window encompassing a cell division event. (C) Images from IF detection of untagged WT Cp and Cp-V124W using polyclonal anti-HBc (green) with cellular nucleoli labeled using anti-Nucleophosmin (B23) (magenta) antibodies, indicating that both WT Cp and Cp-V124W localize to the nucleolus at early time points. Scale bars represent 10 μm. Red arrows highlight co-incident detection of Cp or Cp-V124W with Nucleophosmin (B23).
FIG 7
FIG 7
Working model for intracellular trafficking of Cp dimers and capsids in cells that are mitotically active. (Left panel) Cp monomers/dimers enter the nucleus rapidly after being translated in the cytoplasm, where they form high-order Cp assemblages (likely capsids). A significant amount of Cp is recruited to nucleoli during this phase. During interphase, Cp dimers and a subset of capsids may be capable of leaving the nucleus through the NPC using the CRM1 and/or NXF1 transport pathways. (Right panel) Provided by cell division, a large number of nuclear capsids are delivered to the cytoplasm when the nuclear envelope dissolves (dashed lines) during prometaphase, followed by cytoplasmic retention/stabilization through a yet-to-be elucidated tethering mechanism. Figure created with BioRender.com.

References

    1. Seeger C, Mason WS. 2016. Molecular biology of hepatitis B virus infection. Virology 479–480:672–686. doi:10.1016/j.virol.2015.02.031. - DOI - PMC - PubMed
    1. Beck J, Nassal M. 2007. Hepatitis B virus replication. World J Gastroenterol 13:48–64. doi:10.3748/wjg.v13.i1.48. - DOI - PMC - PubMed
    1. Allweiss L, Dandri M. 2017. The role of cccDNA in HBV maintenance. Viruses 9:156. doi:10.3390/v9060156. - DOI - PMC - PubMed
    1. Levrero M, Pollicino T, Petersen J, Belloni L, Raimondo G, Dandri M. 2009. Control of cccDNA function in hepatitis B virus infection. J Hepatol 51:581–592. doi:10.1016/j.jhep.2009.05.022. - DOI - PubMed
    1. Xia Y, Guo H. 2020. Hepatitis B virus cccDNA: formation, regulation and therapeutic potential. Antiviral Res 180:104824. doi:10.1016/j.antiviral.2020.104824. - DOI - PMC - PubMed

Publication types

Substances