. 2023 Feb 21;18(2):e0281820.
doi: 10.1371/journal.pone.0281820. eCollection 2023.

Conditional ablation of heparan sulfate expression in stromal fibroblasts promotes tumor growth in vivo

Affiliations

Conditional ablation of heparan sulfate expression in stromal fibroblasts promotes tumor growth in vivo

Ayumi Niwa et al. PLoS One. .

Abstract

Heparan sulfate (HS) is a glycocalyx component present in the extracellular matrix and cell-surface HS proteoglycans (HSPGs). Although HSPGs are known to play functional roles in multiple aspects of tumor development and progression, the effect of HS expression in the tumor stroma on tumor growth in vivo remains unclear. We conditionally deleted Ext1, which encodes a glycosyltransferase essential for the biosynthesis of HS chains, using S100a4-Cre (S100a4-Cre; Ext1f/f) to investigate the role of HS in cancer-associated fibroblasts, which is the main component of the tumor microenvironment. Subcutaneous transplantation experiments with murine MC38 colon cancer and Pan02 pancreatic cancer cells demonstrated substantially larger subcutaneous tumors in S100a4-Cre; Ext1f/f mice. Additionally, the number of myofibroblasts observed in MC38 and Pan02 subcutaneous tumors of S100a4-Cre; Ext1f/f mice decreased. Furthermore, the number of intratumoral macrophages decreased in MC38 subcutaneous tumors in S100a4-Cre; Ext1f/f mice. Finally, the expression of matrix metalloproteinase-7 (MMP-7) markedly increased in Pan02 subcutaneous tumors in S100a4-Cre; Ext1f/f mice, suggesting that it may contribute to rapid growth. Therefore, our study demonstrates that the tumor microenvironment with HS-reduced fibroblasts provides a favorable environment for tumor growth by affecting the function and properties of cancer-associated fibroblasts, macrophages, and cancer cells.


Conflict of interest statement

The authors have declared that no competing interests exist.

Figures

Fig 1
Fig 1. Loss of exostosin-1 (EXT1), specific reduction of heparan sulfate (HS) in fibroblasts, and decreased acidic mucosubstances in the stroma of S100a4-Cre; Ext1f/f mice.
(A) Immunostaining of Ext1 in subcutaneous tissues of skin of S100a4-Cre; Ext1f/f; Lsl-tdTomato and control (S100a4-Cre; Lsl-tdTomato) mice. White arrowheads indicate Ext1-positive fibroblasts. Scale bar = 50 μm. (B) Immunostaining of HS in subcutaneous tissues of skin of S100a4-Cre; Ext1f/f; Lsl-tdTomato and control (S100a4-Cre; Lsl-tdTomato) mice. White arrowheads indicate HS-positive fibroblasts. Scale bar = 50 μm. (C) Alcian blue staining (pH = 2.5 and 1.0) in subcutaneous tissues of skin of S100a4-Cre; Ext1f/f and control (Ext1 f/f) mice. Scale bar = 100 μm.
Fig 2
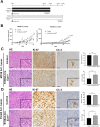
Fig 2. S100a4-Cre; Ext1f/f mice enhanced tumor growth in subcutaneous engrafted colon and pancreatic cancer cells.
(A) Experimental design of the subcutaneous tumor model. (B) The change of MC38 and Pan02 S.C. tumor volume in S100a4-Cre; Ext1f/f and control mice. Each data point represents the mean tumor volume ± SEM. (MC38 S.C. tumor—control, N = 10, S100a4-Cre; Ext1f/f, N = 16; Pan02 S.C. tumor—control, N = 12, S100a4-Cre; Ext1f/f, N = 9; Mann–Whitney test, *P < 0.05, **P < 0.01). (C) Representative H&E staining of subcutaneous tumors and immunostaining of Ki-67 and cleaved caspase-3 (CC-3) of MC38 S.C. colon tumors in S100a4-Cre; Ext1f/f and control mice (left). The ratio of Ki-67 and the number of CC-3-positive cells in tumors of S100a4-Cre; Ext1f/f and control mice (right). Ki-67 data represent mean ± SEM, and CC-3 data represent mean ± SEM (N = 6 for each cohort, for both). Scale bar = 50 μm. (D) Representative H&E staining of subcutaneous tumors and immunostaining of Ki-67 and cleaved caspase-3 (CC-3) of Pan02 S.C. pancreatic tumors in S100a4-Cre; Ext1f/f and control mice (left). The ratio of Ki-67 and the number of CC-3-positive cells in tumors of S100a4-Cre; Ext1f/f and control mice (right). Ki-67 data represent mean ± SEM, and CC-3 data represent mean ± SEM (N = 6 for each cohort). Scale bar = 50 μm.
Fig 3
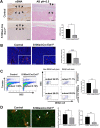
Fig 3. Decreased peritumoral myofibroblasts in the MC38 S.C. tumors of S100a4-Cre; Ext1f/f mice.
(A) Immunostaining of α-smooth muscle actin (αSMA)-positive spindle cells, i.e., myofibroblasts, in the peritumoral region of MC38 S.C. colon tumors in S100a4-Cre; Ext1f/f and control mice (left). Arrowheads indicate the band comprising αSMA-positive cells. Alcian blue staining (pH = 2.5) in the peri-tumor region of MC38 S.C. colon tumors in S100a4-Cre; Ext1f/f and control mice (middle). Arrowheads indicate the Alcian blue positive area. Measurement of the thickness of myofibroblasts around the MC38 S.C. tumor of S100a4-Cre; Ext1f/f and control mice (right). Data represent mean ± SEM (N = 6 for each cohort, unpaired t-test, *P < 0.05). Scale bar = 100 μm. (B) Tomato expression in the intra-tumor region of MC38 S.C. tumors of S100a4-Cre; Ext1f/f; Lsl-tdTomato and control (S100a4-Cre; Lsl-tdTomato) mice. Measurement of the area of Tomato-positive cells in both cohorts. Data represent mean ± SEM. N = 6 for each cohort unpaired t-test (*P < 0.05, **P < 0.01, ***P < 0.001, ****P < 0.0001). Scale bar = 100 μm. (C) Flow cytometric properties of intra-tumor region of MC38 S.C. tumor in S100a4-Cre; Ext1f/f; Lsl-tdTomato, and control (S100a4-Cre; Lsl-tdTomato) mice (representative data) (left). The subset represents tdTomato-positive fibroblast cells (left). Dead cell selection in flow cytometry (representative data) (middle). Only living tdTomato-positive cells are collected and analyzed (middle). SSC, side scatter. The ratio of the number of tdTomato-positive cells to total cells in the tumor (right). Data represent the mean ± SEM (N = 4 for each cohort, Mann–Whitney test, *P < 0.05, **P < 0.01). (D) Immunofluorescent staining of αSMA (green) in MC38 S.C. tumors of S100a4-Cre; Ext1f/f; Lsl-tdTomato and control (S100a4-Cre; Lsl-tdTomato) mice (left). White arrowheads indicate αSMA-positive fibroblasts. Measurement of the percentage of the area of αSMA-positive fibroblasts, i.e., myofibroblasts, in MC38 S.C. tumors of S100a4-Cre; Ext1f/f; Lsl-tdTomato and control (S100a4-Cre; Lsl-tdTomato) mice (right). The ratio of myofibroblast area to Tomato-positive fibroblast area and the ratio of myofibroblast area to the tumor area. Data represent the mean ± SEM (N = 6 for each cohort, unpaired t-test, *P < 0.05, **P < 0.01). Scale bar = 50 μm.
Fig 4
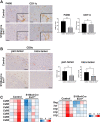
Fig 4. Change of the immune microenvironment in MC38 S.C. tumors of S100a4-Cre; Ext1f/f mice.
(A) Immunohistochemistry for F4/80 and CD11c of MC38 S.C. tumor of S100a4-Cre; Ext1f/f and control mice (left). The number of F4/80- and CD11c-positive cells in tumors of S100a4-Cre; Ext1f/f and control mice (right). Data represent mean ± SEM (N = 6 for each cohort, unpaired t-test, *P < 0.05, **P < 0.01). Scale bar = 50 μm. (B) Immunohistochemistry of CD8α in peri- and intra-tumor regions of MC38 S.C. tumors of S100a4-Cre; Ext1f/f and control mice (left). The number of CD8α-positive cells in peri-and intra-tumor regions of tumors of S100a4-Cre; Ext1f/f and control mice (right). Data represent mean ± SEM (N = 6 for each cohort, unpaired t-test). Scale bar = 50 μm. (C) Microarray analysis of MC38 S.C. tumor of S100a4-Cre; Ext1f/f and control mice (N = 4 for each cohort). Decreased gene expression is indicated in blue and increased gene expression is indicated in red.
Fig 5
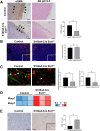
Fig 5. Decreased myofibroblasts in the peritumoral region and high expression of MMP-7 in Pan02 S.C. tumor of S100a4-Cre; Ext1f/f mice.
(A) Immunostaining of α-smooth muscle actin (αSMA)-positive spindle cells, i.e., myofibroblasts, in the peritumoral region of Pan02 S.C. pancreatic tumors in S100a4-Cre; Ext1f/f and control mice (left). Arrowheads indicate the band comprising αSMA-positive cells. Alcian blue staining (pH = 2.5) in the peritumoral region of Pan02 S.C. pancreatic tumors in S100a4-Cre; Ext1f/f and control mice (middle). Measurement of the thickness of myofibroblasts around the Pan02 S.C. tumor of S100a4-Cre; Ext1f/f and control mice (right). Data represented as mean ± SEM (N = 6 for each cohort, unpaired t-test, *P < 0.05). Scale bar = 100 μm. (B) Tomato expression in the intra-tumor region of Pan02 S.C. tumors of S100a4-Cre; Ext1f/f; Lsl-tdTomato and control (S100a4-Cre; Lsl-tdTomato) mice. Measurement of the area of Tomato-positive cells in both cohorts. Data represented as mean ± SEM (N = 6 for each cohort, Mann–Whitney test). Scale bar = 100 μm. (C) Immunofluorescent staining of αSMA (green) in the Pan02 S.C. tumors of S100a4-Cre; Ext1f/f; Lsl-tdTomato and control (S100a4-Cre; Lsl-tdTomato) mice (left). White arrowheads indicate αSMA-positive fibroblasts. Measurement of the percentage of the area of αSMA-positive fibroblasts, i.e., myofibroblasts, in Pan02 S.C. tumors of S100a4-Cre; Ext1f/f; Lsl-tdTomato and control (S100a4-Cre; Lsl-tdTomato) mice (right). The ratio of myofibroblast area to Tomato-positive fibroblast area and the ratio of myofibroblast area to tumor area were measured. Data represent mean ± SEM (N = 6 for each cohort, Mann–Whitney test, unpaired t-test, respectively). Scale bar = 50 μm. (D) Microarray analysis of Pan02 S.C. tumor of S100a4-Cre; Ext1f/f and control mice (N = 4 for each cohort). Decreased gene expression is indicated in blue, and increased gene expression is indicated in red (fold change > 2, moderate t-test, P < 0.05; N = 3 for each cohort). (E) Immunostaining of MMP-7 in the Pan02 S.C. tumor of S100a4-Cre; Ext1f/f and control mice (left). The number of MMP-7-positive cells in the tumors was measured (right). Data represent mean ± SEM (N = 6 for each cohort, Mann–Whitney test, *P < 0.05).
Fig 6
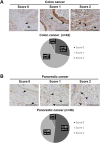
Fig 6. Fibroblast-specific exostosin-1 (EXT1) expression in the stroma of human colon and pancreatic cancers.
(A) Scoring of human colon cancers (N = 42). Arrowheads indicate Ext1-positive fibroblasts. Scale bar = 50 μm. (B) Scoring of human pancreatic cancers (N = 48). Arrowheads indicate Ext1-positive fibroblasts. Scale bar = 50 μm.

References

    1. Schmidt EP, Kuebler WM, Lee WL, Downey GP. Adhesion molecules: master controllers of the circulatory system. Compr Physiol. 2016;6:945–973. doi: 10.1002/cphy.c150020 - DOI - PubMed
    1. Sasisekharan R, Shriver Z, Venkataraman G, Narayanasami U. Roles of heparan-sulphate glycosaminoglycans in cancer. Nat Rev Cancer. 2002;2:521–528. doi: 10.1038/nrc842 - DOI - PubMed
    1. Rapraeger AC, Krufka A, Olwin BB. Requirement of heparan sulfate for bFGF-mediated fibroblast growth and myoblast differentiation. Science. 1991;252:1705–1708. doi: 10.1126/science.1646484 - DOI - PubMed
    1. Aviezer D, Yayon A. Heparin-dependent binding and autophosphorylation of epidermal growth factor (EGF) receptor by heparin-binding EGF-like growth factor but not by EGF. Proc Natl Acad Sci U S A. 1994;91:12173–12177. doi: 10.1073/pnas.91.25.12173 - DOI - PMC - PubMed
    1. Amara A, Lorthioir O, Valenzuela A, Magerus A, Thelen M, Montes M, et al.. Stromal cell-derived factor-1alpha associates with heparan sulfates through the first beta-strand of the chemokine. J Biol Chem. 1999;274:23916–23925. doi: 10.1074/jbc.274.34.23916 - DOI - PubMed

Publication types

Substances