. 2023 Apr 10;8(7):e164296.
doi: 10.1172/jci.insight.164296.

Mapping the metabolic reprogramming induced by sodium-glucose cotransporter 2 inhibition

Affiliations

Mapping the metabolic reprogramming induced by sodium-glucose cotransporter 2 inhibition

Aviram Kogot-Levin et al. JCI Insight. .

Abstract

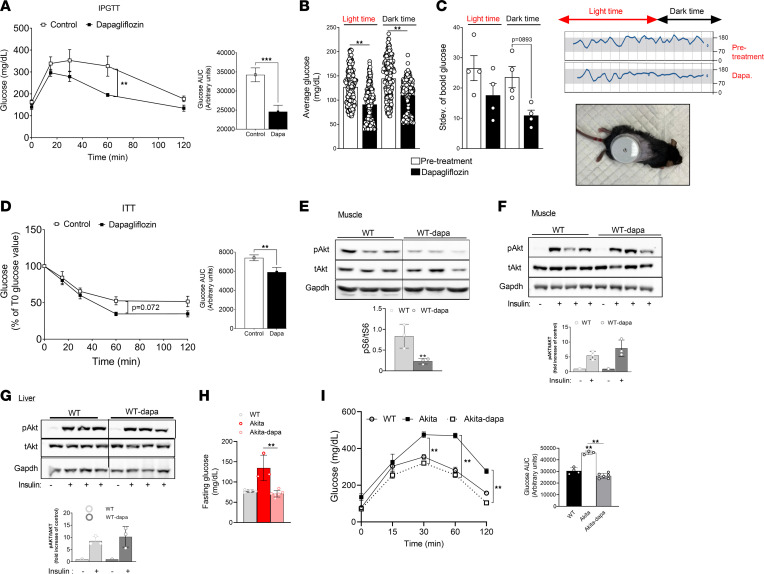
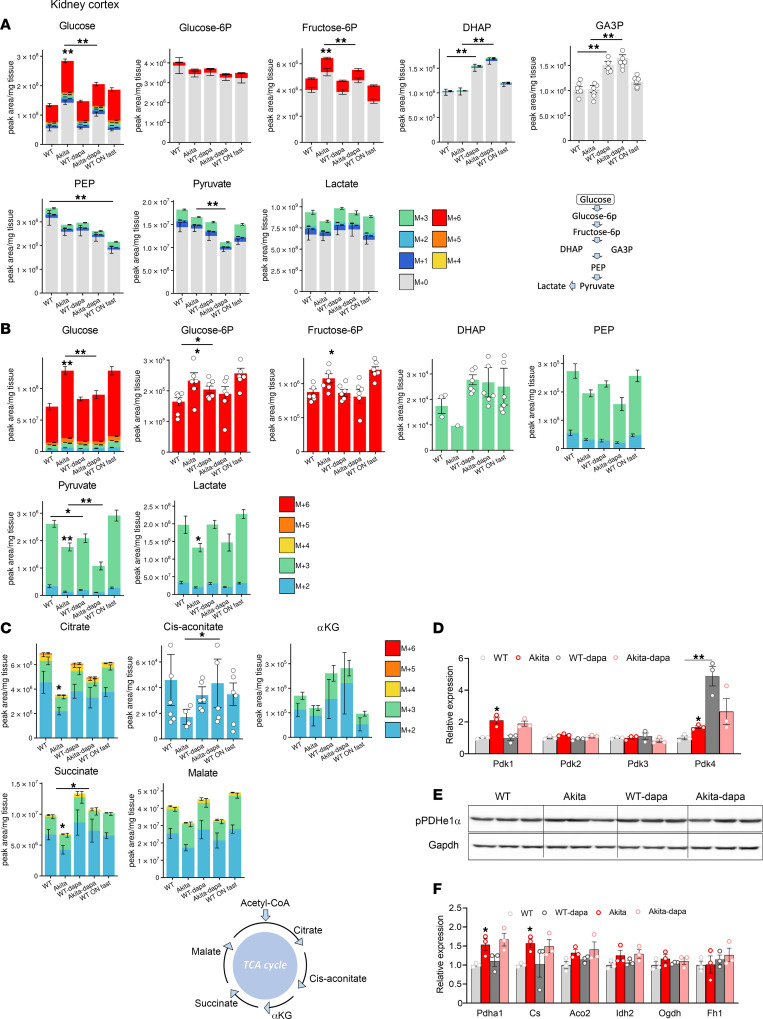
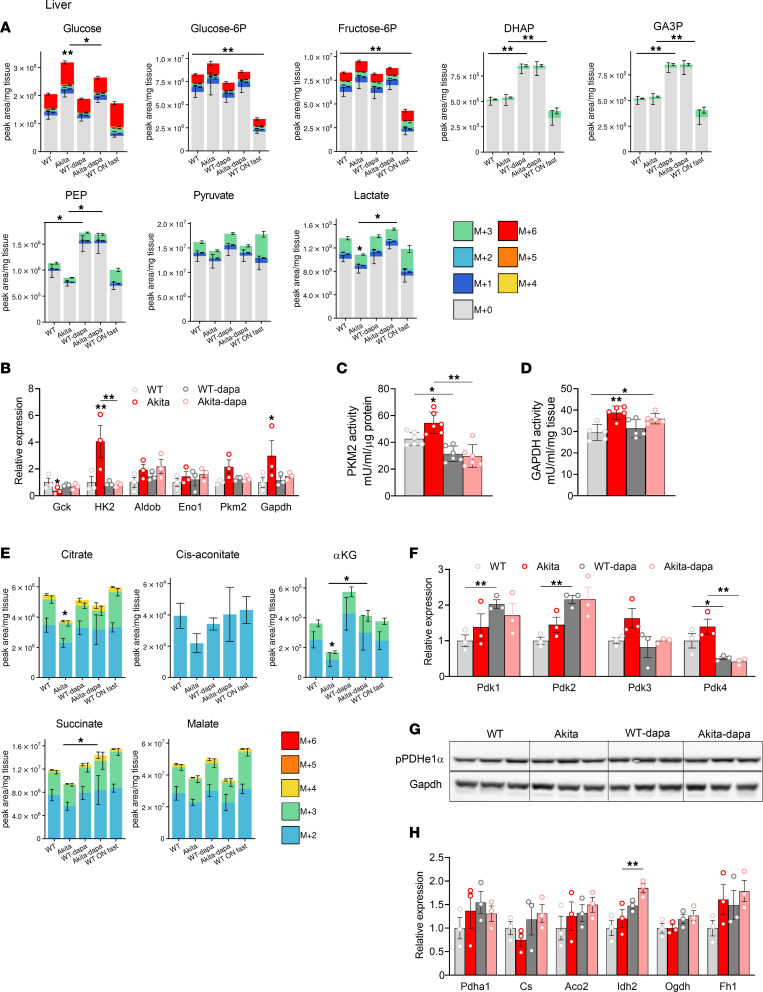
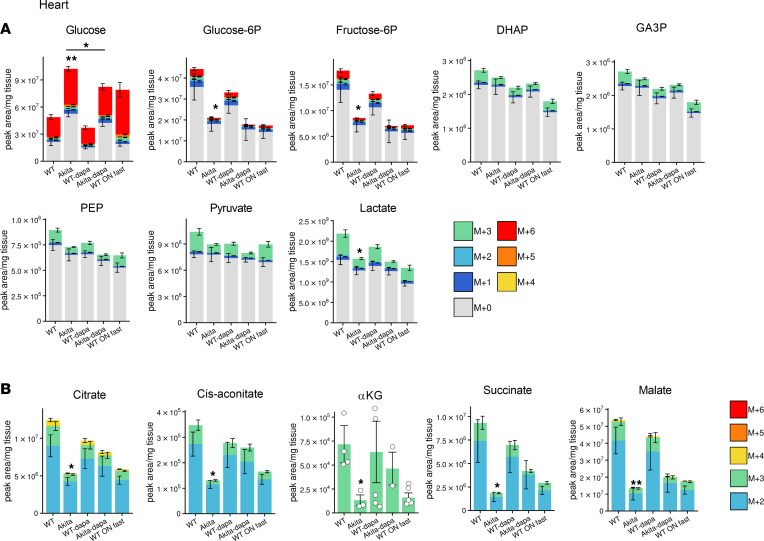
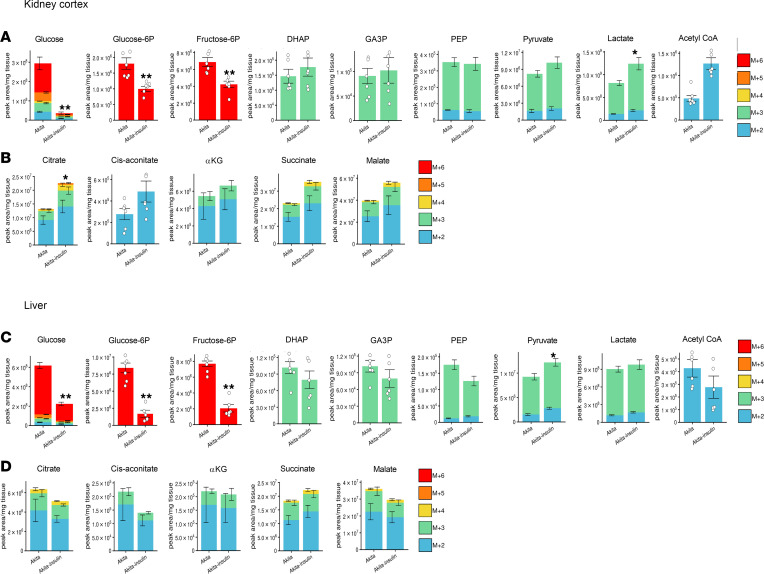
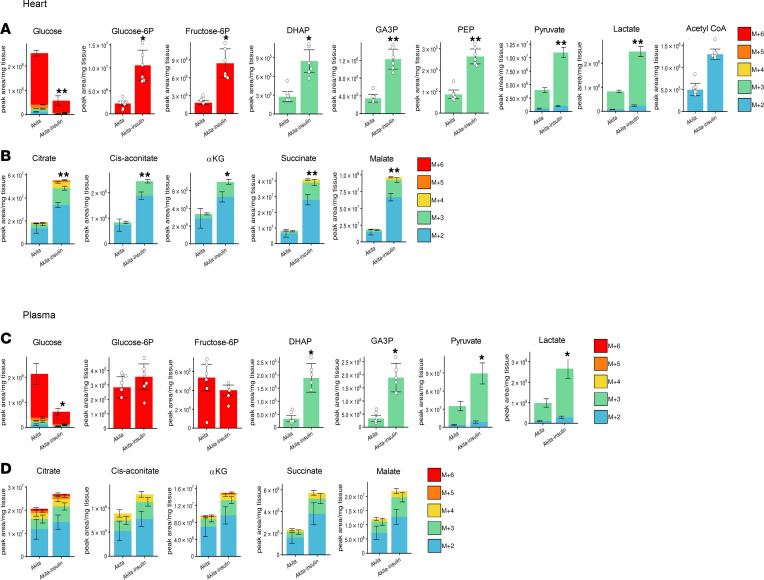
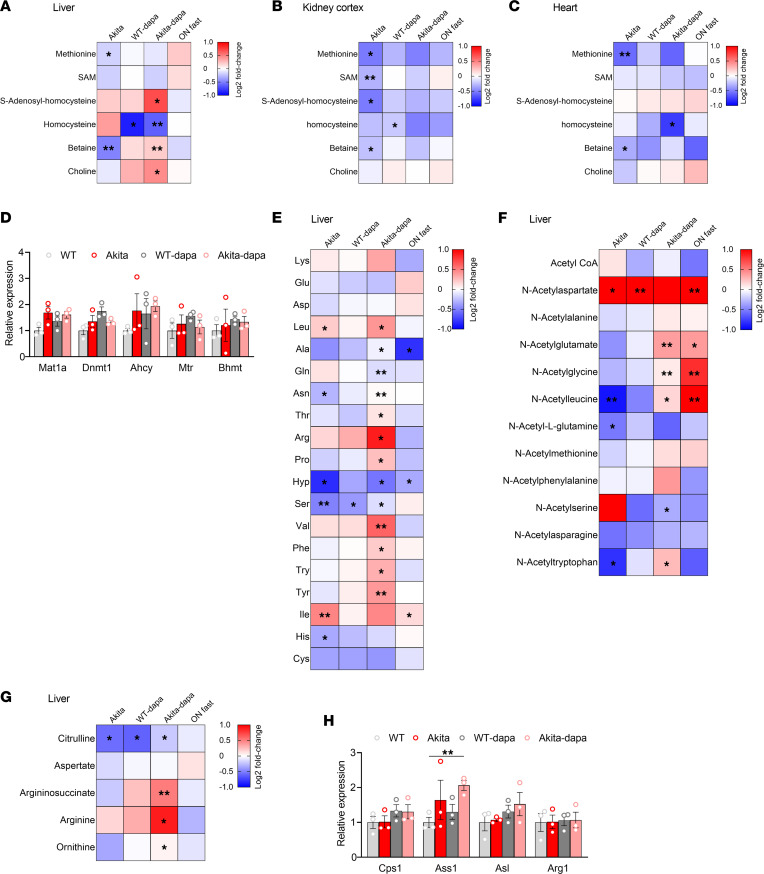
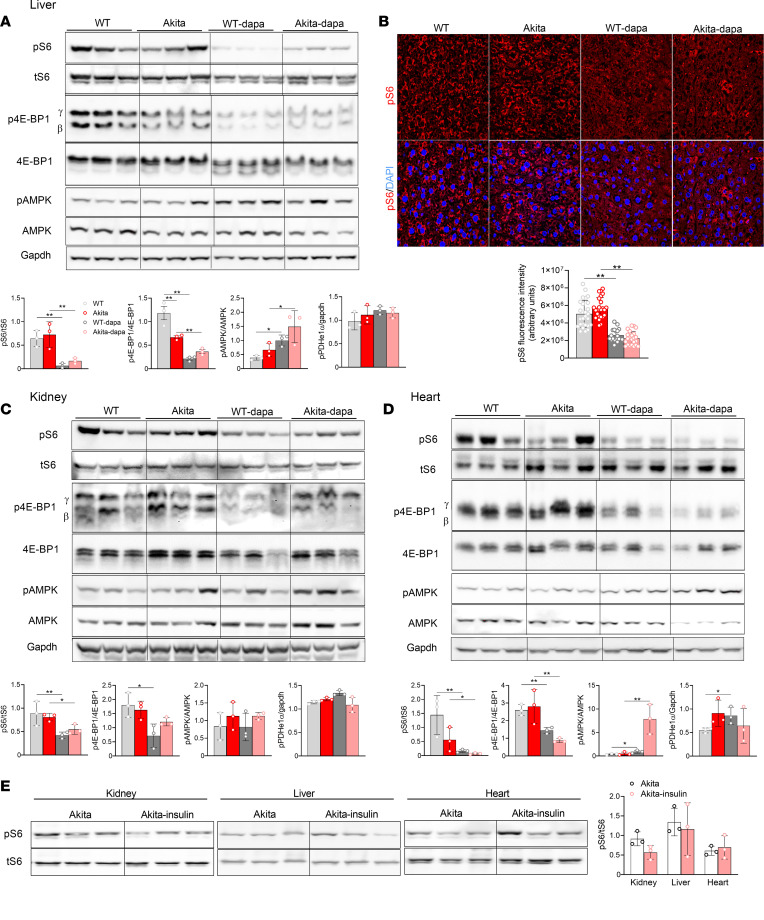
Diabetes is associated with increased risk for kidney disease, heart failure, and mortality. Sodium-glucose cotransporter 2 inhibitors (SGLT2i) prevent these adverse outcomes; however, the mechanisms involved are not clear. We generated a roadmap of the metabolic alterations that occur in different organs in diabetes and in response to SGLT2i. In vivo metabolic labeling with 13C-glucose in normoglycemic and diabetic mice treated with or without dapagliflozin, followed by metabolomics and metabolic flux analyses, showed that, in diabetes, glycolysis and glucose oxidation are impaired in the kidney, liver, and heart. Treatment with dapagliflozin failed to rescue glycolysis. SGLT2 inhibition increased glucose oxidation in all organs; in the kidney, this was associated with modulation of the redox state. Diabetes was associated with altered methionine cycle metabolism, evident by decreased betaine and methionine levels, whereas treatment with SGLT2i increased hepatic betaine along with decreased homocysteine levels. mTORC1 activity was inhibited by SGLT2i along with stimulation of AMPK in both normoglycemic and diabetic animals, possibly explaining the protective effects against kidney, liver, and heart diseases. Collectively, our findings suggest that SGLT2i induces metabolic reprogramming orchestrated by AMPK-mTORC1 signaling with common and distinct effects in various tissues, with implications for diabetes and aging.

Keywords: Diabetes; Glucose metabolism; Metabolism; Signal transduction; Therapeutics.


Conflict of interest statement

Conflict of interest: The authors have declared that no conflict of interest exists.

Figures

Figure 1
Figure 1. Metabolic effects of treatment with SGLT2i in WT and Akita mice.
(AH) Two-month-old WT mice fed on regular chow were treated with or without dapagliflozin (10 mg/kg/day in drinking water for 2 weeks) compared with untreated controls. (A) IPGTT; glucose (1.5 g/kg) was given i.p. after a 4-hour fast. (B and C) Continuous measurement of blood glucose using FreeStyle Libre flash monitoring system. Average glucose levels and glucose variability (Stdev) during the dark and light periods before and after adding dapagliflozin and a representative plot are shown. (D) Insulin tolerance test; insulin (1 U/kg) was injected to mice after a 4-hour fast with consecutive measurements of blood glucose. Results are expressed as percentage of glucose levels at time 0. Blood glucose levels at baseline were 137.7 ± 18.4 and 127.1 ± 23.3 mg/dL in control and dapagliflozin treated mice, respectively. (E) Steady-state mTORC1 activity in muscle, evident by S6 phosphorylation; lanes were run on the same gel but were noncontiguous. (F and G) Insulin-stimulated AKT phosphorylation is shown in muscle and liver. Insulin (3 U/kg mice) was injected i.p. after an overnight fast. Gastrocnemius muscle and the liver were isolated and extracted after 5 minutes, and AKT phosphorylation was analyzed by Western blotting. Data represent the mean ± SEM of 3–8 mice per group. (H and I) Two-month-old Akita mice were fed on regular chow and treated without or with dapagliflozin (10 mg/kg/day in drinking water) for 1 week. (H) Overnight fasting blood glucose levels. (I) IPGTT was performed after an overnight fast. Data represent the mean ± SEM of 3–8 mice per group. Data were analyzed by unpaired 2-tailed Student’s t test (AE) or by 2-way ANOVA (FI). *P < 0.05, **P < 0.01, ***P < 0.001.
Figure 2
Figure 2. Effect of diabetes and of SGLT2i on glycolysis and glucose oxidation in kidney cortex extracts of WT and Akita mice.
WT and Akita mice were treated with and without dapagliflozin for 1 week, followed by 13C-glucose injections and metabolomics and metabolic flux analyses. (A) Unlabeled levels of glycolytic intermediates in kidney cortex extracts. Shown are the relative levels of unlabeled (12C) glucose and 13C-labeled glycolytic intermediates. A schematic representation of glycolysis is shown. (B) Relative abundance of 13C-labeled glucose and glycolytic intermediates in kidney cortex. (C) Relative abundance of 13C-labeled tricarboxylic acid (TCA) cycle metabolites in kidney cortex. A schematic representation of the TCA cycle is shown. (D) mRNA levels of Pdk1-4 in kidney cortex. (E) Western blotting on kidney extracts for phosphorylated pyruvate dehydrogenase α1 (pPDHe1α) and GAPDH. (F) mRNA expression of TCA cycle enzymes in kidney cortex. Data represent the mean ± SEM, n = 3–6 mice per group. For statistical analysis, we used the sum of all 13C isotopologues for each metabolite or the unlabeled + 13C-labeled metabolites. Data were analyzed by 2-way ANOVA. *P < 0.05, **P < 0.01.
Figure 3
Figure 3. Effect of diabetes and of SGLT2i on glycolysis and glucose oxidation in liver of WT and Akita mice.
WT and Akita mice were treated with and without dapagliflozin for 1 week, followed by 13C-glucose injections and metabolomics and metabolic flux analyses. (A) Unlabeled levels of glycolytic intermediates in liver extracts. Shown are the relative levels of unlabeled (12C) glucose and 13C-labeled glycolytic intermediates. (B) mRNA expression of glycolytic enzymes in liver. (C) Pyruvate kinase activity in liver homogenate. (D) GAPDH activity in liver homogenate. (E) Relative abundance of 13C-labeled tricarboxylic acid (TCA) cycle metabolites in liver. (F) mRNA levels of Pdk1–4 in liver. (G) Western blotting on liver extracts for phosphorylated pyruvate dehydrogenase α1 (pPDHe1α) and GAPDH. (H) mRNA expression of TCA cycle enzymes in liver. Data represent the mean ± SEM, n = 3–6 mice per group. For statistical analysis, we used the sum of all 13C isotopologues for each metabolite or the unlabeled + 13C-labeled metabolites. Data were analyzed by 2-way ANOVA. *P < 0.05, **P < 0.01.
Figure 4
Figure 4. Effect of diabetes and of SGLT2i on glycolysis and glucose oxidation in heart of WT and Akita mice.
WT and Akita mice were treated with and without dapagliflozin for 1 week, followed by 13C-glucose injections and metabolomics and metabolic flux analyses. (A) Unlabeled levels of glycolytic intermediates in heart extracts. Shown are the relative levels of unlabeled (12C) glucose and 13C-labeled glycolytic intermediates. (B) Relative abundance of 13C-labeled tricarboxylic acid (TCA) cycle metabolites in heart. Data represent the mean ± SEM, n = 6 mice per group. For statistical analysis, we used the sum of all 13C isotopologues for each metabolite or the unlabeled + 13C-labeled metabolites. Data were analyzed by 2-way ANOVA. *P < 0.05, **P < 0.01.
Figure 5
Figure 5. Effect of insulin on glycolysis and glucose oxidation in kidney cortex and liver extracts of Akita mice.
Akita mice were treated with and without insulin for 5 days followed by 13C-glucose injections and metabolomics and metabolic flux analyses. (A and B) 13C-labeled glycolytic intermediates tricarboxylic acid (TCA) cycle metabolites in kidney cortex. (C and D) 13C-labeled glycolytic intermediates and TCA cycle intermediates in liver. Data represent the mean ± SEM, n = 6 mice per group. For statistical analysis, we used the sum of all 13C isotopologues for each metabolite. Data were analyzed by unpaired 2-tailed Student’s t test. *P < 0.05, **P < 0.01.
Figure 6
Figure 6. Effect of insulin on glycolysis and glucose oxidation in heart and plasma extracts of Akita mice.
Akita mice were treated with and without insulin for 5 days followed by 13C-glucose injections and metabolomics and metabolic flux analyses. (A and B) 13C-labeled glycolytic and TCA cycle metabolites in the heart. (C and D) 13C-labeled glycolytic and TCA cycle intermediates in plasma. Data represent the mean ± SEM, n = 6 mice per group. For statistical analysis, we used the sum of all 13C isotopologues for each metabolite. Data were analyzed by unpaired 2-tailed Student’s t test. *P < 0.05, **P < 0.01.
Figure 7
Figure 7. Effects of diabetes and of treatment with SGLT2i on one carbon and amino acid metabolism.
(AC) Heatmaps showing the relative levels of one carbon pathway metabolites in liver (A), kidney cortex (B), and heart (C). (D) mRNA levels of methionine cycle-related enzymes in the liver. (EG) Heatmaps showing the relative levels of hepatic amino acids (E), acetylated amino acids (F), and urea cycle metabolites (G). Each square represents the average metabolite log2 fold change relative to WT control mice. (H) mRNA levels of urea cycle enzymes in liver extracts. Data represent the mean ± SEM, n = 3–6 mice per group. Data were analyzed by 2-way ANOVA. *P < 0.05, **P < 0.01.
Figure 8
Figure 8. SGLT2i effects on mTORC1 and AMPK activity in WT and Akita mice.
(A) Western blotting on liver extracts for phosphorylated S6 (pS6), tS6, phosphorylated 4E-PB1, 4E-BP1, phosphorylated AMP-activated protein kinase (pAMPK), AMPK, and GAPDH. (B) Immunofluorescence staining for pS6 on liver sections of 2-month-old WT and Akita mice treated with and without dapagliflozin. Total original magnification, 60×. (C) Western blotting on kidney extracts for pS6, tS6, phosphorylated 4E-PB1, 4E-BP1, phosphorylated AMPK (pAMPK), AMPK, and GAPDH. (D) Western blotting on heart extracts for pS6, S6, phosphorylated 4E-PB1, 4E-BP1, pAMPK, AMPK, and GAPDH. (E) Western blotting for pS6 and tS6 on kidney, liver, and heart extracts of Akita mice treated with and without insulin. Representative blots and quantifications are shown. Data represent the mean ± SEM, n = 3–6 mice per group. Data were analyzed by 2-way ANOVA (AD) or by unpaired Student’s t test (E). *P < 0.05, **P < 0.01.

Similar articles

Cited by

References

    1. Gilbert RE. Proximal tubulopathy: prime mover and key therapeutic target in diabetic kidney disease. Diabetes. 2017;66(4):791–800. doi: 10.2337/db16-0796. - DOI - PubMed
    1. Ferrannini E. Sodium-glucose co-transporters and their inhibition: clinical physiology. Cell Metab. 2017;26(1):27–38. doi: 10.1016/j.cmet.2017.04.011. - DOI - PubMed
    1. DeFronzo RA, et al. Renal, metabolic and cardiovascular considerations of SGLT2 inhibition. Nat Rev Nephrol. 2017;13(1):11–26. doi: 10.1038/nrneph.2016.170. - DOI - PubMed
    1. Mosenzon O, et al. Effects of dapagliflozin on development and progression of kidney disease in patients with type 2 diabetes: an analysis from the DECLARE-TIMI 58 randomised trial. Lancet Diabetes Endocrinol. 2019;7(8):606–617. doi: 10.1016/S2213-8587(19)30180-9. - DOI - PubMed
    1. Perkovic V, et al. Canagliflozin and renal outcomes in type 2 diabetes and nephropathy. N Engl J Med. 2019;380(24):2295–2306. doi: 10.1056/NEJMoa1811744. - DOI - PubMed

Publication types