. 2023 Jul 25;7(14):3366-3377.
doi: 10.1182/bloodadvances.2023009668.

Physioxia improves the selectivity of hematopoietic stem cell expansion cultures

Affiliations

Physioxia improves the selectivity of hematopoietic stem cell expansion cultures

Kyomi J Igarashi et al. Blood Adv. .

Abstract

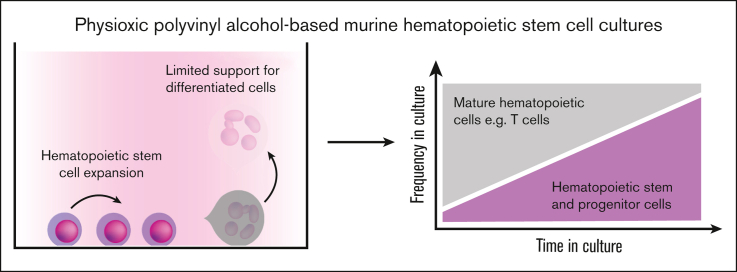
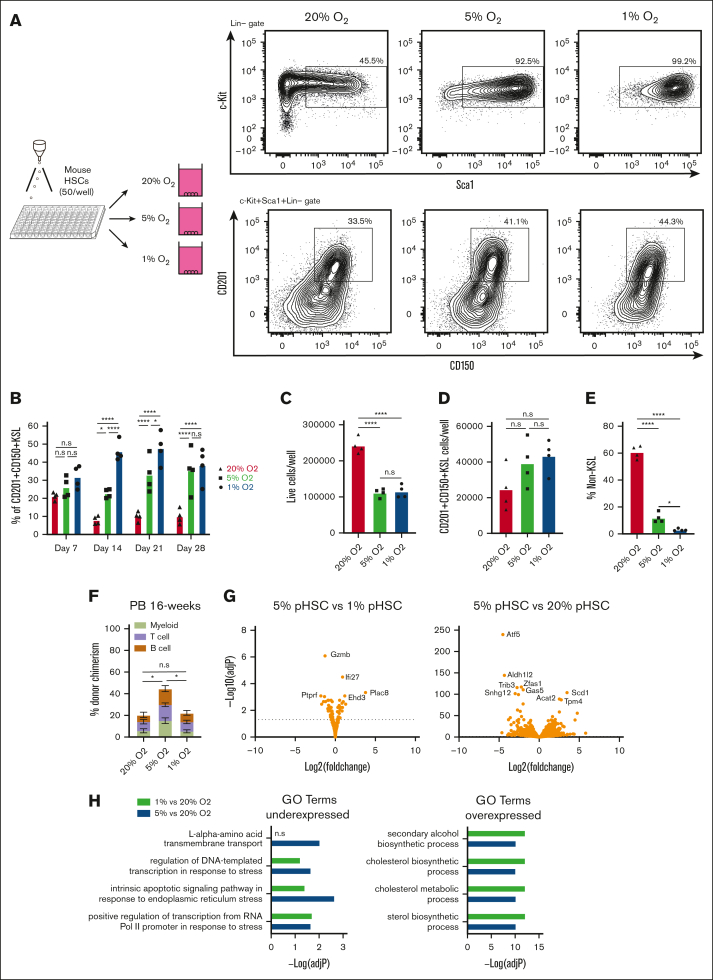
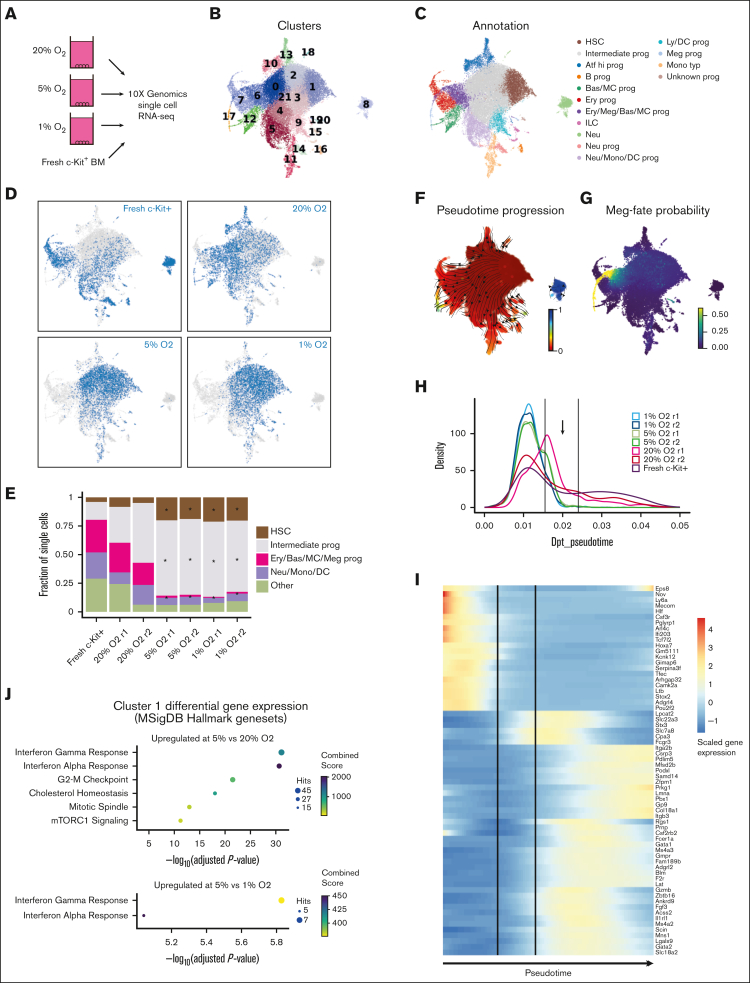
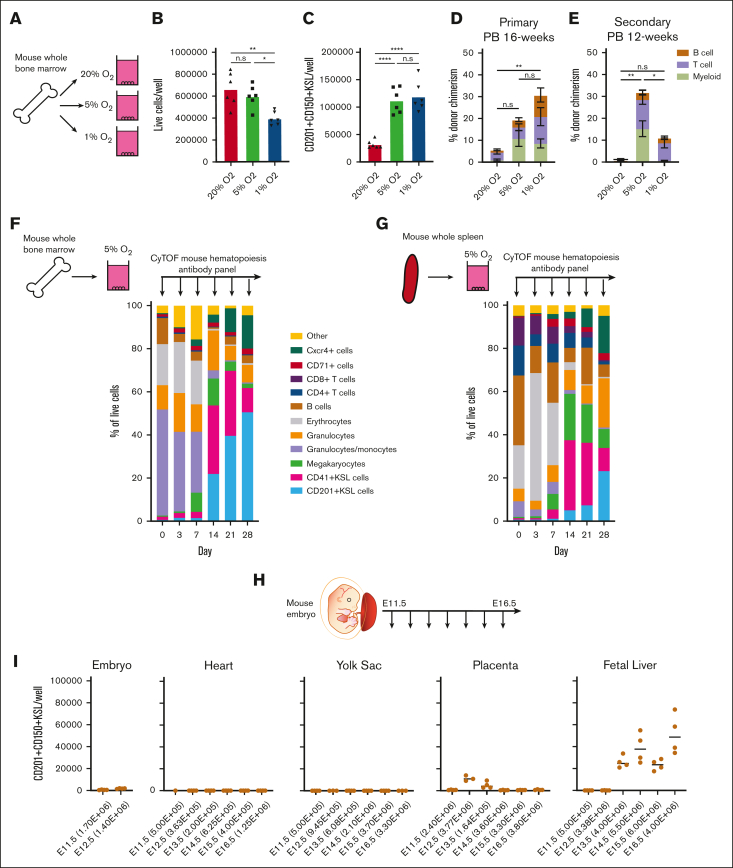
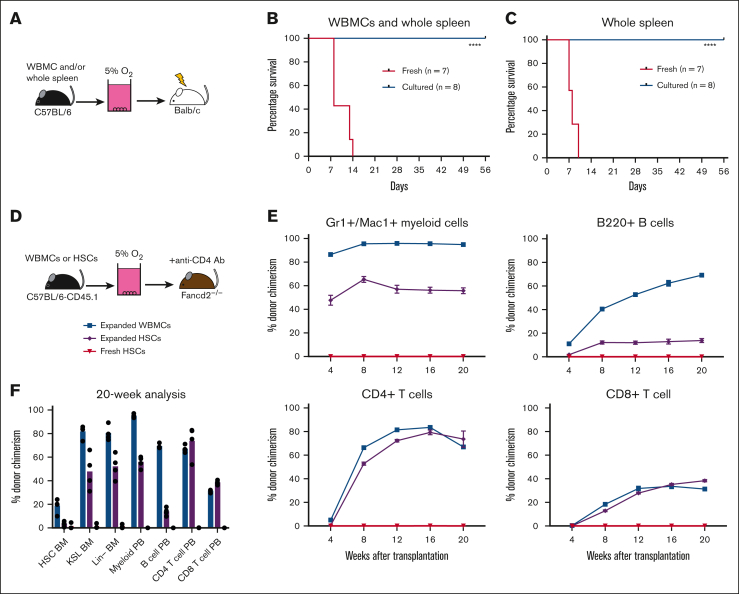
Hematopoietic stem cells (HSCs) are a rare type of hematopoietic cell that can entirely reconstitute the blood and immune system after transplantation. Allogeneic HSC transplantation (HSCT) is used clinically as a curative therapy for a range of hematolymphoid diseases; however, it remains a high-risk therapy because of its potential side effects, including poor graft function and graft-versus-host disease (GVHD). Ex vivo HSC expansion has been suggested as an approach to improve hematopoietic reconstitution in low-cell dose grafts. Here, we demonstrate that the selectivity of polyvinyl alcohol (PVA)-based mouse HSC cultures can be improved using physioxic culture conditions. Single-cell transcriptomic analysis helped confirm the inhibition of lineage-committed progenitor cells in physioxic cultures. Long-term physioxic expansion also afforded culture-based ex vivo HSC selection from whole bone marrow, spleen, and embryonic tissues. Furthermore, we provide evidence that HSC-selective ex vivo cultures deplete GVHD-causing T cells and that this approach can be combined with genotoxic-free antibody-based conditioning HSCT approaches. Our results offer a simple approach to improve PVA-based HSC cultures and the underlying molecular phenotype, and highlight the potential translational implications of selective HSC expansion systems for allogeneic HSCT.


Conflict of interest statement

Conflict-of-interest disclosure: H.N. is a cofounder and shareholder in Celaid, Megakaryon and Century Therapeutics. A.C.W. is a consultant for Graphite Bio and ImmuneBridge. A.C. discloses financial interests in the following entities working in the rare genetic disease space: Beam Therapeutics, Decibel Therapeutics, Editas Medicine, Global Blood Therapeutics, GV, Lyrik Pharma, Magenta Therapeutics, and Spotlight Therapeutics. IK is currently employed by Xap Therapeutics. The remaining authors declare no competing financial interests.

Figures

None
Graphical abstract
Figure 1.
Figure 1.
Improved stability of PVA-based HSC cultures at low O2 concentrations. (A) Schematic diagram of low O2 HSC cultures (left). Mouse CD150+CD34-KSL HSCs were sorted into PVA-based media in 96-well plates (50 cells per well) in 200 μL of media and were cultured for 4 weeks at 20%, 5%, or 1% O2. Representative flow cytometry plots of 4-week HSC-derived cultures (right). c-Kit and Sca1 expression within the lineage cell fraction (top), and CD201 and CD150 expression within the KSL cell fraction (bottom). (B) Mean frequency of CD201+CD150+KSL cells within the HSC-derived cultures described in panel A (n = 4). (C) Mean number of live cells per well within HSC-derived cultures described in panel A (n = 4). (D) Mean number of CD201+CD150+KSL cells per well within the HSC-derived cultures as described in panel A (n = 4). (E) Mean number of non-KSL cells per well within the HSC-derived cultures described in panel A (n = 4). (F) 16-week donor peripheral blood (PB) chimerism from 4-week-old HSC-derived cultures incubated at 20%, 5%, or 1% O2. Five thousand cells from each culture were transplanted alongside 1 × 106 WBMCs into lethally irradiated recipients (mean ± standard deviation [SD]; n = 8-9). (G) Differential gene expression analysis between 5% O2 pHSC and 1% O2 pHSC samples (left) and between 5% O2 pHSC and 20% O2 pHSC samples (right). Results are displayed as Log2 (fold change) vs –Log (adjusted P value). (H) Gene Ontology (GO) term enrichment analysis for underexpressed and overexpressed genes in the 5% O2 and 20% O2 pHSC samples. (I) Fold change in CD201+CD150+KSL cells relative to control well after a 7-day culture with the indicated compounds at 20% O2. Of the 116 compounds tested, only 74 that supported cell survival/growth are displayed (see supplemental Table 1 for a full list of the compounds). Cell cultures were initiated with 50 CD201+CD150+KSL cells from 3-week HSC cultures. The mean of the 4 wells (from 2 biological replicates) is displayed. (J) Mean frequency of CD201+CD150+KSL cells (left) and mean number of live cells per well (left) within 7-day HSC-derived cultures at 20% O2, 5% O2, or 1% O2, cultured with either dimethyl sulfoxide or the mitochondrial complex I inhibitor IACS-01-759 (20 nM; n = 6). Statistical analysis was performed using analysis of variance (ANOVA). ∗P < .05; ∗∗∗∗P < .0001. n.s., not significant; RNA Pol II, RNA polymerase II.
Figure 1.
Figure 1.
Improved stability of PVA-based HSC cultures at low O2 concentrations. (A) Schematic diagram of low O2 HSC cultures (left). Mouse CD150+CD34-KSL HSCs were sorted into PVA-based media in 96-well plates (50 cells per well) in 200 μL of media and were cultured for 4 weeks at 20%, 5%, or 1% O2. Representative flow cytometry plots of 4-week HSC-derived cultures (right). c-Kit and Sca1 expression within the lineage cell fraction (top), and CD201 and CD150 expression within the KSL cell fraction (bottom). (B) Mean frequency of CD201+CD150+KSL cells within the HSC-derived cultures described in panel A (n = 4). (C) Mean number of live cells per well within HSC-derived cultures described in panel A (n = 4). (D) Mean number of CD201+CD150+KSL cells per well within the HSC-derived cultures as described in panel A (n = 4). (E) Mean number of non-KSL cells per well within the HSC-derived cultures described in panel A (n = 4). (F) 16-week donor peripheral blood (PB) chimerism from 4-week-old HSC-derived cultures incubated at 20%, 5%, or 1% O2. Five thousand cells from each culture were transplanted alongside 1 × 106 WBMCs into lethally irradiated recipients (mean ± standard deviation [SD]; n = 8-9). (G) Differential gene expression analysis between 5% O2 pHSC and 1% O2 pHSC samples (left) and between 5% O2 pHSC and 20% O2 pHSC samples (right). Results are displayed as Log2 (fold change) vs –Log (adjusted P value). (H) Gene Ontology (GO) term enrichment analysis for underexpressed and overexpressed genes in the 5% O2 and 20% O2 pHSC samples. (I) Fold change in CD201+CD150+KSL cells relative to control well after a 7-day culture with the indicated compounds at 20% O2. Of the 116 compounds tested, only 74 that supported cell survival/growth are displayed (see supplemental Table 1 for a full list of the compounds). Cell cultures were initiated with 50 CD201+CD150+KSL cells from 3-week HSC cultures. The mean of the 4 wells (from 2 biological replicates) is displayed. (J) Mean frequency of CD201+CD150+KSL cells (left) and mean number of live cells per well (left) within 7-day HSC-derived cultures at 20% O2, 5% O2, or 1% O2, cultured with either dimethyl sulfoxide or the mitochondrial complex I inhibitor IACS-01-759 (20 nM; n = 6). Statistical analysis was performed using analysis of variance (ANOVA). ∗P < .05; ∗∗∗∗P < .0001. n.s., not significant; RNA Pol II, RNA polymerase II.
Figure 2.
Figure 2.
Single-cell transcriptomics identifies the molecular consequences of low O2 concentration on HSC cultures. (A) Schematic of the scRNA-seq analysis of hematopoietic stem and progenitor cells (HSPCs) cultured at different O2 concentrations. (B) UMAP projections of all samples with color-coded cluster memberships. (C) Manual annotation of the clusters in panel B based on marker gene expression. (D) Uniform Manifold Approximation and Projection (UMAP) of all cells (gray) and cells from the indicated conditions (blue). In each case, an equal cell number was randomly selected for each sample. (E) Bar plot indicating relative cell abundance in the landscape areas for each sample. Areas were chosen as follows: HSC, cluster 1; Intermediate prog, clusters 0 and 2 to 4; Ery/Bas/MC/Meg prog, clusters 6, 7, and 17; Neu/Mono/DC, clusters 5, 11, and 14; and other, remaining clusters. (F) UMAP projection color-coded with diffusion pseudotime values, overlaid with arrows indicating putative paths of differentiation using random walks estimation with CellRank Pseudotime Kernel. (G) UMAP projection color-coded by the cell fate probability of cells differentiating into the tip of cluster 17 (megakaryocytes). (H) Cell density along the trajectory shown in panel G for each sample and pseudotime values between 0 and 0.05 are shown. Vertical lines indicate the regions of interest where cells at 5% and 1% O2 disappear. (I) Heatmap of genes differentially expressed between the beginning and end of the region of interest shown in panel H. (J) Enrichr gene enrichment analysis of upregulated genes within cluster 1 at 5% O2, compared with 20% (left) and 1% O2 (right). ∗ in panel E indicates a statistically significant change in cell abundance (FDR < 0.05) compared with the 20% O2 condition. Bas, basophil; Ery, erythroid; ILC, innate lymphoid cell; Ly/DC, lymphoid/dendritic cell; meg, megakaryocyte; MC, mast cell; monotyp, typical monocyte; neu, neutrophil; prog, progenitor.
Figure 3.
Figure 3.
Low O2 cultures expand HSCs from unfractionated WBMCs and embryonic tissues. (A) Schematic diagram of low O2 WBMC cultures. Unfractionated mouse WBMCs were seeded into PVA-based media in 24-well plates (5 × 106 cells per well) in 1 ml of media and cultured for 4 weeks at 20%, 5%, or 1% O2. (B) The mean number of live cells per well within the WBMC-derived cultures described panel in A on day-28 (n = 6). (C) The mean number of CD201+CD150+KSL cells per well within the WBMC-derived cultures described in panel A on day-28 (n = 6). (D) 16-week donor peripheral blood (PB) chimerism from 4-week-old WBMC-derived cultures incubated in 20%, 5%, or 1% O2. Five thousand cells from each culture were transplanted along with 1×10⁶ WBMCs into lethally irradiated recipients (mean ± SD; n = 3-5). (E) Twelve-week donor peripheral blood chimerism after secondary transplantation of WBMCs from primary recipient mice described in panel D (Mean ± SD; n = 3-4). (F) Schematic diagram of the CyTOF time course during 5% O2 WBMC cultures (left) and the frequency of immunophenotypic cell populations at the indicated time points (right). See supplemental Figure 5B for cell immunophenotypes. (G) Schematic diagram of the CyTOF time course during 5% O2 whole spleen cell cultures (left) and the frequency of immunophenotypic cell populations for 28-day cultures (right). supplemental Figure 5B shows cell immunophenotypes. (H) Schematic diagram of selective HSC expansion assay for mouse embryonic tissues. (I) The mean number of CD201+CD150+KSL cells generated from E11.5 to 12.5 embryonic tissue (excluding extraembryonic tissues and fetal liver) and from E11.5 to 16.5 heart, yolk sac, placenta, and fetal liver-derived cultures. The starting cell number are indicated in brackets seeded in 1 mL of media. Statistical analysis was performed using ANOVA.; ∗P < .05; ∗∗P < .01; ∗∗∗∗P < .0001. n.s., not significant.
Figure 4.
Figure 4.
Low O2 selective HSC cultures help avoid GVHD. (A) Schematic diagram of allogeneic transplantation assay. Unfractionated WBMCs and/or spleen cells from C57BL/6 mice were transplanted into irradiated Balb/c mice before or after 4-week PVA-based culture. (B) Survival of Balb/c recipients in the assay described in panel B, after transplantation of 5 × 106 WBMCs and 5 × 106 whole spleen cells (fresh or cultured) from C57BL/6 mice (n = 7-8). Statistical analysis was performed using the Mantel-Cox test. (C) Survival of Balb/c recipients in the assay described in panel B, after the transplantation of 5 × 106 whole spleen cells (fresh or cultured) from C57BL/6 mice (n = 7-8). Statistical analysis was performed using Mantel-Cox test. (D) Schematic diagram of antibody conditioning transplantation assay. Four-week cultured WBMCs (derived from 20 × 106 WBMCs), 4-week cultured HSCs (derived from 500 HSCs), or 5000 fresh HSCs from C57BL/6-CD45.1 mice were transplanted into Fancd2–/–-CD45.2 mice 7 days after treatment with the anti-CD4 (GK1.5) antibody. (E) Donor chimerism in the Fancd2–/– recipient mice at 4 or 20 weeks with peripheral blood Mac1+Gr1+ myeloid cells (top left), B220+ B cells (top right), CD4+CD3+ T cells (bottom left), and CD8+CD3+ T cells (bottom right) (n = 4). (F) Donor chimerism in the Fancd2–/– bone marrow and peripheral blood compartments of recipients described in panel F (n = 4). ∗∗∗∗P < .0001.

References

    1. Wilkinson AC, Igarashi KJ, Nakauchi H. Haematopoietic stem cell self-renewal in vivo and ex vivo. Nat Rev Genet. 2020;21(9):541–554. - PMC - PubMed
    1. Eaves CJ. Hematopoietic stem cells: concepts, definitions, and the new reality. Blood. 2015;125(17):2605–2613. - PMC - PubMed
    1. Orkin SH, Zon LI. Hematopoiesis: an evolving paradigm for stem cell biology. Cell. 2008;132(4):631–644. - PMC - PubMed
    1. Dzierzak E, Speck NA. Of lineage and legacy: the development of mammalian hematopoietic stem cells. Nat Immunol. 2008;9(2):129–136. - PMC - PubMed
    1. Morrison SJ, Scadden DT. The bone marrow niche for haematopoietic stem cells. Nature. 2014;505(7483):327–334. - PMC - PubMed

Publication types

MeSH terms