. 2023 Feb 21;23(1):174.
doi: 10.1186/s12885-023-10588-w.

Glycosylation spectral signatures for glioma grade discrimination using Raman spectroscopy

Affiliations

Glycosylation spectral signatures for glioma grade discrimination using Raman spectroscopy

Agathe Quesnel et al. BMC Cancer. .

Abstract

Background: Gliomas are the most common brain tumours with the high-grade glioblastoma representing the most aggressive and lethal form. Currently, there is a lack of specific glioma biomarkers that would aid tumour subtyping and minimally invasive early diagnosis. Aberrant glycosylation is an important post-translational modification in cancer and is implicated in glioma progression. Raman spectroscopy (RS), a vibrational spectroscopic label-free technique, has already shown promise in cancer diagnostics.

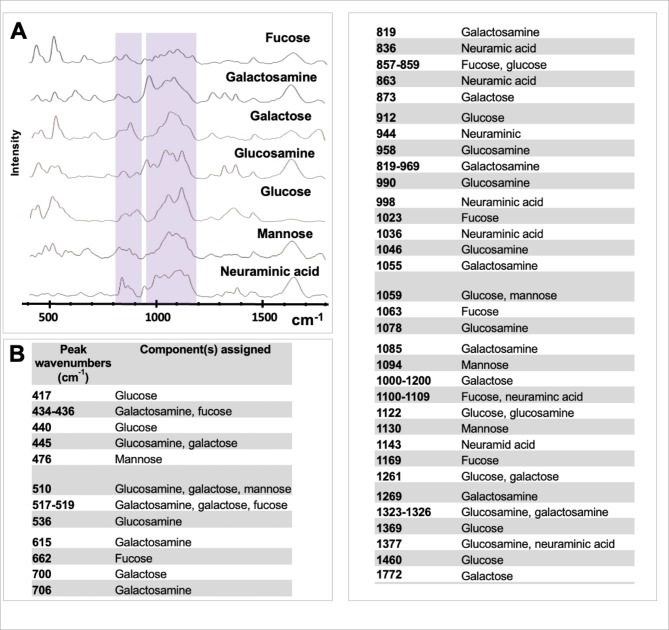
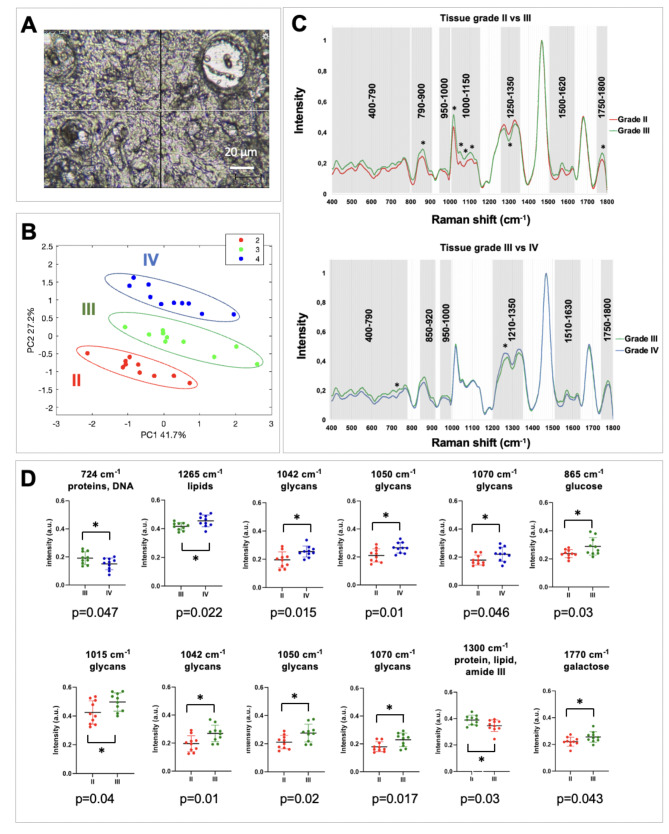
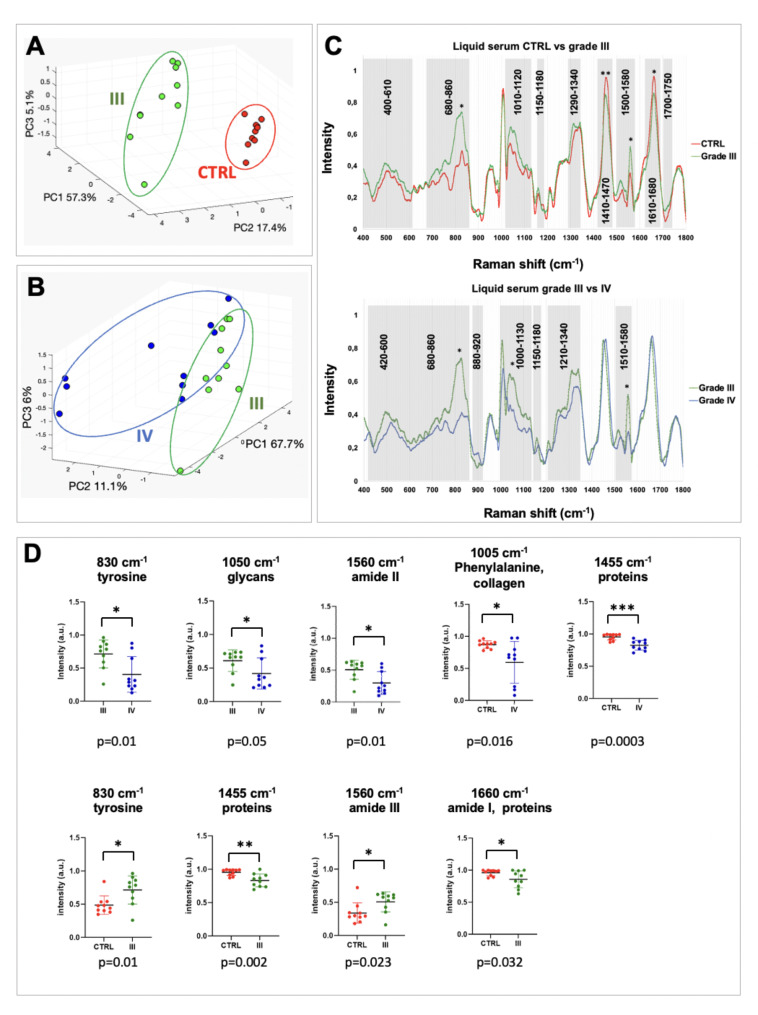
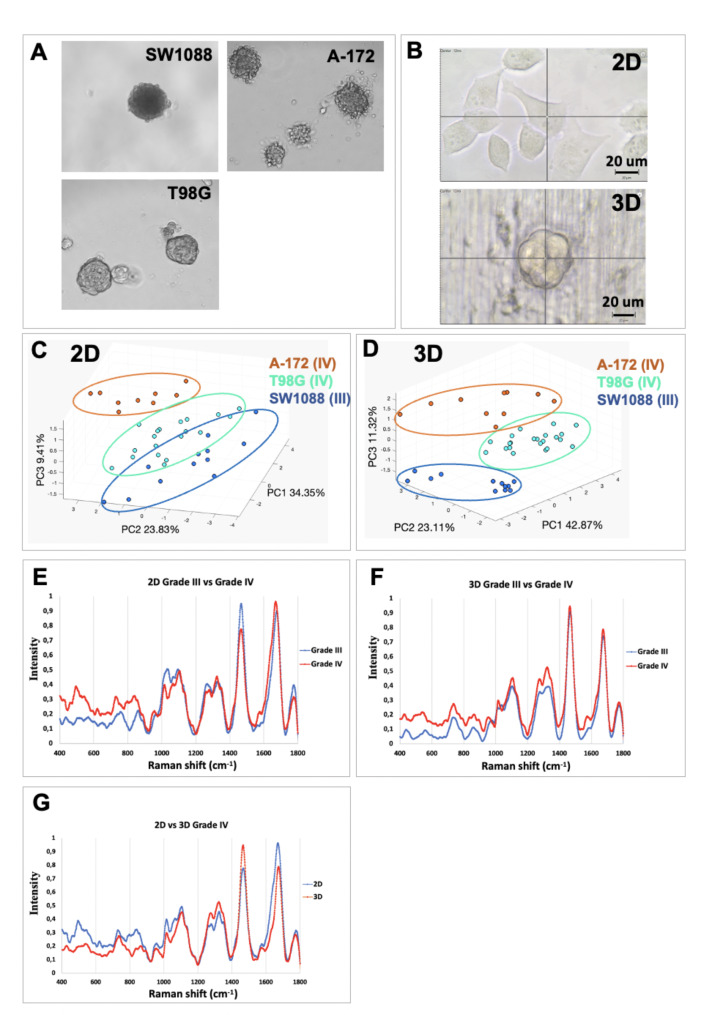
Methods: RS was combined with machine learning to discriminate glioma grades. Raman spectral signatures of glycosylation patterns were used in serum samples and fixed tissue biopsy samples, as well as in single cells and spheroids.

Results: Glioma grades in fixed tissue patient samples and serum were discriminated with high accuracy. Discrimination between higher malignant glioma grades (III and IV) was achieved with high accuracy in tissue, serum, and cellular models using single cells and spheroids. Biomolecular changes were assigned to alterations in glycosylation corroborated by analysing glycan standards and other changes such as carotenoid antioxidant content.

Conclusion: RS combined with machine learning could pave the way for more objective and less invasive grading of glioma patients, serving as a useful tool to facilitate glioma diagnosis and delineate biomolecular glioma progression changes.

Keywords: Biomolecular signatures; Diagnosis; Glioblastoma; Gliomas; Glycosylation; Raman spectroscopy.


Conflict of interest statement

The authors declare that they have no potential conflicts of interest.

Figures

Fig. 1
Fig. 1
Glycosylation database. (A) Mean spectra for each glycan. Pink areas correspond to shared increased intensities between all glycans. (B) Characteristic peaks of the different glycans are listed
Fig. 2
Fig. 2
Grade discrimination from FFPE tissue samples. (A) Example view of a GBM tissue sample with the Raman microscope after dewaxing, before acquisition. Main structures are visible (vessels, red blood cells, cancer cells) and can be targeted. (B) PCA plot of the 30 glioma FFPE samples. Grade II (in red), grade III (in green), and grade IV (in blue) are easily discriminated by using the two largest principal components. (C) Pair-wise comparison between the averaged spectra of grade II and grade III, and grade III and grade IV. Asterisks indicate the peaks that were significantly different using an unpaired t-test. (D) Scatter plots of individual intensities (and mean ± standard deviation) at peaks showing significant difference using a two-tailed unpaired t-test. Circles drawn on PCA plot highlight trends assessed subjectively by eye
Fig. 3
Fig. 3
Grade discrimination from fresh serum samples. 3D PCA plot of glioma blood serum samples using the three largest principal components (PC1, PC2, PC3). Control (CTRL) and grade III samples can be discriminated (A) as well as grade III and grade IV (B), grade III and grade IV have a wider distribution in comparison with control samples. (C) Pair-wise comparison between the averaged spectra of control and grade III, and grade III and grade IV. Asterisks indicate the peaks that were significantly different using the t-test, while areas shaded in grey highlight important differences. (D) Scatter plots of individual intensities (and mean ± standard deviation) at peaks showing significant difference using a two-tailed unpaired t-test. Circles drawn on PCA plot highlight trends assessed subjectively by eye
Fig. 4
Fig. 4
Discrimination in glioma cell lines. (A) Images representing the multicellular spheroids generated by the hanging drop method for the three cell lines, magnification 200X. (B) Images representing cells grown in 2D (monolayers) and 3D (spheroids) under the Raman confocal microscope after 48 h before acquisition. (C) 3D PCA plot of the individual cells (one dot represents one cell) grown in 2D using the three first PCs. (D) 3D PCA plot of all the individual spheroids using the three largest PCs. (E) Pair-wise comparison between the mean spectra of grade III and grade IV individual cells. (F) Pair-wise comparison between the mean spectra of grade III and grade IV spheroids. (G) Pair-wise comparison between the mean spectra of grade IV 2D and grade IV 3D cells. Circles drawn on PCA plot highlight trends assessed subjectively by eye

References

    1. Paw I, Carpenter RC, Watabe K, Debinski W, Lo HW. Mechanisms regulating glioma invasion. Cancer Lett. 2015;362(1):1–7. doi: 10.1016/j.canlet.2015.03.015. - DOI - PMC - PubMed
    1. Davis ME, Glioblastoma Overview of Disease and Treatment. Clin J Oncol Nurs. 2016;20(5 Suppl):2–8. doi: 10.1188/16.CJON.S1.2-8. - DOI - PMC - PubMed
    1. Wesseling P, Capper D. WHO 2016 classification of gliomas. Neuropathol Appl Neurobiol. 2018;44(2):139–50. doi: 10.1111/nan.12432. - DOI - PubMed
    1. Louis DN, Perry A, Wesseling P, Brat DJ, Cree IA, Figarella-Branger D, et al. The 2021 WHO classification of tumors of the Central Nervous System: a summary. Neurooncology. 2021;23(8):1231–51. - PMC - PubMed
    1. Collins VP, Jones DT, Giannini C. Pilocytic astrocytoma: pathology, molecular mechanisms and markers. Acta Neuropathol. 2015;129(6):775–88. doi: 10.1007/s00401-015-1410-7. - DOI - PMC - PubMed