

Predicting later categories of upper limb activity from earlier clinical assessments following stroke: an exploratory analysis
- PMID: 36810072
- PMCID: PMC9945671
- DOI: 10.1186/s12984-023-01148-1
Predicting later categories of upper limb activity from earlier clinical assessments following stroke: an exploratory analysis
Abstract
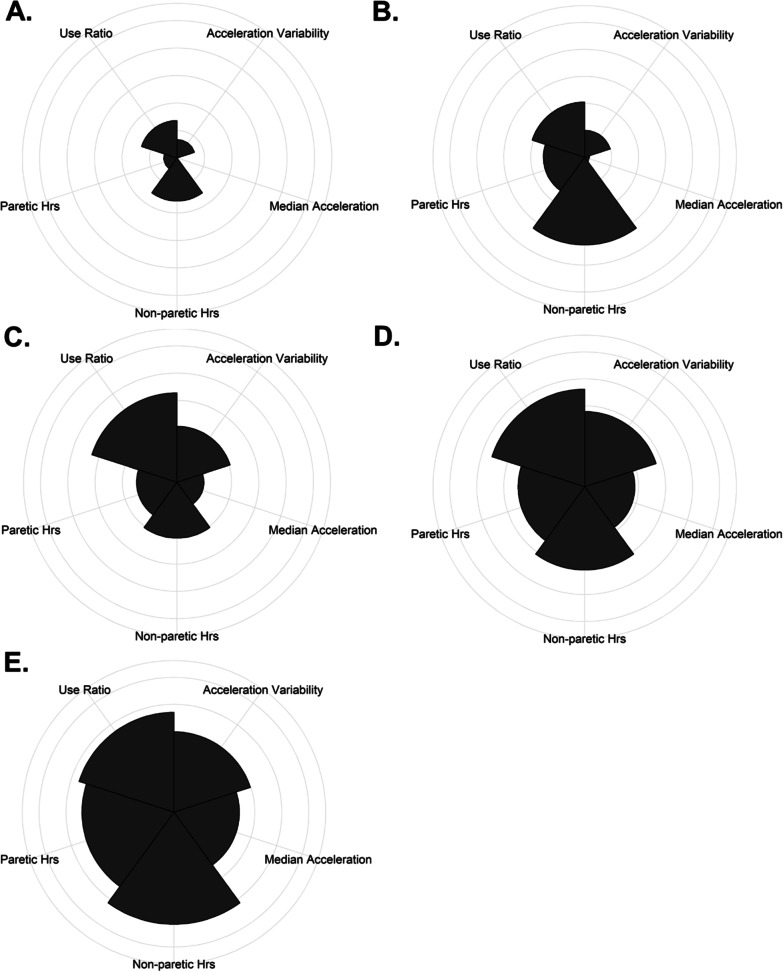
Background: Accelerometers allow for direct measurement of upper limb (UL) activity. Recently, multi-dimensional categories of UL performance have been formed to provide a more complete measure of UL use in daily life. Prediction of motor outcomes after stroke have tremendous clinical utility and a next step is to explore what factors might predict someone's subsequent UL performance category.
Purpose: To explore how different machine learning techniques can be used to understand how clinical measures and participant demographics captured early after stroke are associated with the subsequent UL performance categories.
Methods: This study analyzed data from two time points from a previous cohort (n = 54). Data used was participant characteristics and clinical measures from early after stroke and a previously established category of UL performance at a later post stroke time point. Different machine learning techniques (a single decision tree, bagged trees, and random forests) were used to build predictive models with different input variables. Model performance was quantified with the explanatory power (in-sample accuracy), predictive power (out-of-bag estimate of error), and variable importance.
Results: A total of seven models were built, including one single decision tree, three bagged trees, and three random forests. Measures of UL impairment and capacity were the most important predictors of the subsequent UL performance category, regardless of the machine learning algorithm used. Other non-motor clinical measures emerged as key predictors, while participant demographics predictors (with the exception of age) were generally less important across the models. Models built with the bagging algorithms outperformed the single decision tree for in-sample accuracy (26-30% better classification) but had only modest cross-validation accuracy (48-55% out of bag classification).
Conclusions: UL clinical measures were the most important predictors of the subsequent UL performance category in this exploratory analysis regardless of the machine learning algorithm used. Interestingly, cognitive and affective measures emerged as important predictors when the number of input variables was expanded. These results reinforce that UL performance, in vivo, is not a simple product of body functions nor the capacity for movement, instead being a complex phenomenon dependent on many physiological and psychological factors. Utilizing machine learning, this exploratory analysis is a productive step toward the prediction of UL performance. Trial registration NA.
Keywords: Accelerometry; Outcome assessments; Rehabilitation; Stroke; Supervised machine learning; Upper extremity.
© 2023. The Author(s).
Conflict of interest statement
The authors declare that they have no competing interests.
Figures


Similar articles
-
Sensor-based categorization of upper limb performance in daily life of persons with and without neurological upper limb deficits.Front Rehabil Sci. 2021;2:741393. doi: 10.3389/fresc.2021.741393. Epub 2021 Oct 20. Front Rehabil Sci. 2021. PMID: 35382114 Free PMC article.
-
Quantifying Real-World Upper-Limb Activity in Nondisabled Adults and Adults With Chronic Stroke.Neurorehabil Neural Repair. 2015 Nov-Dec;29(10):969-78. doi: 10.1177/1545968315583720. Epub 2015 Apr 20. Neurorehabil Neural Repair. 2015. PMID: 25896988 Free PMC article.
-
Machine Learning Methods Predict Individual Upper-Limb Motor Impairment Following Therapy in Chronic Stroke.Neurorehabil Neural Repair. 2020 May;34(5):428-439. doi: 10.1177/1545968320909796. Epub 2020 Mar 20. Neurorehabil Neural Repair. 2020. PMID: 32193984 Free PMC article.
-
Suitability of accelerometry as an objective measure for upper extremity use in stroke patients.BMC Neurol. 2022 Jun 15;22(1):220. doi: 10.1186/s12883-022-02743-w. BMC Neurol. 2022. PMID: 35705906 Free PMC article.
-
Effects of Robot-Assisted Therapy for the Upper Limb After Stroke.Neurorehabil Neural Repair. 2017 Feb;31(2):107-121. doi: 10.1177/1545968316666957. Epub 2016 Sep 24. Neurorehabil Neural Repair. 2017. PMID: 27597165 Review.
Cited by
-
Predicting upper limb motor recovery in subacute stroke patients via fNIRS-measured cerebral functional responses induced by robotic training.J Neuroeng Rehabil. 2024 Dec 23;21(1):226. doi: 10.1186/s12984-024-01523-6. J Neuroeng Rehabil. 2024. PMID: 39710694 Free PMC article.
-
The association between dexterity and upper limb impairment during stroke recovery.Front Neurol. 2024 Aug 19;15:1429929. doi: 10.3389/fneur.2024.1429929. eCollection 2024. Front Neurol. 2024. PMID: 39224885 Free PMC article.
-
Moving toward elucidating alternative motor pathway structures post-stroke: the value of spinal cord neuroimaging.Front Neurol. 2024 Feb 14;15:1282685. doi: 10.3389/fneur.2024.1282685. eCollection 2024. Front Neurol. 2024. PMID: 38419695 Free PMC article. Review.
References
-
- WHO. International Classification of Functioning, Disability and Health (ICF). World Health Organization. 2018(06/01/2021).
Publication types
MeSH terms
Grants and funding
LinkOut - more resources
Full Text Sources
Medical
