. 2023 Mar 13;10(3):ENEURO.0333-22.2023.
doi: 10.1523/ENEURO.0333-22.2023. Print 2023 Mar.

Interaction between Theta Phase and Spike Timing-Dependent Plasticity Simulates Theta-Induced Memory Effects

Affiliations

Interaction between Theta Phase and Spike Timing-Dependent Plasticity Simulates Theta-Induced Memory Effects

Danying Wang et al. eNeuro. .

Abstract

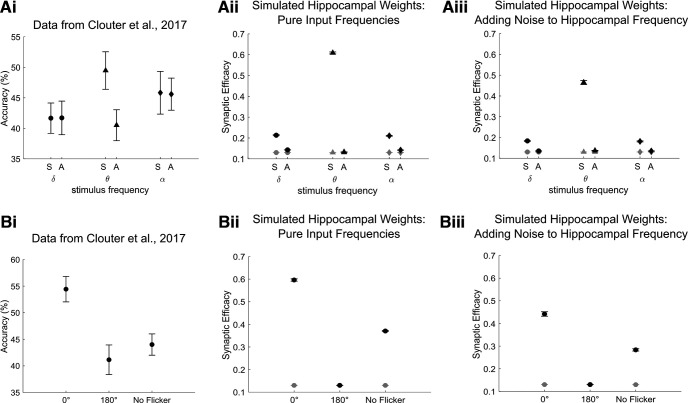
Rodent studies suggest that spike timing relative to hippocampal theta activity determines whether potentiation or depression of synapses arise. Such changes also depend on spike timing between presynaptic and postsynaptic neurons, known as spike timing-dependent plasticity (STDP). STDP, together with theta phase-dependent learning, has inspired several computational models of learning and memory. However, evidence to elucidate how these mechanisms directly link to human episodic memory is lacking. In a computational model, we modulate long-term potentiation (LTP) and long-term depression (LTD) of STDP, by opposing phases of a simulated theta rhythm. We fit parameters to a hippocampal cell culture study in which LTP and LTD were observed to occur in opposing phases of a theta rhythm. Further, we modulated two inputs by cosine waves with 0° and asynchronous phase offsets and replicate key findings in human episodic memory. Learning advantage was found for the in-phase condition, compared with the out-of-phase conditions, and was specific to theta-modulated inputs. Importantly, simulations with and without each mechanism suggest that both STDP and theta phase-dependent plasticity are necessary to replicate the findings. Together, the results indicate a role for circuit-level mechanisms, which bridge the gap between slice preparation studies and human memory.

Keywords: STDP; episodic memory; theta oscillations.


Conflict of interest statement

The authors declare no competing financial interests.

Figures

Figure 1.
Figure 1.
Model architecture and experimental paradigm. A, Two subgroups of neurons are created to represent the visual and auditory stimuli, respectively, in both NC and the hippocampus. STDP is enabled and modulated by ongoing theta oscillations, which modulates LTP (green) and LTD (purple) at opposing phases. B, To simulate the human episodic memory experiments using a multisensory entrainment paradigm (Clouter et al., 2017; Wang et al., 2018), two 4 Hz cosine waves as visual (blue) and auditory (orange) stimulus inputs were fed into two independent neural populations. The phase offsets of the auditory stimulus are either in phase (0°) or out of phase (90°, 180°, and 270°) from the visual stimulus input. Hippocampal theta phase was reset with a 180° offset from modulated visual stimulus after stimulus onset.
Figure 2.
Figure 2.
Evaluation of theta-modulated STDP. Ai, Bi, Independent simulations depicting synaptic plasticity after a single burst of 4 spikes at 100 Hz (amplitude = 3 pA), both in the trough (Ai) or the peak (Bi) of ongoing theta oscillations. Aii, Bii, Potential plasticity induced by spike pairings is calculated via functions (shaded regions; Eqs. 4.1, 4.2) for LTP (blue) and LTD (red). At the time of the spike event, synapses undergo potentiation or depression (black lines; Eqs. 5.1, 5.2) if potential plasticity is above or below a potentiation or depression threshold (blue and red dotted lines, respectively). Aiii, Biii, Overall synaptic change is calculated as a percentage of a baseline period through time. C, Dependence on bursting for inducing plasticity, where the number of spikes in a burst was increased from 1 to 4 either in the peak or trough of ongoing theta (simulating 25 trials/condition). Overall synaptic change was calculated as the percentage difference to a baseline period, taking an average across all involved synapses. D, Earlier experimental observations that indicated the importance of bursting for inducing plasticity (Huerta and Lisman, 1995). The notation of “trough” and “peak” is dependent on the location of the recording site that describes theta phase. We prefer to flip this notation in relation to prior studies, to make clear the functional role theta might play in neuronal selectivity. See also Extended Data Figure 2-1 for a more in-depth replication of the observations from the study by Huerta and Lisman (1995), in which an additional rule is implemented to model the occurrence of observed heterosynaptic plasticity on nonstimulated pathways (Extended Data Eqs. 5-1, 5-2).
Figure 3.
Figure 3.
Recall performance of the model as a function of the phase offset condition when stimulus inputs are modulated at theta frequency (4 Hz). Ai, Hippocampal weight change from the auditory to the visual subgroup during learning. Weights from the auditory to the visual subgroup increase significantly in the 0° phase offset condition after stimulus onset. The weights after learning are averaged between 2.75 and 3 s after stimulus onset (gray shaded area) to evaluate the recall performance of the model. Aii, Same as in Ai, but the weight change is from the visual to the auditory subgroup. Bi, Firing rate of hippocampal visual neurons responding to the auditory stimulus during learning. Bii, Same as in Bi, but the firing activity is from hippocampal auditory neurons responding to the visual stimulus during learning. The phase offset conditions in both Ai and Bi represent phases of auditory (A) to visual (V), while the phase offset conditions in both Aii and Bii represent phases of V–A. Shaded error bands represent the Standard error of the mean (SE). C, Mean of weights from the auditory to the visual subgroup after learning from 384 simulations and empirical data from Clouter et al. (2017) and Wang et al. (2018). Accuracy is normalized by subtracting the mean over all 4 phase offset conditions to make the between-studies data more comparable (i.e., to correct for differences in absolute memory performance between studies). Ci, Simulations of pure input frequency (4 Hz), hippocampal frequency (4 Hz), and EC phase offset (180°) from hippocampal theta. Cii, Simulations of input frequencies randomly drawn from normal distribution with a mean of 4 and an SD of 0.015 * 4, a pure hippocampal frequency of 4 Hz, and EC phase offset of 180° from hippocampal theta. Ciii, Simulations of a pure input frequency of 4 Hz, hippocampal frequencies randomly drawn from normal distribution with a mean of 4 and an SD of 0.02, and EC phase offsets randomly drawn from normal distribution with a mean of 180° and an SD of 0.167. Error bars represent the SE. See Extended Data Figure 3-1 for the results that the hippocampal weight change is converted to the memory decision index.
Figure 4.
Figure 4.
Hippocampal weight change between groups and firing activity for single hippocampal neurons in each phase offset condition at theta frequency (4 Hz). A, Hippocampal weight change between a random selected neuron of the auditory subgroup and a neuron in the visual subgroup during learning. The neurons are bidirectionally connected. The solid black line represents the weight change from the auditory neuron to the visual neuron. The dashed black line represents the weight change from the visual neuron to the auditory neuron. B, In each phase offset condition, the first two line plots show the stimulus inputs and the ongoing hippocampal theta oscillation during learning. Raster plots represent the firing activity of the same neurons shown in A, in each phase offset condition, respectively. See also Extended Data Figure 4-1 for the hippocampal weight change between groups and firing activity for single units in the delta and alpha frequency-modulated conditions.
Figure 5.
Figure 5.
Recall performance as a function of the degree of phase synchronization in the theta-modulated condition and other control conditions. Ai, Data from Clouter et al. (2017) showing recall accuracy when the movies and sounds were flickering in synchrony (S) or out of synchrony (A) at delta, theta, and alpha frequencies. Aii, Aiii, Mean of weights from the auditory to the visual subgroup after learning from 384 simulations. Aii, Simulations of pure input frequencies (delta, 1.7 Hz; theta, 4 Hz; alpha, 10.5 Hz); hippocampal frequency, 4 Hz; and EC phase offset, 180° from hippocampal theta. Aiii, Simulations of pure input frequency, 4 Hz, hippocampal frequencies randomly drawn from normal distribution with a mean of 4 and an SD of 0.02, and EC phase offsets randomly drawn from normal distribution with a mean of 180° and an SD of 0.167. Stimulus input strength increases as an exponential function of stimulus modulation frequency for lower frequencies (see Materials and Methods), delta (1.65 Hz stimulus strength, 1.75), theta (4 Hz stimulus strength, 1.76), and alpha (10.47 Hz stimulus strength, 2.02). Bi, Data from the study by Clouter et al. (2017) showing recall accuracy when the movies and sounds were presented at 0° and 180° phase offsets or were unmodulated. Bii, Biii, Mean of weights from the auditory to the visual subgroup after learning from 384 simulations. Bii, Simulations of pure input frequencies, hippocampal frequency of 4 Hz, and EC phase offset of 180° from hippocampal theta. Bii, Simulations of pure input frequency of 4 Hz, hippocampal frequencies randomly drawn from normal distribution with a mean of 4 and an SD of 0.02, and EC phase offsets randomly drawn from normal distribution with a mean of 180° and an SD of 0.167. All error bars represent the SE. Black dots represent hippocampal weights after learning. Gray dots represent hippocampal weights averaged between −1.75 and 0 s during prestimulus baseline. See Extended Data Figure 5-1 for simulations of pure input and hippocampal frequencies, but noise was introduced to the phase offsets between two input stimuli.
Figure 6.
Figure 6.
Mean hippocampal weight change between groups as a function of phase offset condition at A, delta frequency; B, theta frequency; C, alpha frequency; D, beta frequency; E, low gamma frequency; and F, high gamma frequency. After learning, weights were averaged across 48 simulations and between 2.75 and 3 s after stimulus onset. Stimulus input strength increases as an exponential function of stimulus modulation frequency for lower frequencies (see Materials and Methods) delta (1.65 Hz stimulus strength, 1.75), theta (4 Hz stimulus strength, 1.76), and alpha (10.47 Hz stimulus strength, 2.02). Stimulus input strength increases as a logarithmic function of stimulus modulation frequency for higher frequencies (see Materials and Methods) beta (18.34 Hz stimulus strength, 2.78), low gamma (41.24 Hz stimulus strength, 3.55), and high gamma (71.77 Hz stimulus strength, 4.08). Error bars represent the SE.
Figure 7.
Figure 7.
Model comparisons in recall performance between the full model and two alternative versions. A, Mean of weights from the auditory to the visual subgroup after learning simulated by two versions of the model was fit to the data from the study by Clouter et al. (2017). Ai, The full model was compared with a theta-phase learning-only version of the model. Aii, Same as Ai, but the comparison was between the full model and an STDP-only version of the model. B, Same as A, but the mean of weights from the auditory to the visual subgroup after learning simulated by two versions of model was fit to the data from the study by Wang et al. (2018). All simulations were done with pure input frequency of 4 Hz, hippocampal frequency of 4 Hz, and EC phase offset of 180° from hippocampal theta. All error bars represent the SE. See Extended Data Figure 7-1 for the model comparisons between the full model and the STDP-only model when the range of input strength was between 0 and 1.

Similar articles

Cited by

References

    1. Adaikkan C, Middleton SJ, Marco A, Pao P-C, Mathys H, Kim DN-W, Gao F, Young JZ, Suk H-J, Boyden ES, McHugh TJ, Tsai L-H (2019) Gamma entrainment binds higher-order brain regions and offers neuroprotection. Neuron 102:929–943.e8. 10.1016/j.neuron.2019.04.011 - DOI - PMC - PubMed
    1. Backus AR, Schoffelen J-M, Szebényi S, Hanslmayr S, Doeller CF (2016) Hippocampal-prefrontal theta oscillations support memory integration. Curr Biol 26:450–457. 10.1016/j.cub.2015.12.048 - DOI - PubMed
    1. Bi G, Poo M (1998) Synaptic modifications in cultured hippocampal neurons: dependence on spike timing, synaptic strength, and postsynaptic cell type. J Neurosci 18:10464–10472. 10.1523/JNEUROSCI.18-24-10464.1998 - DOI - PMC - PubMed
    1. Bi G, Poo M (2001) Synaptic modification by correlated activity: Hebb’s postulate revisited. Annu Rev Neurosci 24:139–166. 10.1146/annurev.neuro.24.1.139 - DOI - PubMed
    1. Buzsáki G (2002) Theta oscillations in the hippocampus. Neuron 33:325–340. 10.1016/S0896-6273(02)00586-X - DOI - PubMed

Publication types

LinkOut - more resources