. 2023 Feb 21;6(5):e202201825.
doi: 10.26508/lsa.202201825. Print 2023 May.

Segregation of pathways leading to pexophagy

Affiliations

Segregation of pathways leading to pexophagy

Francesco G Barone et al. Life Sci Alliance. .

Abstract

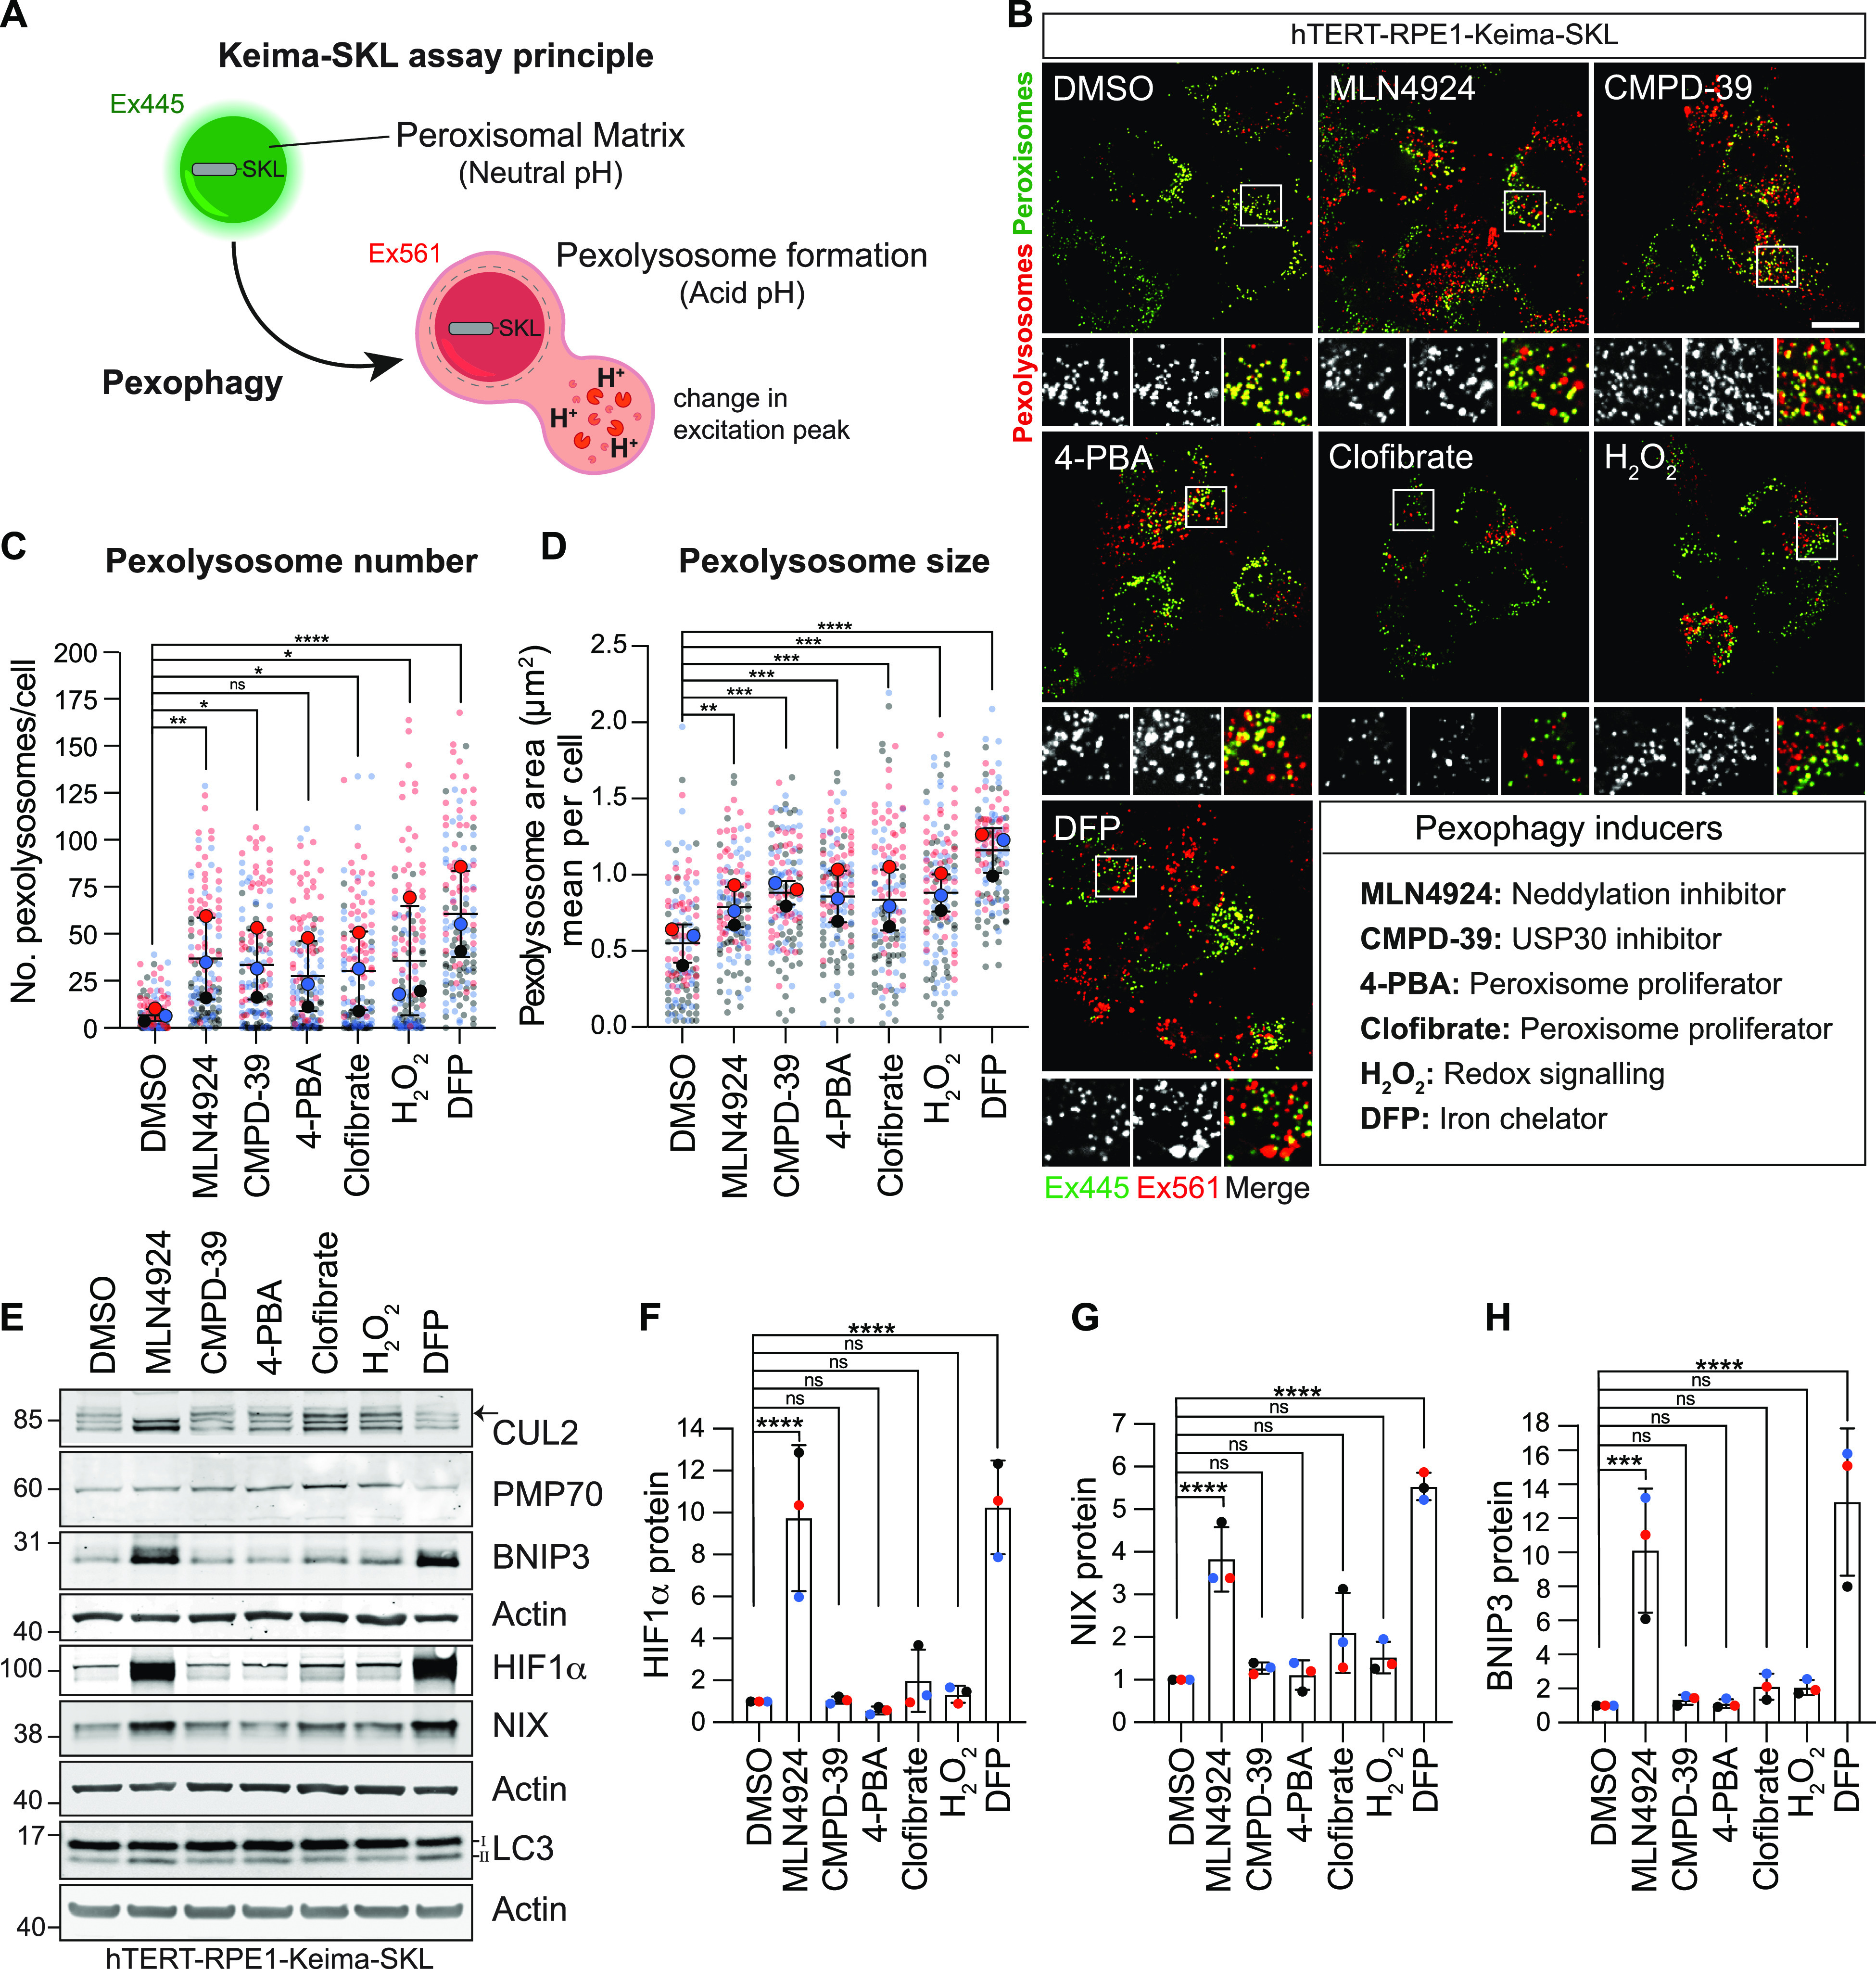
Peroxisomes are organelles with key roles in metabolism including long-chain fatty acid production. Their metabolic functions overlap and interconnect with those of mitochondria, with which they share an overlapping but distinct proteome. Both organelles are degraded by selective autophagy processes termed pexophagy and mitophagy. Although mitophagy has received intense attention, the pathways linked to pexophagy and associated tools are less well developed. We have identified the neddylation inhibitor MLN4924 as a potent activator of pexophagy and show that this is mediated by the HIF1α-dependent up-regulation of BNIP3L/NIX, a known adaptor for mitophagy. We show that this pathway is distinct from pexophagy induced by the USP30 deubiquitylase inhibitor CMPD-39, for which we identify the adaptor NBR1 as a central player. Our work suggests a level of complexity to the regulation of peroxisome turnover that includes the capacity to coordinate with mitophagy, via NIX, which acts as a rheostat for both processes.


Conflict of interest statement

The authors declare that they have no conflict of interest.

Figures

Figure 1.
Figure 1.. A chemical screen for pexophagy inducers.
(A) Schematic for the Keima-SKL pexophagy reporter system. The Keima fluorescent reporter is targeted to the peroxisomal matrix via the peroxisomal-targeting signal 1 (tripeptide SKL). Upon delivery to the acidic environment of lysosomes, the excitation spectrum of Keima is red shifted. Fluorescence emissions from these two excitation wavelengths (445 and 561 nm) are pseudocoloured green and red, respectively. (B) Representative images of hTERT-RPE1 cells stably expressing the Keima-SKL pexophagy reporter. CMPD-39 (1 μM) was administered for 96 h before imaging. For all other conditions, cells were treated for 24 h with MLN4924 (1 μM), 4-PBA (4-PBA, 1 mM), clofibrate (20 μM), hydrogen peroxide (H2O2, 100 μM), and deferiprone (DFP, 1 mM). Scale bar 20 μm. (C, D) Graphs illustrate the number and mean area of pexolysosomes per cell. Quantification of the data from three independent colour-coded experiments is shown. Mean and SD are indicated; >40 cells were quantified per condition in each replicate experiment. One-way ANOVA and Bonferroni’s multiple comparison test. *P < 0.05, **P < 0.01, ***P < 0.001, ****P < 0.0001. (E) Representative Western blot of hTERT-RPE1-Keima-SKL treated as in (B), probed for Cullin-2 (CUL2), PMP70, BNIP3, HIF1α, LC3, NIX, and actin. Arrow indicates the neddylated form of Cullin-2. (F, G, H) Quantitation of data shown in (E), indicating the mean and SD for three independent colour-coded experiments. Source data are available for this figure.
Figure S1.
Figure S1.. Neddylation inhibition induces pexophagy.
(A) Representative images of hTERT-RPE1-Keima-SKL cells. MLN4924 (1 μM) was administered for 24 and 48 h before imaging. Scale bar 20 μm. (B, C) Graphs show the number and mean area of pexolysosomes. Quantification of the data from three independent colour-coded experiments is shown. Mean and SD are indicated; >30 cells were quantified per condition in each experiment. One-way ANOVA with Bonferroni’s multiple comparisons test. *P < 0.05.
Figure 2.
Figure 2.. MLN4924-induced pexophagy requires NIX.
(A) Representative confocal images of hTERT-RPE1-Keima-SKL cells treated with DMSO and MLN4924 (1 μM) for 24 h before imaging. Cells were transfected with non-targeting siRNA (NT1) or siRNA targeting BNIP3, NIX, ATG7, ACBD5, and NBR1. Scale bar 20 μm. (B, C) Graphs show the number and mean area of pexolysosomes. Quantification of the data from three colour-coded independent experiments is shown. Mean and SD are indicated; >40 cells were quantified per condition in each experiment. One-way ANOVA with Bonferroni’s multiple comparisons test. *P < 0.05. **P < 0.01. ***P < 0.001. ****P < 0.0001. (D) Representative Western blot of hTERT-RPE1-Keima-SKL cells treated as in (A) and probed as indicated. (E) Representative confocal images of hTERT-RPE1-Keima-SKL cells stably expressing the Keima-SKL pexophagy reporter. Cells were treated with DMSO and MLN4924 (1 μM), for 24 h before imaging. Cells were transfected with non-targeting (NT1) siRNA or siRNA targeting BNIP3 and NIX. Scale bar 20 μm. (F, G) Graph shows the number and mean area of pexolysosomes per cell. Quantification of the data from three colour-coded independent experiments is shown. Mean and SD are indicated; >40 cells were quantified per condition in each repeat experiment. One-way ANOVA with Bonferroni’s multiple comparisons test. **P < 0.01. ***P < 0.001. ****P < 0.0001. (H) Representative Western blot of protein samples from cells treated as in (E) and probed as indicated. Source data are available for this figure.
Figure S2.
Figure S2.. Endogenous NIX localises to mitochondria.
Representative confocal images of hTERT-RPE1 cells treated with vehicle (DMSO) or MLN4924 for 24 h, fixed and stained with anti-NIX (green) and Mitotracker Deep Red (Red, a far-red fluorescent mitochondria dye which is well retained after fixation), were administered 30 min before fixation, representative of two independent experiments. Scale bar 20 μm.
Figure 3.
Figure 3.. Exogenously expressed NIX colocalises with peroxisomes independently of mitochondria.
(A) hTERT-RPE1-YFP-Parkin cells were first treated for 24 h with antimycin A and oligomycin A (A/O, 1 μM each) or DMSO, then transiently transfected with DsRed-NIX or DsRed alone for 16 h before fixation or harvesting. (B) Representative images of cells, treated as described in (A), immunostained for endogenous PMP70 (AlexaFluor-405, green). A set of mock transfected cells treated in parallel were co-stained for TOMM20 (AlexaFluor-594, red). Scale bars 10 μm. (C) Colocalisation of the DsRed-NIX signal with peroxisomes (PMP70) in hTERT-RPE1-YFP-Parkin cells treated with A/O. The Mander’s overlap coefficient (MOC, M1) was calculated for >25 cells per experiment. The mean and SD of three independent experiments are shown. (D) Representative Western blot showing subcellular fractions of hTERT-RPE1-YFP-Parkin cells treated as shown in (A). Postnuclear supernatant and light membranes are shown, representative of two independent experiments. Black and red arrows highlight relative amounts of endogenous NIX in the light membrane fraction, recovered from the postnuclear supernatant ± mitochondrial depletion (A/O treatment). Source data are available for this figure.
Figure 4.
Figure 4.. NBR1 mediates CMPD-39–induced pexophagy.
(A) Representative confocal images of hTERT-RPE1-Keima-SKL cells treated with DMSO and CMPD-39 (1 μM), for 96 h before imaging. Cells were transfected with non-targeting (NT1) or siRNA or siRNA targeting BNIP3, NIX, ATG7, ACBD5, and NBR1. Scale bar 20 μm. (B, C) Quantification of data shown in (A). Graphs show the number and mean area of pexolysosomes per cell from three independent colour-coded experiments. Mean and SD are indicated; >50 cells were quantified per condition in each experiment. One-way ANOVA with Bonferroni’s multiple comparisons test. ***P < 0.001. ****P < 0.0001. (D) Representative Western blot of protein samples from cells treated as in (A) and probed as indicated. Low and high represent two different exposures of the same blot. (E) HIF1α-dependent and -independent pexophagy pathways. (i) HIF1α-dependent pexophagy pathway. Upon administration of the neddylation inhibitor MLN4924, the transcription factor HIF1α is induced (top). This leads to the up-regulation of NIX, which directly associates with peroxisomes and acts as a pexophagy adaptor. (ii) HIF1α-independent pexophagy pathway: the DUB USP30 suppresses pexophagy by removing ubiquitin attached to peroxisomal substrates. Accumulation of ubiquitin on peroxisomes, after USP30 inhibition, leads to the recruitment of the NBR1 pexophagy adaptor. Source data are available for this figure.

References

    1. Johansen T, Lamark T (2020) Selective autophagy: ATG8 family proteins, LIR motifs and cargo receptors. J Mol Biol 432: 80–103. 10.1016/j.jmb.2019.07.016 - DOI - PubMed
    1. Lamark T, Johansen T (2021) Mechanisms of selective autophagy. Annu Rev Cell Dev Biol 37: 143–169. 10.1146/annurev-cellbio-120219-035530 - DOI - PubMed
    1. Gubas A, Dikic I (2022) A guide to the regulation of selective autophagy receptors. FEBS J 289: 75–89. 10.1111/febs.15824 - DOI - PubMed
    1. Lazarou M, Sliter DA, Kane LA, Sarraf SA, Wang C, Burman JL, Sideris DP, Fogel AI, Youle RJ (2015) The ubiquitin kinase PINK1 recruits autophagy receptors to induce mitophagy. Nature 524: 309–314. 10.1038/nature14893 - DOI - PMC - PubMed
    1. Deosaran E, Larsen KB, Hua R, Sargent G, Wang Y, Kim S, Lamark T, Jauregui M, Law K, Lippincott-Schwartz J, et al. (2013) NBR1 acts as an autophagy receptor for peroxisomes. J Cell Sci 126: 939–952. 10.1242/jcs.114819 - DOI - PubMed

Publication types

LinkOut - more resources