. 2023 Mar 1;37(5-6):243-257.
doi: 10.1101/gad.350233.122. Epub 2023 Feb 21.

ALL-tRNAseq enables robust tRNA profiling in tissue samples

Affiliations

ALL-tRNAseq enables robust tRNA profiling in tissue samples

Chantal Scheepbouwer et al. Genes Dev. .

Abstract

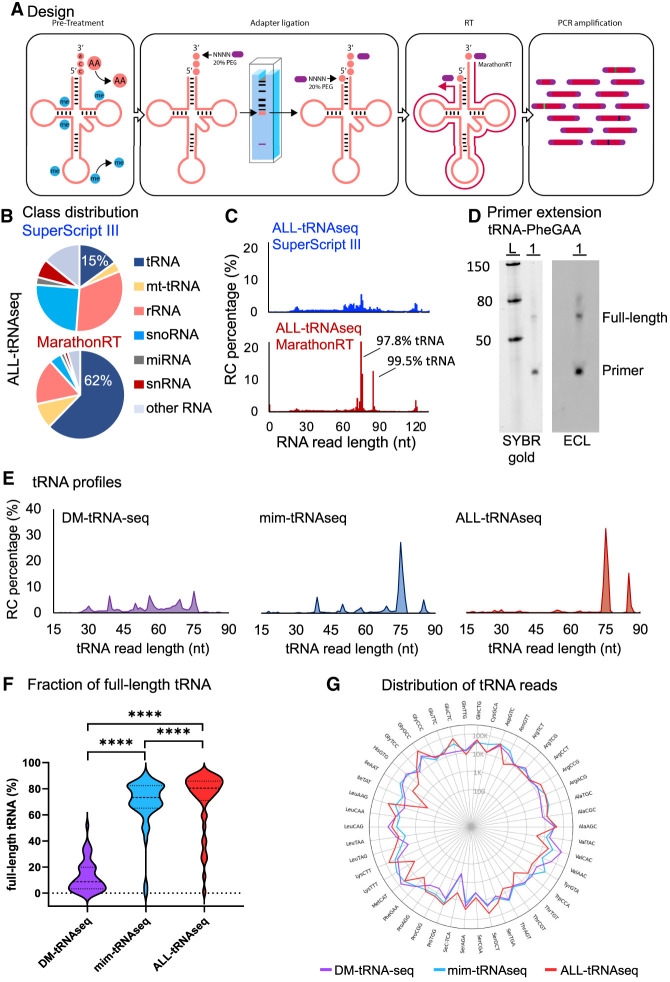
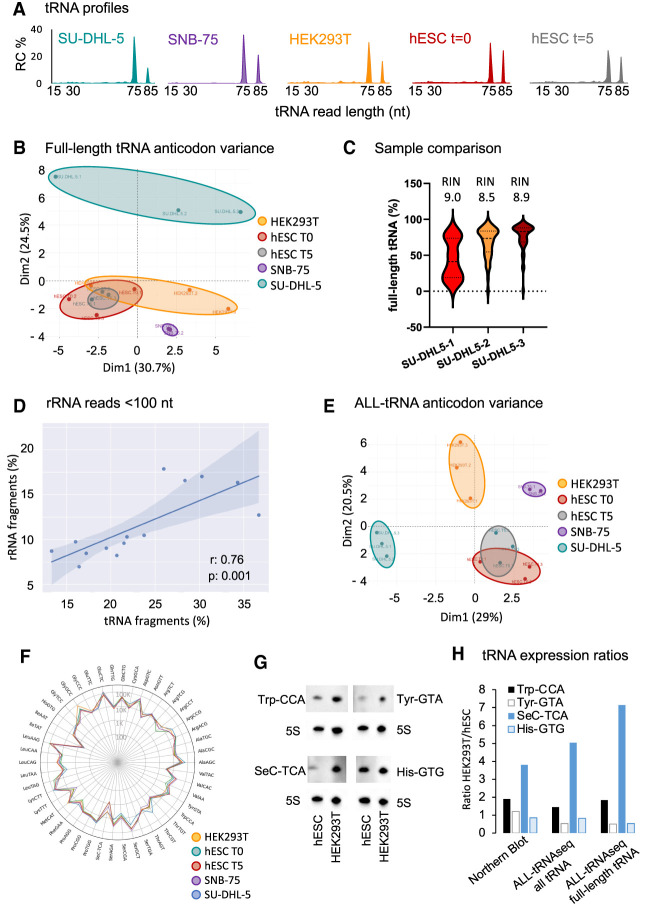
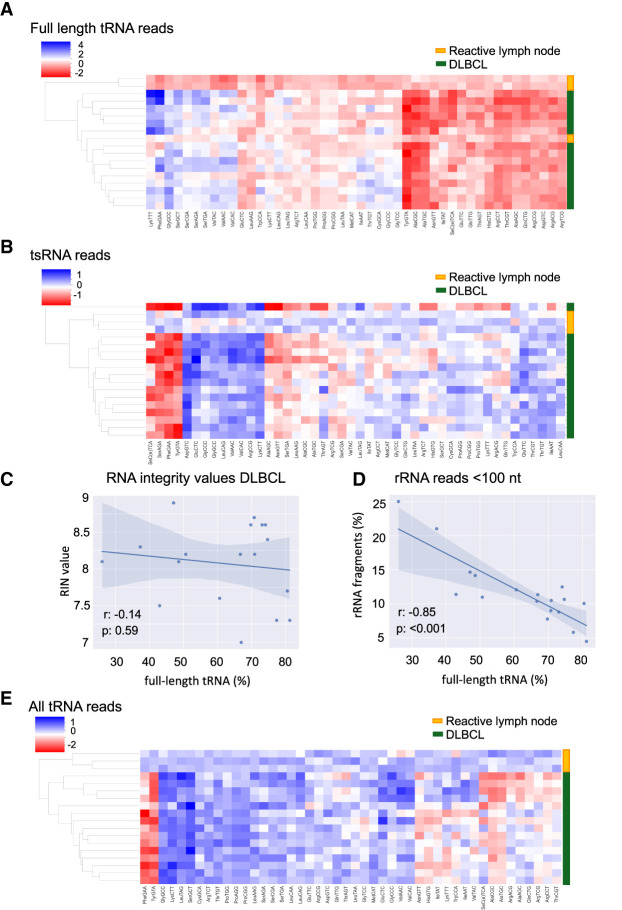
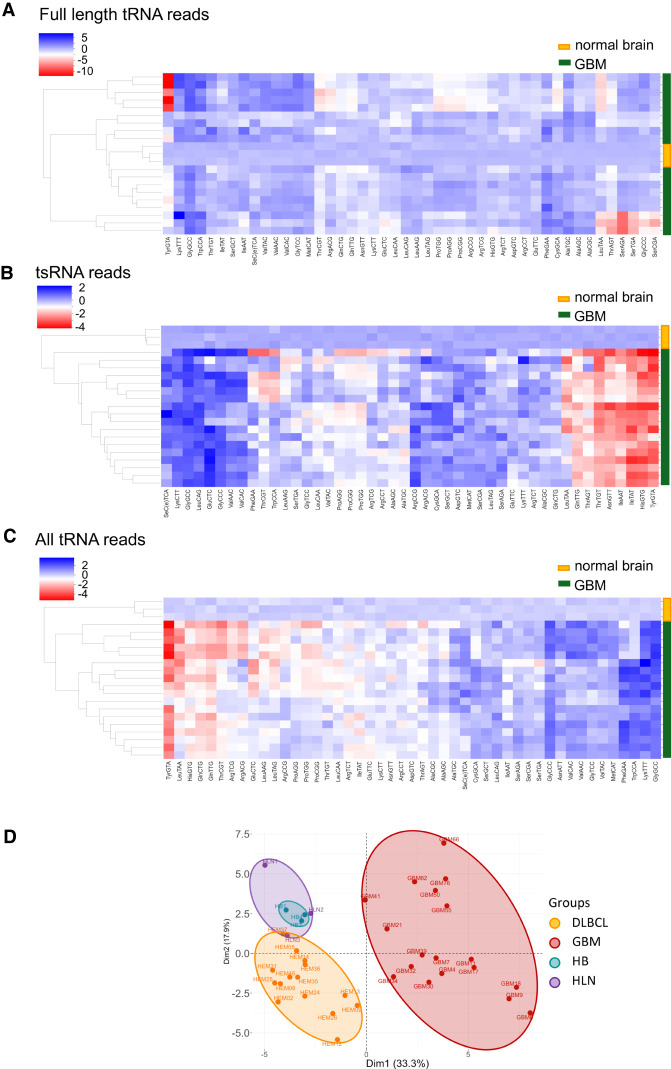
Transfer RNAs (tRNAs) are small adaptor RNAs essential for mRNA translation. Alterations in the cellular tRNA population can directly affect mRNA decoding rates and translational efficiency during cancer development and progression. To evaluate changes in the composition of the tRNA pool, multiple sequencing approaches have been developed to overcome reverse transcription blocks caused by the stable structures of these molecules and their numerous base modifications. However, it remains unclear whether current sequencing protocols faithfully capture tRNAs existing in cells or tissues. This is specifically challenging for clinical tissue samples that often present variable RNA qualities. For this reason, we developed ALL-tRNAseq, which combines the highly processive MarathonRT and RNA demethylation for the robust assessment of tRNA expression, together with a randomized adapter ligation strategy prior to reverse transcription to assess tRNA fragmentation levels in both cell lines and tissues. Incorporation of tRNA fragments not only informed on sample integrity but also significantly improved tRNA profiling of tissue samples. Our data showed that our profiling strategy effectively improves classification of oncogenic signatures in glioblastoma and diffuse large B-cell lymphoma tissues, particularly for samples presenting higher levels of RNA fragmentation, further highlighting the utility of ALL-tRNAseq for translational research.

Keywords: cancer; high-throughput sequencing; tissue samples; transfer RNA.


Figures

Figure 1.
Figure 1.
The ultraprocessive group II intron maturase MarathonRT combined with RNA demethylation overcomes tRNA length bias. (A) Workflow of ALL-tRNAseq depicting steps for obtaining the full tRNA repertoire (including type I and type II tRNAs), consisting of tRNA deacylation and demethylation, sequential adapter ligation (adapters indicated in purple) with a gel size selection step, reverse transcription with incorporation of the highly processive MarathonRT, and PCR amplification. (B) RNA class distribution in percentage of total normalized reads for the ALL-tRNAseq library preparation protocol using SuperScript III and MarathonRT in SNB-75 cells. (C) Full RNA read length analysis in percentage after adapter trimming in SuperScript III and MarathonRT prepared libraries from SNB-75 cell line RNA. The increased proportion of reads mapping to tRNA sequences at the most dominant peaks of 75 and 85 nt are indicated. (D) Primer extension analysis of yW37 in tRNA-PheGAA using 2 μg of demethylated total RNA from HEK293T cells. (Left panel) SYBR Gold staining of small RNA ladder (L; 50, 80, and 150 nt) and cDNA yield (1) separated on a 10% denaturing polyacrylamide gel. (Right panel) Chemiluminescent detection of biotin-labeled cDNA products of tRNA-PheGAA. (E) tRNA read length distribution comparison between DM-tRNA-seq, mim-tRNAseq, and ALL-tRNAseq, shown as percentage of all reads mapping to cytoplasmic tRNA from HEK293T cells. (F) Violin plot of the full-length tRNA read fraction with the 3′-terminal CCA triplet detected in DM-tRNA-seq (n = 2), mim-tRNAseq (n = 2), and ALL-tRNAseq (n = 2) in HEK293T cells. Statistics were performed using Wilcoxon rank sum test. (****) P < 0.001. (G) Radar plot of tRNA anticodon reads per million mapping to cytoplasmic tRNA showing the distribution of reads per tRNA anticodon for DM-tRNA-seq (purple line), mim-tRNAseq (blue line), and ALL-tRNAseq (red line). Data are represented as log10 values on the radius.
Figure 2.
Figure 2.
Inclusion of all tRNA reads detected by ALL-tRNAseq improves robustness of tRNA profiling. (A) tRNA read length distribution in percentage in cell lines SU-DHL-5, SNB-75, and HEK293T as well as proliferating and differentiated hESCs. (B) Principal component analysis (PCA) of full-length tRNA anticodon expression in HEK293T (n = 3), SNB-75 (n = 2), SU-DHL-5 (n = 3), hESC (n = 3), and differentiated hESCs (n = 3). (C) Violin plot of the full-length tRNA read fraction with the 3′-terminal CCA triplet in three replicates of the SU-DHL-5 cell line. (D) Pearson correlation of normalized tRNA fragments reads per million and normalized rRNA reads per million <100 nt. (E) PCA of tRNA anticodon expression including full-length and short tRNA-derived reads in HEK293T (n = 3), SNB-75 (n = 2), SU-DHL-5 (n = 3), proliferating hESCs (n = 3), and differentiated hESCs (n = 3). (F) Radar plot of all tRNA anticodon reads per million mapping to cytoplasmic tRNA, showing the distribution of reads per tRNA anticodon for SU-DHL-5 (blue line), HEK293T (orange line), proliferating hESCs (green line), differentiated hESCs (red line), and SNB-75 (purple line). Data are represented as log10 values on the radius. (G) Detection of tRNA-Trp-CCA, tRNA-Tyr-GTA, tRNA-His-GTG, and tRNA-SeC-TCA in 1 µg of total RNA isolated from proliferating hESCs (T = day 0) and HEK293T cell lines by Northern blot. 5S rRNA was used as a loading control. (H) Ratio in tRNA abundance between hESCs and HEK293T by quantification of Northern blot signal (left) compared with relative abundance detected by ALL-tRNAseq including all tRNA reads (middle) and full-length tRNA reads only (right). Band intensities were quantified by ImageJ, background-subtracted, and normalized to 5S rRNA signal.
Figure 3.
Figure 3.
tRNA expression profiling distinguishes normal from hematological cancer tissues. (A) Heat map visualization showing clustering of full-length tRNA reads in DLBCL samples. Each horizontal line represents a biological sample (15 DLBCL and three healthy, reactive lymph node samples). Each row represents a tRNA type, grouped by anticodon, displaying 46 tRNA anticodons in total. The color code depicts the log2 fold change of each tRNA isodecoder group in every sample relative to the average of the three healthy samples. (B) Unsupervised hierarchical clustering analysis of normalized tRNA reads <60 nt for 15 DLBCL samples and three reactive lymph nodes. Each row represents a tRNA type, grouped by anticodon, displaying 46 tRNA anticodons in total. (C) Pearson correlation (r: −0.14) between RIN values and normalized full-length tRNA reads in 15 DLBCL samples and three healthy, reactive lymph node samples of good RNA quality (RIN values between 7 and 9). (D) Pearson correlation (r: −0.85) between normalized rRNA reads <100 nt and normalized full-length tRNA reads in 15 DLBCL samples and three healthy, reactive lymph node samples. (E) Heat map visualization showing improved clustering of DLBCL (n = 15) and reactive lymph node samples (n = 3) after inclusion of all tRNA reads.
Figure 4.
Figure 4.
ALL-tRNAseq allows tRNA expression profiling in brain tumor tissues of highly variable RNA integrity. (A) Heat map visualization showing clustering of full-length tRNA reads in glioblastoma (GBM) samples. Each horizontal line represents a biological sample; 18 GBM samples, and three normal brain samples. (B) Hierarchical clustering of GBM (n = 18) and normal brain samples (n = 3). tRNA reads <60 nt are normalized per million. Each row represents a tRNA type, grouped by anticodon, displaying 46 tRNA anticodons in total. (C) Heat map visualization showing clustering changes of GBM and normal brain samples after inclusion of all tRNA reads. (D) PCA of tRNA anticodon expression using all normalized reads per million mapping to cytoplasmic tRNA in reactive lymph nodes (n = 3), normal brain tissue (n = 3), DLBCL (n = 15), and GBM (n = 18).

Similar articles

Cited by

References

    1. Aharon-Hefetz N, Frumkin I, Mayshar Y, Dahan O, Pilpel Y, Rak R. 2020. Manipulation of the human tRNA pool reveals distinct tRNA sets that act in cellular proliferation or cell cycle arrest. Elife 9: e58461. 10.7554/eLife.58461 - DOI - PMC - PubMed
    1. Aparicio-Puerta E, Lebrón R, Rueda A, Gómez-Martín C, Giannoukakos S, Jaspez D, Medina JM, Zubkovic A, Jurak I, Fromm B, et al. 2019. sRNAbench and sRNAtoolbox 2019: intuitive fast small RNA profiling and differential expression. Nucleic Acids Res 47: W530–W535. 10.1093/nar/gkz415 - DOI - PMC - PubMed
    1. Aparicio-Puerta E, Gómez-Martín C, Giannoukakos S, Medina JM, Scheepbouwer C, García-Moreno A, Carmona-Saez P, Fromm B, Pegtel M, Keller A, et al. 2022. sRNAbench and sRNAtoolbox 2022 update: accurate miRNA and sncRNA profiling for model and non-model organisms. Nucleic Acids Res 50: W710–W717. 10.1093/nar/gkac363 - DOI - PMC - PubMed
    1. Behrens A, Rodschinka G, Nedialkova DD. 2021. High-resolution quantitative profiling of tRNA abundance and modification status in eukaryotes by mim-tRNAseq. Mol Cell 81: 1802–1815.e7. 10.1016/j.molcel.2021.01.028 - DOI - PMC - PubMed
    1. Blanco S, Dietmann S, Flores JV, Hussain S, Kutter C, Humphreys P, Lukk M, Lombard P, Treps L, Popis M, et al. 2014. Aberrant methylation of tRNAs links cellular stress to neuro-developmental disorders. EMBO J 33: 2020–2039. 10.15252/embj.201489282 - DOI - PMC - PubMed

Publication types

MeSH terms