. 2023 Mar 15;43(11):1987-2001.
doi: 10.1523/JNEUROSCI.1190-22.2023. Epub 2023 Feb 21.

Involvement of GABAergic Interneuron Subtypes in 4-Aminopyridine-Induced Seizure-Like Events in Mouse Entorhinal Cortex in Vitro

Affiliations

Involvement of GABAergic Interneuron Subtypes in 4-Aminopyridine-Induced Seizure-Like Events in Mouse Entorhinal Cortex in Vitro

Paolo Scalmani et al. J Neurosci. .

Abstract

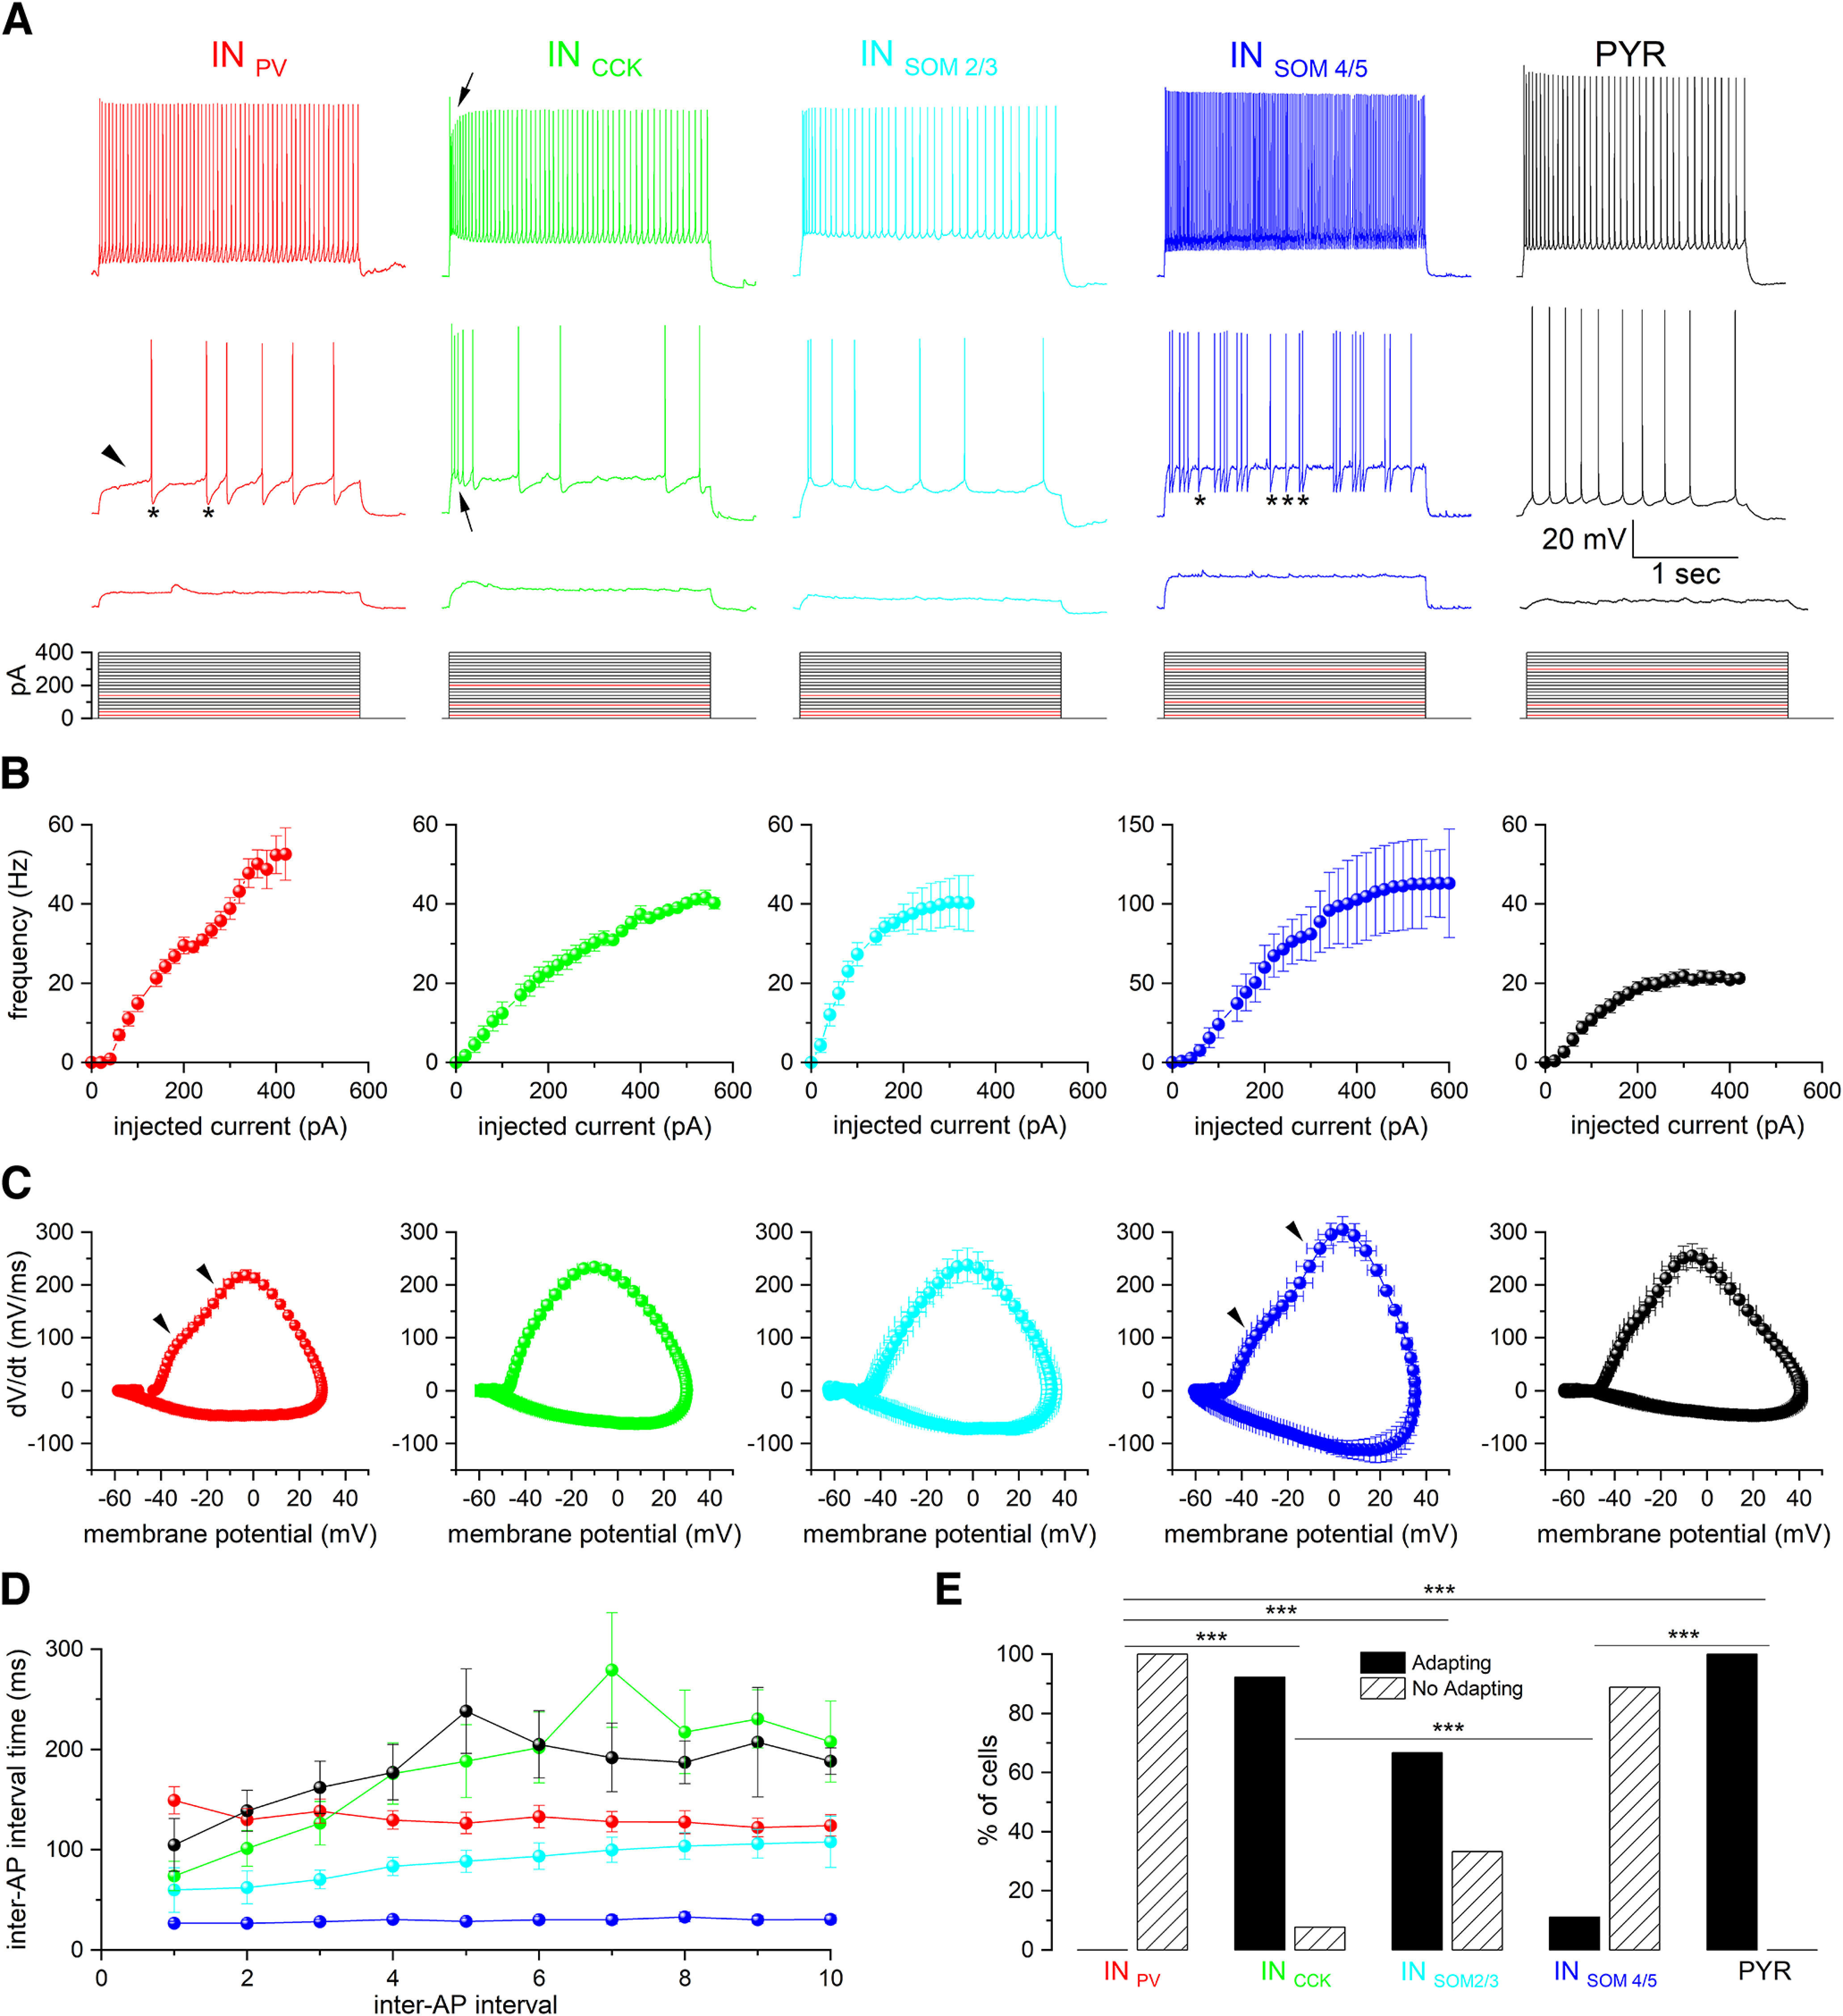
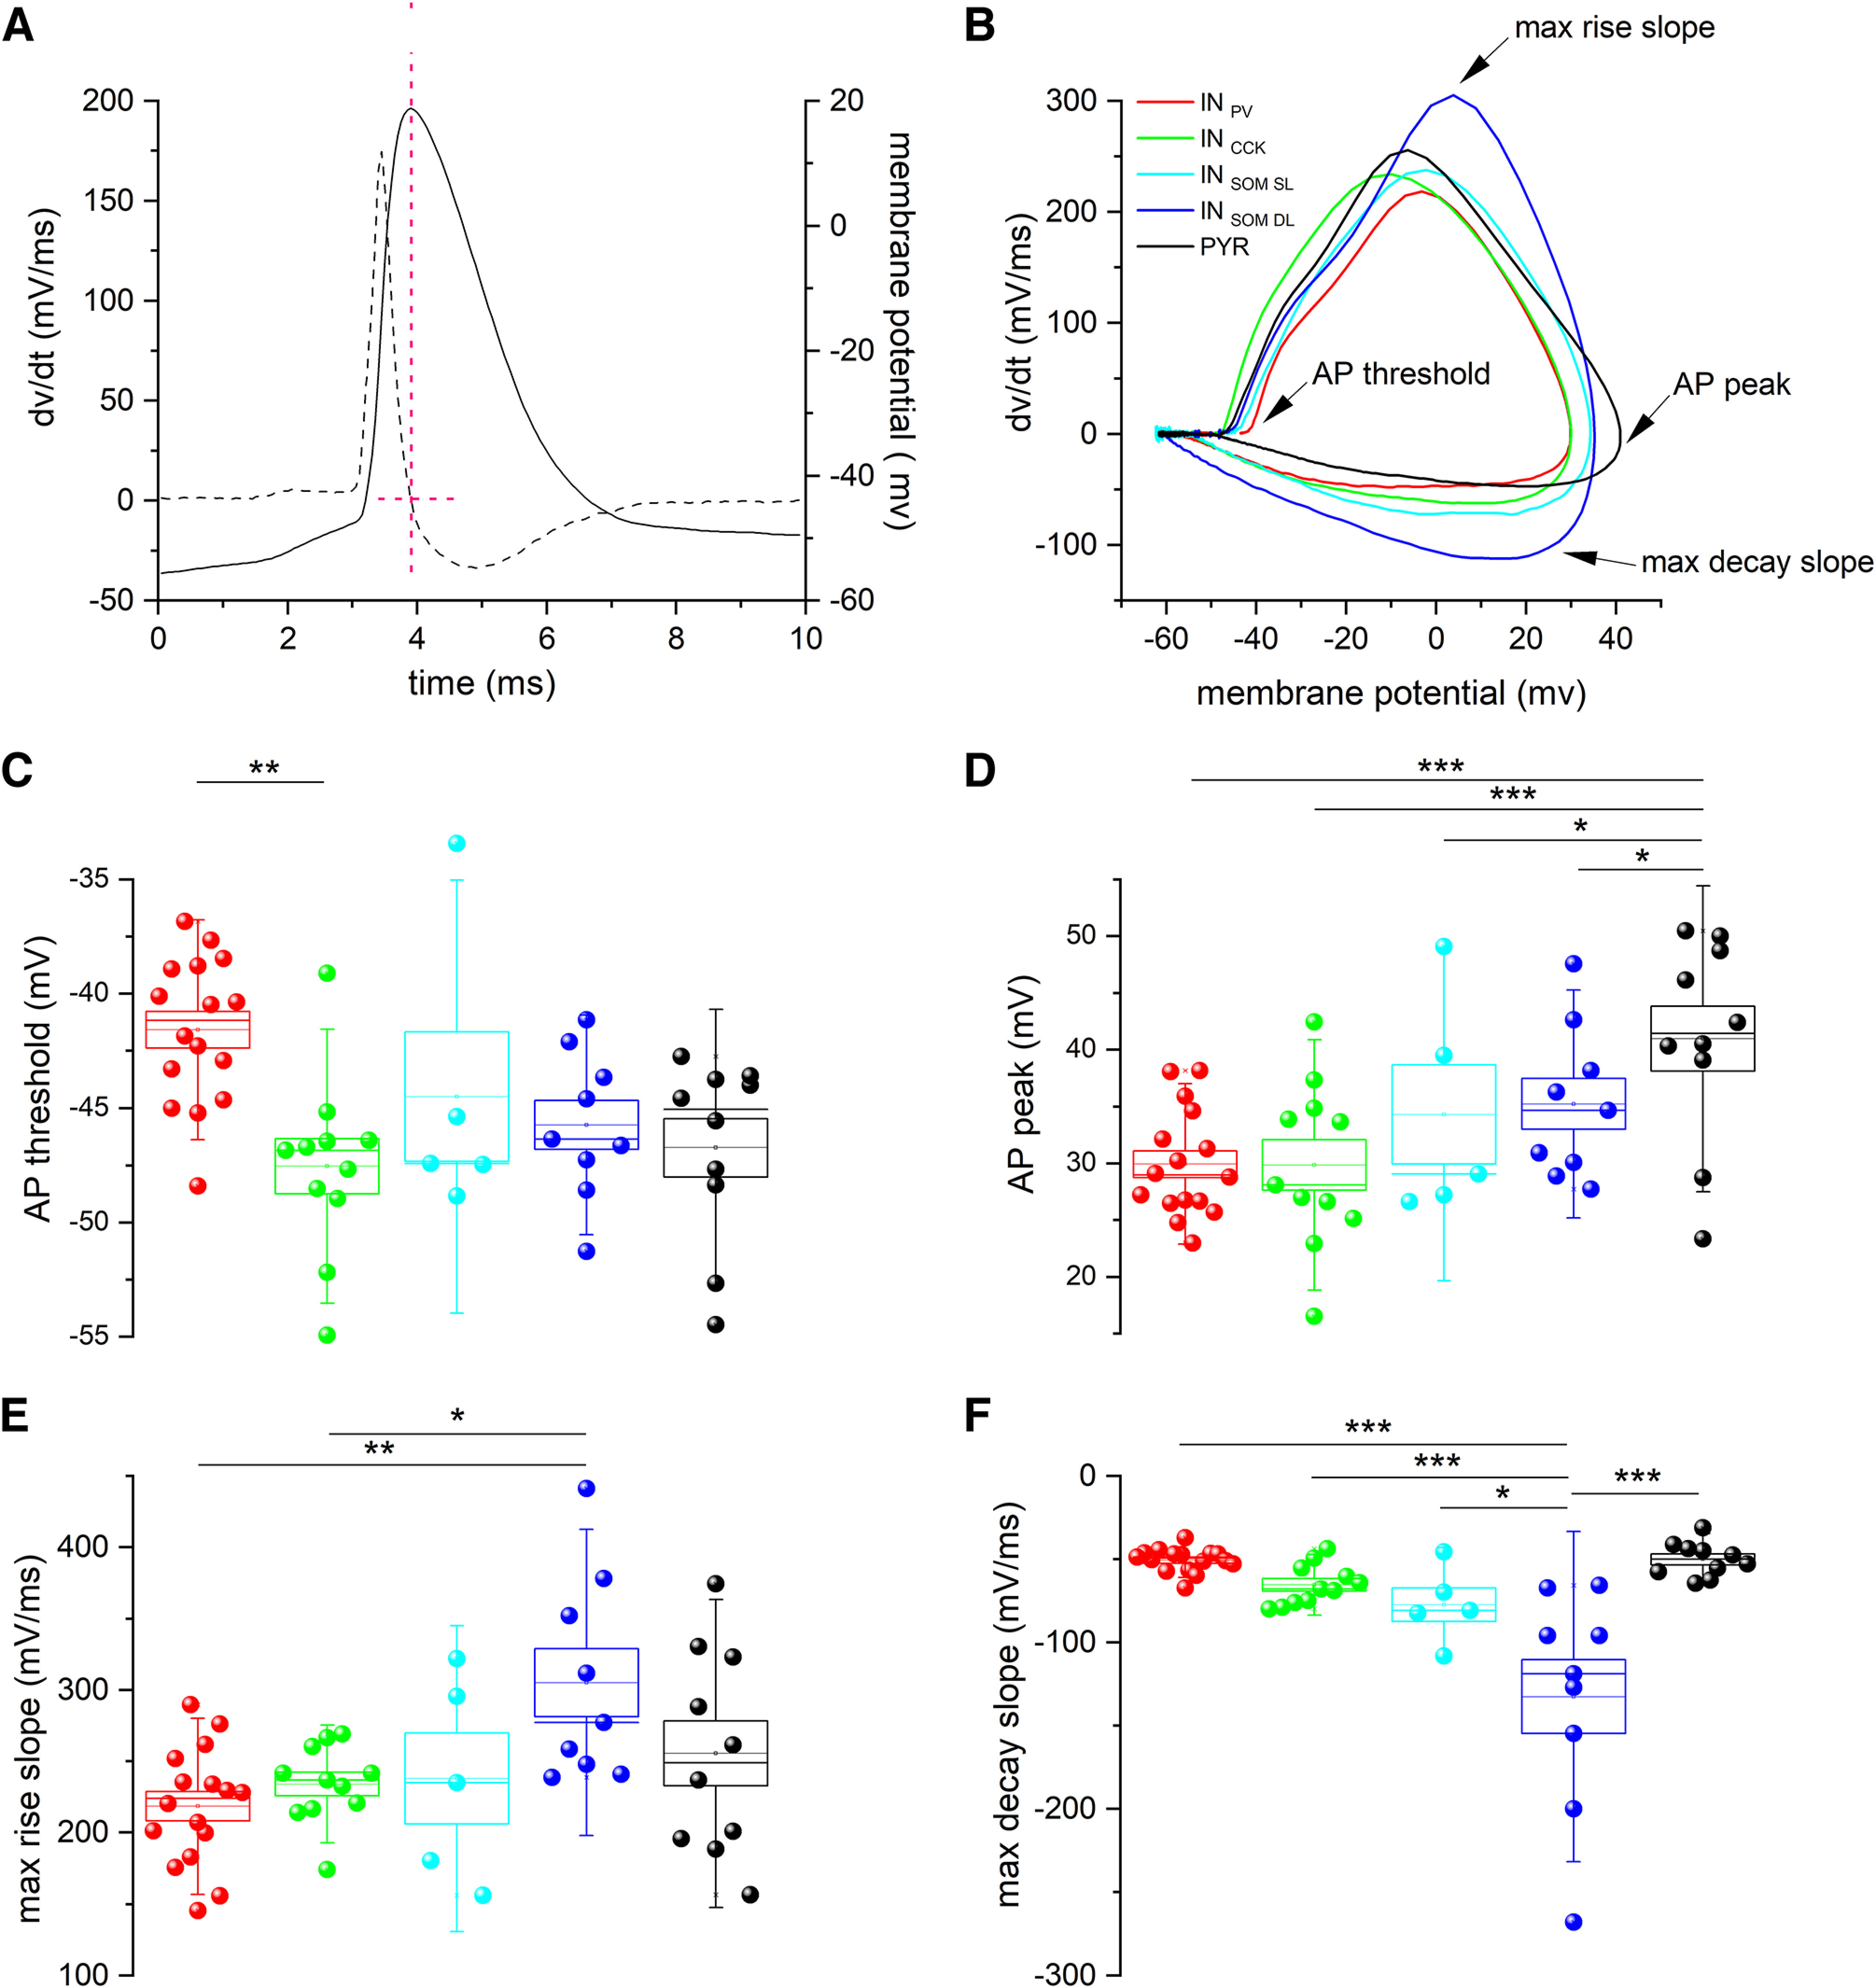
Single-unit recordings performed in temporal lobe epilepsy patients and in models of temporal lobe seizures have shown that interneurons are active at focal seizure onset. We performed simultaneous patch-clamp and field potential recordings in entorhinal cortex slices of GAD65 and GAD67 C57BL/6J male mice that express green fluorescent protein in GABAergic neurons to analyze the activity of specific interneuron (IN) subpopulations during acute seizure-like events (SLEs) induced by 4-aminopyridine (4-AP; 100 μm). IN subtypes were identified as parvalbuminergic (INPV, n = 17), cholecystokinergic (INCCK), n = 13], and somatostatinergic (INSOM, n = 15), according to neurophysiological features and single-cell digital PCR. INPV and INCCK discharged at the start of 4-AP-induced SLEs characterized by either low-voltage fast or hyper-synchronous onset pattern. In both SLE onset types, INSOM fired earliest before SLEs, followed by INPV and INCCK discharges. Pyramidal neurons became active with variable delays after SLE onset. Depolarizing block was observed in ∼50% of cells in each INs subgroup, and it was longer in IN (∼4 s) than in pyramidal neurons (<1 s). As SLE evolved, all IN subtypes generated action potential bursts synchronous with the field potential events leading to SLE termination. High-frequency firing throughout the SLE occurred in one-third of INPV and INSOM We conclude that entorhinal cortex INs are very active at the onset and during the progression of SLEs induced by 4-AP. These results support earlier in vivo and in vivo evidence and suggest that INs have a preferential role in focal seizure initiation and development.SIGNIFICANCE STATEMENT Focal seizures are believed to result from enhanced excitation. Nevertheless, we and others demonstrated that cortical GABAergic networks may initiate focal seizures. Here, we analyzed for the first time the role of different IN subtypes in seizures generated by 4-aminopyridine in the mouse entorhinal cortex slices. We found that in this in vitro focal seizure model, all IN types contribute to seizure initiation and that INs precede firing of principal cells. This evidence is in agreement with the active role of GABAergic networks in seizure generation.

Keywords: epilepsy; in vitro slices; interneurons; patch clamp; seizures.


Figures

Figure 1.
Figure 1.
Experimental setup. A, Microphotograph of a horizontal hippocampal/entorhinal mouse slice (10× magnification). Recording LFPe and PCe are illustrated. hip, Hippocampal formation. B, C, High-magnification images have been obtained with infrared DIC (B) and fluorescence microscopy (C). GFP-containing INs (red arrow) in an EC slice from GAD65 and GAD67 mouse and GFP-negative neurons (black arrows) with typical pyramidal soma. D, Percentage of IN subtypes recoded in EC slices obtained from GAD65 (INPV = 14.3%, INCCK = 83.3%, INSOM = 0%, PYRs = 0%, striped columns) and GAD67 mice (INPV = 85.7%, INCCK = 16.7%, INSOM = 100%, PYRs = 0%, black columns). E, Percentage of IN subtypes and PYRs recorded from superficial EC layers 2–3 (INPV = 70%, INCCK = 77%, INSOM = 40%, PYRs = 80%, black columns) and deep EC layers 4 and 5 (INPV = 30%, INCCK = 23%, INSOM = 60%, PYRs = 20%, striped columns). For statistical analysis, Fisher's exact test with Bonferroni's correction was used (* = p < 0.05, ** = p < 0.01, *** = p < 0.001).
Figure 2.
Figure 2.
Different types of interneurons identified by firing properties. INs recorded in EC slices with typical features of INPV (red traces/plots), INCCK (green), INSOM (blue), and typical PYR (black) neurons are illustrated; different firing properties were observed in INSOM recorded either in superficial (2/3) of deep (4/5) EC layers (light blue and dark blue, respectively). A, Representative traces of AP firing recorded from INs and PYRs in GAD-67/65 mouse EC slices, elicited by intracellular injection of a 2.5 s depolarizing pulse (bottom row); the three traces illustrate responses evoked by current pulses just below (bottom) and just above AP threshold (middle) and by large current pulses (top rows). Asterisks mark post-AHP in INPV and INSOM4/5; the arrowhead points to the delayed AP firing at threshold depolarization typically observed in INPV; arrows mark AP bursting at threshold, typical of INCCK (see below, Results). B, Average firing rates of INs and PYRs constructed from I/O plots that display the AP frequency in response to intracellular depolarizing current pulses of increasing amplitude. The curves describe the average data (mean ± SD) obtained from 17 INPV, 11 INCCK, 6 INSOM2/3, 9 INSOM 4/5, and 10 PYRs. C, Average AP phase plots showing the first derivative of membrane potential changes as a function of instantaneous AP membrane potential (dV/dt vs mV) for the different types of INs and PYRs. APs are represented as a loop in which the starting point is the threshold membrane potential, and the extreme right point is the maximal AP voltage amplitude. The average of 16 INPV, 11 INCCK, 5 INSOM2/3, 9 INSOM4/5, and 10 PYRs. The arrowheads (left and right) indicate the two AP accelerations typically observed in INPV and INSOM4/5. D, Average interspike intervals of the first 11 APs evoked by intracellular depolarizing current injection just above firing threshold in INPV (red, n = 16), INCCK (green, n = 12), INSOM2/3 (light blue, n = 5), INSOM4/5 (blue, n = 8), and PYRs (black, n = 10). E, Percentage of adapting (black column) and nonadapting (striped column) neurons divided per IN subtypes and PYRs. Adapting neurons, INPV = 0%, INCCK = 92.3%, INSOM2/3 = 66.6%, INSOM4/5 = 11.1%, and PYRs = 100%. Nonadapting neurons, INPV = 100%, INCCK = 7.7%, INSOM2/3 = 33.4%, INSOM4/5 = 88.9%, and PYRs = 0%. For statistical analysis, Fisher's exact test with Bonferroni's correction was used (* = p < 0.05, ** = p < 0.01, *** = p < 0.001).
Figure 3.
Figure 3.
Main features of APs recorded from the different subtypes of INs and PYRs. A, B, Representative trace of AP (continuous line) and its first derivative (dashed line) used to construct AP phase plots. The y-axis refers to the AP (right) and the first derivative (left), respectively; the pink dotted line indicates the alignment used to create the phase plots shown in B. AP phase plots of the different subtypes of EC neurons (B). C–F, The arrows indicate the parameters analyzed. C, AP threshold quantification (in mV), INPV = −41.57 ± 0.80, INCCK = −47.54 ± 1.20, INSOM2/3 = −44.50 ± 2.82, INSOM4/5 = −45.73 ± 1.06, PYRs = −46.73 ± 1.27. D, AP peak amplitude quantification (in mV), INPV = 29.93 ± 1.17, INCCK = 29.86 ± 2.21, INSOM2/3 = 34.30 ± 4.36, INSOM4/5 = 35.21 ± 2.23, PYRs = 40.97 ± 2.83. E, Max rise slope quantification (mV/ms), INPV = 218.40 ± 10.26, INCCK = 233.97 ± 8.28, INSOM2/3 = 237.88 ± 31.96, INSOM4/5 = 305.20 ± 23.82, PYRs = 255.55 ± 22.76. F, Maximum decay slope quantification (mV/ms), INPV = −50.61 ± 1.75, INCCK = −65.37 ± 3.6, INSOM2/3 = −77.33 ± 10.16, INSOM4/5 = −132.56 ± 22.06, PYRs = −50.09 ± 3.28. INPV (red dots, n = 16), INCCK (green dots, n = 11), INSOM2/3 (light blue dots, n = 5), INSOM4/5 (blue dots, n = 9) and PYRs (black dots, n = 10). ANOVA with Tukey's post hoc test and Kruskal–Wallis test with Dunn's post hoc test were used (* = p < 0.05, ** = p < 0.01, *** = p < 0.001).
Figure 4.
Figure 4.
Single-cell digital PCR analysis of IN subgroups and electrophysiological features of INPV with elevated CCK cDNA content. A–C, Top, Expression of Pv (red), Cck (green), and Som (blue) cDNA in 11, 12, and 12 INs, respectively, defined as INPV (A), INCCK (B), and INSOM (C) based on electrophysiological properties. The result, expressed as copies/µl, were normalized assuming that the total copies/µl of all targets (PV + CCK + SOM) is equal to 100 (percentage); the percentage of each target was calculated as the relative ratio. For statistical analysis and data distribution, ANOVA with Tukey's post hoc test was used; for data not normally distributed, Kruskal–Wallis test with Dunn's post hoc test was used (* = p < 0.05, ** = p < 0.01, *** = p < 0.001). Bottom, Data obtained in INPV that expressed CCK at levels higher than PV are illustrated by purple dots and lines (n = 4); red symbols mark data from the remaining INPV group (n = 13); green symbols identify INCCK data (n = 13). D, Average firing rate (I/O plot) of INs in response to intracellular current pulses of increasing amplitude: E, Average interval between the first 11 APs evoked by intracellular depolarizing current injection just over the threshold. F, Averaged AP phase plots showing the derivative of membrane potential (dV/dt vs mV) as a function of instantaneous membrane potential during action potential for the different groups of INs. The data confirm that the four INPV with high CCK content showed electrophysiological features different from INCCK.
Figure 5.
Figure 5.
Firing patterns of interneurons and pyramidal cells during SLEs induced by slice perfusion with 100 μm 4-AP in 0.5 mm Mg2+. A, LVF (arrow) SLE simultaneously recorded with an extracellular electrode (bottom trace) and from an INPV (top trace). B, LVF-onset SLE (arrow) simultaneously recorded from a PYR neurons (top trace) and with an extracellular electrode (bottom trace). C, SLE characterized by an HYP (arrows on large spikes in bottom trace) intracellularly recorded from an INSOM (top trace). Arrowheads point to synaptic background activity generated during 4-AP perfusion (E). D, HYP SLE recorded from an PYR (top trace). E, Simultaneous extracellular (bottom traces) and intracellular (top tracers) recordings during the preictal activity observed in an INPV (A) and an INCCK (B); spontaneous synaptic activity was observed in correlation with extracellular preictal spikes. F, Top, Quantification of AP numbers during 3 min perfusion with control ACSF before 4-AP application in INPV (237 ± 58.66, n = 15, red dots), INCCK (124.20 ± 32.49, n = 11, green dots), INSOM2/3 (1.6 ± 1.6, n = 5, cyan dots), INSOM4/5 (6.87 ± 4.37, n = 8, blue dots) and in PYRs (2.5 ± 1.43 925, n = 9, black dots). Bottom, Quantification of AP numbers during in 4-AP, 3 min before the onset of SLEs; INPV (237 ± 58.66, n = 15, red dots), INCCK (124.20 ± 32.49, n = 11, green dots), INSOM2/3 (421.4 ± 184.3, n = 5, cyan dots), INSOM4/5 (380.37 ± 129.38, n = 8, blue dots), and in PYRs (2.5 ± 1.43 925, n = 9, black dots). Kruskal–Wallis test with Dunn's post hoc test (* = p < 0.05, ** = p < 0.01, *** = p < 0.001).
Figure 6.
Figure 6.
GABAA receptor dependence of epileptiform events induced by 4-AP. A, Field potential extracellular recordings during 4-AP (light gray bar), perfused with kynurenic acid (KYN; dark gray bar) and coperfused with kynurenic acid and picrotoxin (PTX; black bar). B, Field extracellular recordings during 4-AP (light gray bar) perfused with PTX (black bar) and with 4-AP alone (right).
Figure 7.
Figure 7.
Correlation between extracellular SLE onset and the activity of INs and PYRs. A–Cb, Low-voltage fast SLE simultaneously recorded with an extracellular electrode (bottom trace) and an INSOM2/3 (top trace). Bottom, Expanded version of the dashed square. Arrows indicate the first action potential peak; the arrowhead points to the onset of depolarization; the right dashed line marks SLE onset (slow deflection onset) in the extracellular trace. Measurements a and b are illustrated in Ca and Cb, respectively. Ba,b, The measurements in a HYP SLE recorded from a INCCK. Ca, Delays between the peak of the first ictal AP (arrows) and the onset of the extracellular slow deflection at SLE onset (time 0, dotted vertical line); INpv (−204.92 ± 332.16 ms, n = 16, red dots), INCCK (−3135.93 ± 2099.16 ms, n = 9, green dots), INSOM2/3 (−125.6 ± 61.8 ms, n = 5, cyan dots), and INSOM4/5 (−800.13 ± 556.79 ms, n = 8, blue dots); PYRs showed a higher variability (+5824.1 ± 2388.25 ms, n = 10, black dots). AP firing showed statistical significance for INCCK in comparison with PYR (right, asterisk; Kruskal–Wallis test with Dunn's post hoc test). Wilcoxon signed-rank test showed that PYR began to fire after onset of SLE (positive delay; hashtag symbol on the left of the box chart), whereas INs did not have significant delay (started to fire at onset of SLE). Cb, Plot of the delays between the preictal intracellular depolarizing potential (arrowheads) and the onset of the slow extracellular deflection at SLE onset (time 0); INPV (−32.82 ± 22.55 ms, n = 13), INCCK (−42.71 ± 18.37 ms, n = 8), and INSOM2/3 (−103.75 ± 24.12 ms, n = 4) and INSOM4/5 (−117.6 ± 51.74 ms, n = 5); PYRs (+3579.08 ± 1464.22 ms; n = 8). INSOM2/3 and INSOM4/5 began to fire earlier than PYRs (asterisks on the right of box charts; Kruskal–Wallis test with Dunn's post hoc test). Wilcoxon signed-rank test showed that PYR began to fire after onset of SLE (positive delay), whereas INCCK, INSOM2/3 and INSOM4/5 began to fire before onset of SLE (negative delay), and INPV did not have significant delay (started to fire at onset of SLE). D, Same data as in Cb, illustrated with an extended time scale and without PYRs data for better comparing features of GABAergic neurons; symbols for statistical significance are not indicated; * = p < 0.05.
Figure 8.
Figure 8.
Depolarizing block after SLEs induced by 4-AP. A, Representative LVF SLE recorded with an extracellular electrode (bottom trace) and with a patch electrode from an IN (top trace); the arrowhead indicates the DB after SLE onset. B, Percentage of cells that showed DB (INPV = 37.5%, INCCK = 50%, INSOM2/3 = 60%, INSOM4/5 = 80% and PYRs = 40%, black columns) and did not show DB (INPV = 62.5%, INCCK = 50%, INSOM2/3 = 40%, INSOM4/5 = 20% and PYRs = 60%, striped columns). C, Quantification of maximal membrane potential depolarization value measured in INPV, INCCK, and INSOM during SLE; membrane potential values of INs that show (left columns) and did not show DB (right columns) are illustrated (* = p < 0.05, *** = p < 0.001). All INs with DB showed membrane depolarization above −30 mV. Statistical analysis could not be performed for INSOM2/3 and INSOM4/5 because of the small sample size. D, DB duration in seconds (sec) in INPV (4.56 ± 1.36, n = 6, red dots), INCCK (3.97 ± 2.20, n = 5, green dots), INSOM2/3 (2.8 ± 1.62, n = 3, cyan dots), INSOM4/5 (3.93 ± 1.12, n = 7, blue dots), and PYRs (0.95 ± 0.19, n = 4, black dots). The data show no significant difference in the duration of the DB. ANOVA with Tukey's post hoc test was used.
Figure 9.
Figure 9.
Different firing patterns during the late phase at the end of SLEs. Aa–c, Burst firing recorded with the whole-cell patch electrodes (top traces) or the extracellular electrodes (bottom traces) during the late phase of SLEs induced by 4-AP perfusion. In the IN illustrated in a, the duration of the extracellular and intracellular bursts are similar. Intracellular burst firing lasted longer than the simultaneous extracellular burst discharge in the IN shown in b. High-frequency firing not related with extracellular bursting activity of SLEs was recorded from the IN in c. B, Expanded traces of the three different late SLE patterns illustrated in A. C, Percentage of neurons (INpv, INCCK, INSOM2/3, INSOM4/5, and PYRs) showing the three patterns displayed in A. Short bursts were recorded in 18.75% INPV, 8.33% INCCK, 0% INSOM2/3, 37.5% INSOM4/5, and 66.66% PYRs (black columns); long-lasting intracellular bursts were observed in 43.75% INPV, 91.66% INCCK, 80% INSOM2/3, 37.5% INSOM4/5, and 33.33% PYRs (striped columns); high-frequency firing not correlated with extracellular bursting was found in 37.5% INPV, 0% INCCK, 20% INSOM2/3, 25% INSOM4/5s and 0% PYRs (empty columns). Chi-square goodness-of-fit test showed that PYRs displayed more short burst discharges than other types of firing (p = 0.049) and INCCK more long-lasting intracellular bursts than other types of firing (p = 0.0001); INPV and INSOM did not show a favorite type of firing.

Similar articles

Cited by

References

    1. Aracri P, Colombo E, Mantegazza M, Scalmani P, Curia G, Avanzini G, Franceschetti S (2006) Layer-specific properties of the persistent sodium current in sensorimotor cortex. J Neurophysiol 95:3460–3468. 10.1152/jn.00588.2005 - DOI - PubMed
    1. Armstrong C, Wang J, Yeun Lee S, Broderick J, Bezaire MJ, Lee SH, Soltesz I (2016) Target-selectivity of parvalbumin-positive interneurons in layer II of medial entorhinal cortex in normal and epileptic animals. Hippocampus 26:779–793. 10.1002/hipo.22559 - DOI - PMC - PubMed
    1. Assaf F, Schiller Y (2016) The antiepileptic and ictogenic effects of optogenetic neurostimulation of PV-expressing interneurons. J Neurophysiol 116:1694–1704. - PMC - PubMed
    1. Avoli M, de Curtis M (2011) GABAergic synchronization in the limbic system and its role in the generation of epileptiform activity. Prog Neurobiol 95:104–132. 10.1016/j.pneurobio.2011.07.003 - DOI - PMC - PubMed
    1. Avoli M, Psarropoulou C, Tancredi V, Fueta Y (1993) On the synchronous activity induced by 4-aminopyridine in the CA3 subfield of juvenile rat hippocampus. J Neurophysiol 70:1018–1029. 10.1152/jn.1993.70.3.1018 - DOI - PubMed

Publication types

Substances