. 2023 Feb 22;8(4):e161042.
doi: 10.1172/jci.insight.161042.

Metagenomic and single-cell RNA-Seq survey of the Helicobacter pylori-infected stomach in asymptomatic individuals

Affiliations

Metagenomic and single-cell RNA-Seq survey of the Helicobacter pylori-infected stomach in asymptomatic individuals

Chiara Sorini et al. JCI Insight. .

Abstract

Helicobacter pylori colonization of the gastric niche can persist for years in asymptomatic individuals. To deeply characterize the host-microbiota environment in H. pylori-infected (HPI) stomachs, we collected human gastric tissues and performed metagenomic sequencing, single-cell RNA-Seq (scRNA-Seq), flow cytometry, and fluorescent microscopy. HPI asymptomatic individuals had dramatic changes in the composition of gastric microbiome and immune cells compared with noninfected individuals. Metagenomic analysis uncovered pathway alterations related to metabolism and immune response. scRNA-Seq and flow cytometry data revealed that, in contrast to murine stomachs, ILC2s are virtually absent in the human gastric mucosa, whereas ILC3s are the dominant population. Specifically, proportion of NKp44+ ILC3s out of total ILCs were highly increased in the gastric mucosa of asymptomatic HPI individuals, and correlated with the abundance of selected microbial taxa. In addition, CD11c+ myeloid cells and activated CD4+ T cells and B cells were expanded in HPI individuals. B cells of HPI individuals acquired an activated phenotype and progressed into a highly proliferating germinal-center stage and plasmablast maturation, which correlated with the presence of tertiary lymphoid structures within the gastric lamina propria. Our study provides a comprehensive atlas of the gastric mucosa-associated microbiome and immune cell landscape when comparing asymptomatic HPI and uninfected individuals.

Keywords: Bacterial infections; Cellular immune response; Immunology; Microbiology.


Figures
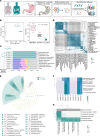
Figure 1
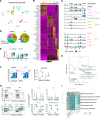
Figure 1. Composition and immune-related functions of the gastric microbiome in HPI tissues.
(A) Schematic representation of experimental workflow for detecting the gastric microbiome. (B) Principal coordinate analysis (PCoA) of identified bacterial species based on Bray-Curtis distance. (C) The 10 most abundant bacterial species of the HPI and uninfected tissues. F, fundus; A, antrum. (D) Spearman correlation between the identified most abundant species. (E) LDA effect size analysis (LDA > 4) of bacteria in the HPI and uninfected tissues. (F) Significantly increased microbial functional pathways related to immune function in HPI tissues. (G) Spearman correlation analysis between the identified differential species and immune-related KEGG pathways in HPI and uninfected tissues. *P < 0.05, **P < 0.01.
Figure 2
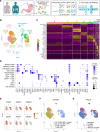
Figure 2. scRNA-Seq resolves the lymphoid and myeloid gastric immune compartment.
(A) Schematic representation of the experimental workflow leading to scRNA isolation and sequencing of gastric immune cells. (B) UMAP showing unbiased clustering analysis of all sequenced cells. (C) Heatmap of top differentially expressed genes between clusters shown in B. (D) Dot plot showing expression of selected cell markers that were used to annotate clusters in B. (E) UMAP plots showing expression of selected T cell receptor and Ig genes. max, maximum; min, minimum. (F and G) UMAP visualization of all sequenced cells, color coded on the basis of their origin from each sorted fraction (F) and stomach region (G). Data represent a pool of cells from the gastric mucosa of 3 HPI and 6 uninfected individuals.
Figure 3
Figure 3. Innate immune cells from the HPI and uninfected tissues.
(A) UMAP showing unbiased clustering analysis of innate immune cells found in the gastric tissues. (B) Heatmap of top differentially expressed genes between clusters shown in panel A. (C) Violin plots showing expression of selected markers. (D) Frequency of each myeloid cell subset within total identified myeloid cells in HPI and uninfected tissues. (E) Violin plots showing expression of GPR183 gene. (F and G) Representative flow cytometric plots (left) and quantification (right) of total ILC frequency out of CD45+ cells (F) or ILC subsets (G) in the fundus and antrum of HPI (n = 4) and uninfected tissues (n = 4 antrum, n = 5 fundus), based on surface markers indicated in Supplemental Table 3. Data are reported as mean ± SD. *P < 0.05, ***P < 0.001 by 2-way ANOVA with Sidak post hoc test. (H) Redundancy analysis (RDA) comparing ILC subset percentages from G with the relative abundance of microbial species that were differentially related to control or HPI tissues in Figure 1E. (I) Spearman correlation analysis between altered microbial species and ILC percentages induced by H. pylori infection. *P < 0.05, **P < 0.01.
Figure 4
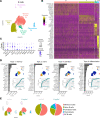
Figure 4. B cell activation and plasmablast differentiation are enhanced in HPI gastric mucosa.
(A) UMAP showing unbiased clustering analysis of B cell subsets found in the gastric tissues. (B) Heatmap of top differentially expressed genes between clusters shown in A. (C) Dot plot showing expression of selected cell markers. (D) Topic modeling of B cell scRNA-Seq data from HPI and uninfected tissues. This includes, for each topic, a bar plot showing the scores (x axis) of top-ranked genes within the indicated topic (left); a UMAP plot showing B cells colored by the topic’s weight in the cell (top right); the empirical cumulative density function (CDF) (y axis) of topic weights (x axis) for the infected and uninfected condition (bottom right). Adjusted P values were determined using a Wilcoxon rank-sum test. max, maximum; min, minimum. (E) Frequency of each B cell cluster within total B cells in the gastric lamina propria of HPI and uninfected tissues.
Figure 5
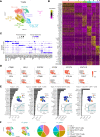
Figure 5. H. pylori infection is associated with reduced CD8+ CTLs and increased Th cells proportions.
(A) UMAP showing unbiased clustering analysis of T cell subsets found in the gastric lamina propria. (B) Heatmap of top differentially expressed genes between clusters shown in A. (C) Dot plot showing expression of selected cell markers. (D) UMAP plots showing expression of selected genes. max, maximum; min, minimum. (E) Topic modeling of T cell scRNA-Seq data between HPI and uninfected tissues. This includes, for each topic, a bar plot showing the scores (x axis) of top-ranked genes within the indicated topic (left); a UMAP plot showing T cells colored by the topic’s weight in the cell (top right); the empirical cumulative density function (CDF; y axis) of topic weights (x axis) for the infected and uninfected condition (bottom right). Adjusted P values were determined using a Wilcoxon rank-sum test. (F) Relative abundance of each T cell subset within total T cells in the stomach of HPI and uninfected tissues.
Figure 6
Figure 6. H. pylori infection is associated with increased Tregs and Tfh cells percentages (implicit, out of total T cells).
(A) UMAP showing unbiased clustering analysis of CTLA4+CD4+ T cell subsets found in the gastric lamina propria. (B) UMAP plots showing expression of selected genes. (C) Frequency of subclusters of CTLA4+CD4+ T cells out of total T cells in HPI and uninfected tissues. (D) Topic modeling of activated CD4+ T cell scRNA-Seq data between HPI and uninfected tissues. This includes, for each topic, a bar plot showing the scores (x axis) of top-ranked genes within the indicated topic (left); a UMAP plot showing T cells colored by the topic’s weight in the cell (top right); the empirical cumulative density function (CDF; y axis) of topic weights (x axis) for the infected and uninfected condition (bottom right). Adjusted P values were determined using a Wilcoxon rank-sum test. (E) Weight of selected genes that define topic 2 in D. max, maximum; min, minimum.
Figure 7
Figure 7. Innate and adaptive immune cells interact to form gastric TLS during asymptomatic H. pylori infection.
(A) Number of LR interactions with score > 0.5 predicted by SingleCellSignalR analysis of transcriptomic data of all cell subsets identified in Figure 3A, Figure 4A, and Figure 5A in HPI or uninfected tissues. (B) Gene ontology (GO) enrichment analysis of ligands and receptors involved in predicted interactions in A. (C) Number of putative ligands and receptors offered by any cell type involved in interactions in HPI or uninfected tissues. (D) Multicolor immunofluorescence microscopy demonstrating distribution of CD3+, CD20+, and CD11c+ cells within the HPI and uninfected tissues. DN MAIT, double-negative mucosal-associated invariant T; mono, monocyte; pos, positive; reg, regulation; act, activated. Scale bars: 150 μm and 80 μm, as indicated.

Similar articles

Cited by

References

    1. Peleteiro B, et al. Prevalence of Helicobacter pylori infection worldwide: a systematic review of studies with national coverage. Dig Dis Sci. 2014;59(8):1698–1709. doi: 10.1007/s10620-014-3063-0. - DOI - PubMed
    1. Ianiro G, et al. Gastric microbiota. Helicobacter. 2015;20 Suppl 1: 68–71. doi: 10.1111/hel.12260. - DOI - PubMed
    1. Bik EM, et al. Molecular analysis of the bacterial microbiota in the human stomach. Proc Natl Acad Sci U S A. 2006;103(3):732–737. doi: 10.1073/pnas.0506655103. - DOI - PMC - PubMed
    1. Wang LL, et al. Participation of microbiota in the development of gastric cancer. World J Gastroenterol. 2014;20(17):4948–4952. doi: 10.3748/wjg.v20.i17.4948. - DOI - PMC - PubMed
    1. Schulz C, et al. The role of the gastric bacterial microbiome in gastric cancer: Helicobacter pylori and beyond. Therap Adv Gastroenterol. 2019;12:1756284819894062. - PMC - PubMed

Publication types