. 2023 Feb 22;8(4):e165615.
doi: 10.1172/jci.insight.165615.

The schedule of ATR inhibitor AZD6738 can potentiate or abolish antitumor immune responses to radiotherapy

Affiliations

The schedule of ATR inhibitor AZD6738 can potentiate or abolish antitumor immune responses to radiotherapy

Frank P Vendetti et al. JCI Insight. .

Abstract

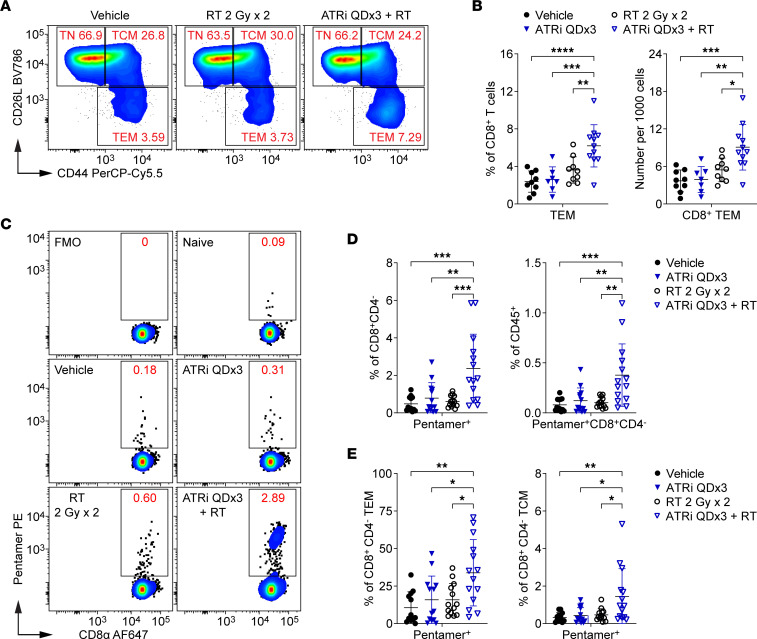
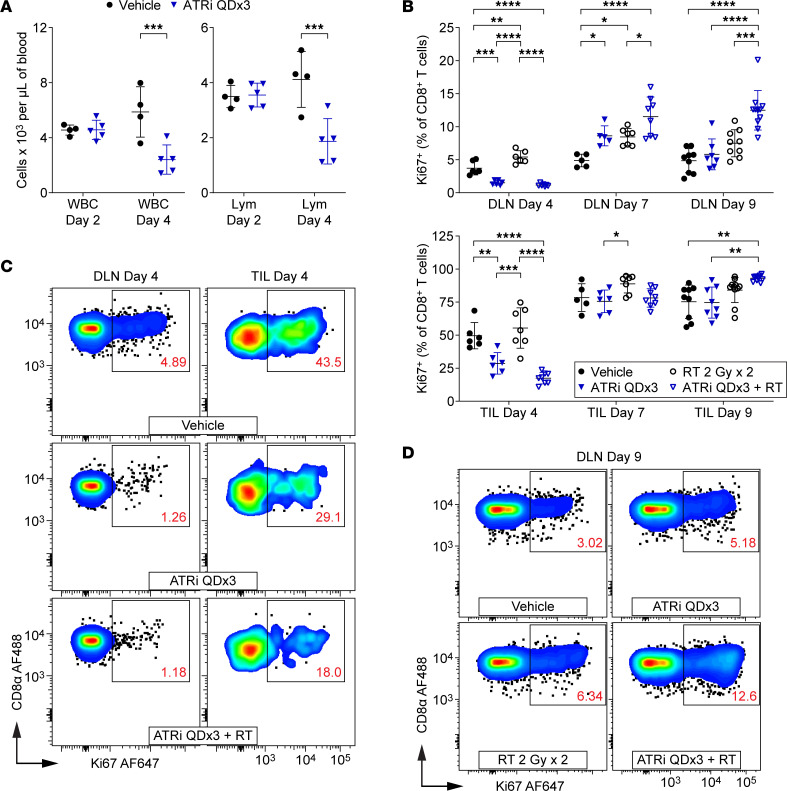
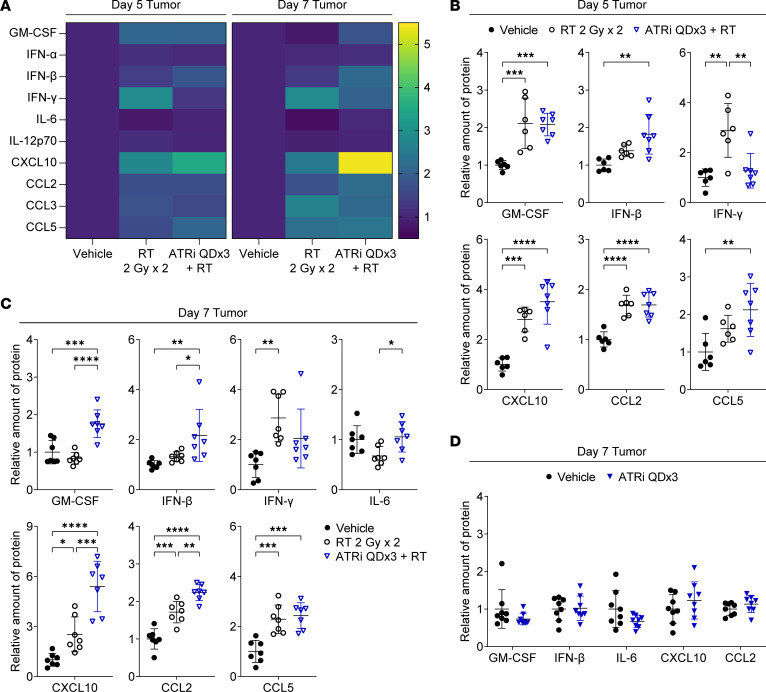
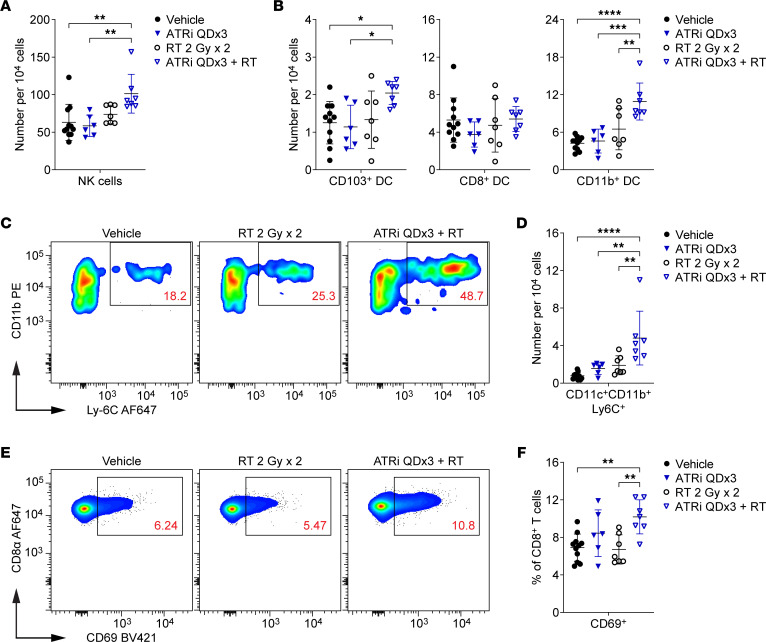
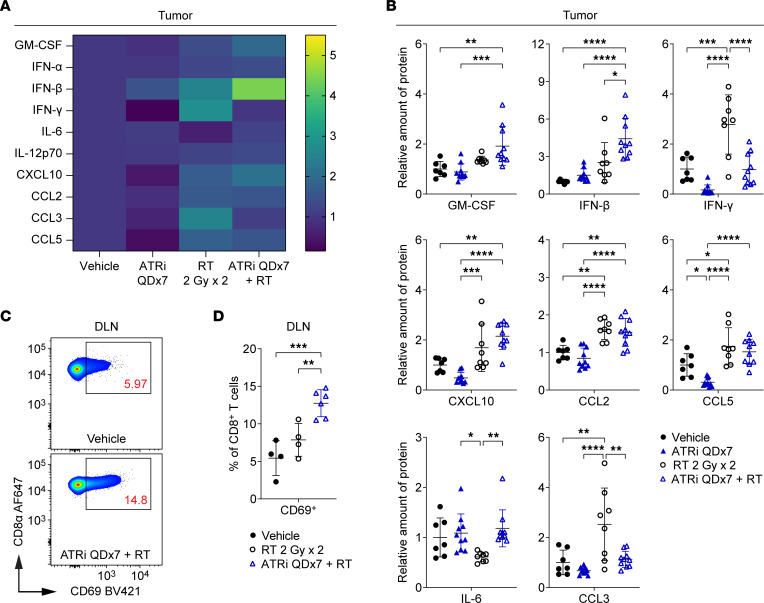
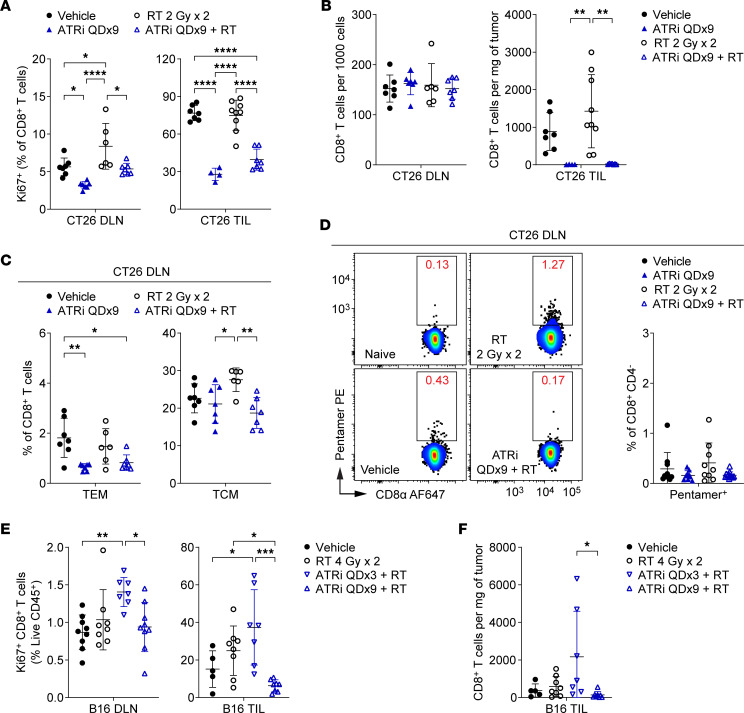
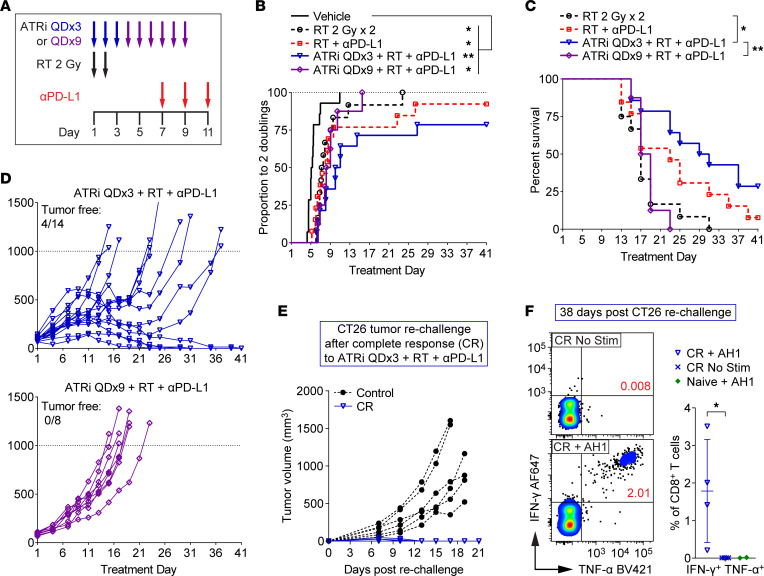
Inhibitors of the DNA damage signaling kinase ATR increase tumor cell killing by chemotherapies that target DNA replication forks but also kill rapidly proliferating immune cells including activated T cells. Nevertheless, ATR inhibitor (ATRi) and radiotherapy (RT) can be combined to generate CD8+ T cell-dependent antitumor responses in mouse models. To determine the optimal schedule of ATRi and RT, we determined the impact of short-course versus prolonged daily treatment with AZD6738 (ATRi) on responses to RT (days 1-2). Short-course ATRi (days 1-3) plus RT caused expansion of tumor antigen-specific, effector CD8+ T cells in the tumor-draining lymph node (DLN) at 1 week after RT. This was preceded by acute decreases in proliferating tumor-infiltrating and peripheral T cells and a rapid proliferative rebound after ATRi cessation, increased inflammatory signaling (IFN-β, chemokines, particularly CXCL10) in tumors, and an accumulation of inflammatory cells in the DLN. In contrast, prolonged ATRi (days 1-9) prevented the expansion of tumor antigen-specific, effector CD8+ T cells in the DLN, and entirely abolished the therapeutic benefit of short-course ATRi with RT and anti-PD-L1. Our data argue that ATRi cessation is essential to allow CD8+ T cell responses to both RT and immune checkpoint inhibitors.

Keywords: Cancer immunotherapy; Immunology; Oncology; Radiation therapy; T cells.


Conflict of interest statement

Conflict of interest: The authors have declared that no conflict of interest exists.

Figures

Figure 1
Figure 1. Short-course ATRi plus RT promotes tumor antigen–specific CD8+ T cell expansion in the DLN.
(AE) CT26 tumor–bearing mice were treated with ATRi on days 1–3 (ATRi QDx3), RT on days 1–2 (RT 2 Gy x 2), ATRi QDx3 + RT, or vehicle, and tumor-draining lymph nodes (DLNs) were immunoprofiled at day 9. (A) Representative cytograms depicting CD62L and CD44 expression on CD8+ T cells. Activated and naive CD8+ T cell subsets were defined as effector/effector memory (Tem; CD44hiCD62Llo), central memory (Tcm; CD62LhiCD44hi), or naive (Tn; CD62LhiCD44lo). (B) Quantitation of CD8+ Tem cells as percentages of CD8+ T cells or per 1,000 cells stained. Data from at least 4 independent experiments with 1–3 mice per group. n = 9 Vehicle, 7 ATRi QDx3, 9 RT, 11 ATRi QDx3 + RT. (CE) Tumor antigen–specific CD8+ T cells were labeled with AH1 Pentamer. (C) Representative cytograms depicting Pentamer+ CD8+ T cells. Fluorescence-minus-one (no Pentamer) and naive (negative, no tumor) controls shown. (D) Quantitation of Pentamer+ CD8+ T cells as percentages of CD8+CD4 cells or CD45+ immune cells. (E) Quantitation of Pentamer+ CD8+ Tem and Tcm cells as percentages of CD8+CD4 Tem and Tcm cells. (D and E) Data from at least 5 independent experiments with 1–5 mice per group. n = 12 Vehicle, 13 ATRi QDx3, 13 RT, 14 ATRi QDx3 + RT. (B, D, and E) Mean and SD bars shown. *P < 0.05, **P < 0.01, ***P < 0.001, ****P < 0.0001 by ANOVA with Tukey’s multiple-comparison test.
Figure 2
Figure 2. Proliferating T cells are depleted by short-course ATRi but rapidly rebound upon cessation of ATRi treatment.
(A) BALB/c mice were treated with ATRi QDx3 or vehicle. Complete blood counts (CBCs) were performed at days 2 (24 hours after the first dose of ATRi) and 4 (24 hours after the third dose of ATRi). n = 4 vehicle, 5 ATRi QDx3. Quantitation of white blood cells (WBC) and lymphocytes (Lym) per microliter of blood, with mean and SD bars, is shown. ***P < 0.001 by 2-way ANOVA with Šidák’s multiple-comparison test. (BD) CT26 tumor–bearing mice were treated with ATRi QDx3, RT 2 Gy x 2, ATRi QDx3 + RT, or vehicle. DLN and TILs were immunoprofiled at days 4, 7, and 9. (B) Quantitation of proliferating (Ki67+) CD8+ T cells, as percentages of CD8+ T cells, in DLN and TILs at days 4, 7, and 9. Data from at least 3 (day 4), 2 (day 7), or 4 (day 9) independent experiments with 1–4 mice per group. n at days 4/7/9 = 6/5/9 Vehicle, 6/6(5 DLN)/8(7 DLN) ATRi QDx3, 7(6 DLN)/7/11(9 DLN) RT, 8(7 DLN)/8/11 ATRi QDx3 + RT. Mean and SD bars shown. *P < 0.05, **P < 0.01, ***P < 0.001, ****P < 0.0001 by ANOVA with Tukey’s multiple-comparison test. (C and D) Representative cytograms depicting Ki67 expression in CD8+ T cells in DLN and TILs at day 4 (C) and TILs at day 9 (D).
Figure 3
Figure 3. CD8+ T cell recovery in TILs after short-course ATRi plus RT requires transit of CD8+ T cells from the periphery.
(AC) CT26 tumor–bearing mice treated with ATRi QDx3, RT 2 Gy x 2, ATRi QDx3 + RT, or vehicle. (A) Quantitation of CD8+ T cells, per 1,000 cells stained, in DLN at days 4 and 7. (B) Quantitation of Pentamer+ CD8+ T cells, as percentages of CD8+CD4 cells, in DLN at days 4 and 7. Data from at least 3 experiments per time point with 1–5 mice per group. n at days 4/7 = 6/8 Vehicle, 6/10 ATRi QDx3, 7/10 RT, 8/11 ATRi QDx3 + RT. (C) Quantitation of CD8+ T cells, per milligram of tumor, in the TILs at days 4, 7, and 9. (A and C) Data from at least 3 (day 4), 2 (day 7), or 4 (day 9) independent experiments with 1–4 mice per group. n at day 4/7/9 = 6/5/9 Vehicle, 6/6(5 DLN)/8 ATRi QDx3, 7(6 DLN)/7/11 RT, 8(7 DLN)/8/11 ATRi QDx3 + RT. (D and E) CT26 tumor–bearing mice treated with ATRi QDx3 + RT or vehicle, with or without FTY720 Q2Dx4. (D) Lymphocyte (Lym) quantitation, per microliter of blood, from CBC at day 9. Data from 3 experiments with 2–4 mice per group. n = 9 Vehicle, 8 FTY720 Q2Dx4, 10 ATRi QDx3 + RT, 11 ATRi QDx3 + RT + FTY. (E) Quantitation of CD8+ T cells, per milligram of tumor, in TILs at day 9. Data from 4 experiments with 1–4 mice per group. (AE) Mean and SD bars shown. *P < 0.05, **P < 0.01, ***P < 0.001, ****P < 0.0001 by ANOVA with Tukey’s (AC) or Šidák’s (D and E) multiple-comparison tests.
Figure 4
Figure 4. Short-course ATRi treatment potentiates RT-induced inflammatory cytokines and chemokines in the tumor microenvironment.
(AC) CT26 tumor–bearing mice were treated with RT 2 Gy x 2, ATRi QDx3 + RT, or vehicle. (A) Heatmaps depicting the mean relative amount (normalized to vehicle control) of 10 inflammatory cytokines and chemokines in tumors at days 5 and 7. (B and C) Quantitation of the relative amount of protein (normalized to vehicle control) for a subset of inflammatory cytokines and chemokines in tumors at day 5 (B) and day 7 (C). Day 5 data from 1 experiment with n = 6 Vehicle, 6 RT, 7 ATRi QDx3 + RT. Day 7 data from 2 independent experiments, each with 3–4 mice per group, with total n = 7 Vehicle, 7 RT, 7 ATRi QDx3 + RT. (D) CT26 tumor–bearing mice were treated with ATRi QDx3 or vehicle, and the relative amounts of protein (normalized to vehicle control) for a subset of inflammatory cytokines and chemokines in tumors at day 7 were quantified. Data from 3 independent experiments, each with 2–3 mice per group. n = 8 mice per group. (BD) Mean and SD bars shown. (B and C) *P < 0.05, **P < 0.01, ***P < 0.001, ****P < 0.0001 by ANOVA with Tukey’s multiple-comparison test. (D) No significant changes by unpaired, 2-tailed t test.
Figure 5
Figure 5. Short-course ATRi plus RT promotes accumulation of inflammation-associated innate immune cells and increased CD8+ T cell activation in the DLN.
(AF) CT26 tumor–bearing mice were treated with ATRi QDx3, RT 2 Gy x 2, ATRi QDx3 + RT, or vehicle, and DLNs were immunoprofiled at day 7. (A) Quantitation of NK cells (NKp46+ and CD3CD19) per 104 cells stained. (B) Quantitation of DC subsets per 104 cells stained. Immunoprofiled DC subsets include CD103+ DCs (CD11c+CD103+ and CD3CD19NKp46), CD8+ DCs (CD11c+CD8+ and CD3CD19NKp46CD11b), and CD11b+ DCs (CD11c+CD11b+ and CD3CD19NKp46CD8). (C) Representative cytograms depicting CD11b and Ly-6C expression on CD11c+ (and CD3CD19NKp46) cells. (D) Quantitation of CD11c+CD11b+Ly-6C+ (and CD3CD19NKp46CD8) cells per 104 cells stained. (E) Representative cytograms depicting CD69 expression on CD8+ T cells. (F) Quantitation of newly or recently activated CD69+CD8+ T cells, as a percentage of CD8+ T cells. (A, B, D, and F) Data from 2 independent experiments with 3–4 Vehicle, RT, and ATRi QDx3 + RT mice per group and 1 experiment with 3 Vehicle and 6 ATRi QDx3 mice per group. n = 11 Vehicle, 6 ATRi QDx3, 7 RT, 7 ATRi QDx3 + RT. Mean and SD bars shown. *P < 0.05, **P < 0.01, ***P < 0.001, ****P < 0.0001 by ANOVA with Tukey’s multiple-comparison test.
Figure 6
Figure 6. Prolonged daily ATRi potentiates RT-induced IFN-β but not inflammatory chemokines in the tumor microenvironment.
(AD) CT26 tumor–bearing mice were treated with ATRi on days 1–7 (ATRi QDx7), RT 2 Gy x 2 (days 1–2), ATRi QDx7 + RT, or vehicle. (A) Heatmaps depicting the mean relative amount (normalized to vehicle control) of 10 inflammatory cytokines and chemokines in tumors at day 7. (B) Quantitation of the relative amount of protein (normalized to vehicle control) for a subset of inflammatory cytokines and chemokines in tumors at day 7. (A and B) Data from at least 4 independent experiments with 1–4 mice per group. n = 7 Vehicle, 10 ATRi QDx7, 8 RT, 10 ATRi QDx7 + RT. (C and D) CT26 tumor–bearing mice were treated with RT 2 Gy x 2, ATRi QDx7 + RT, or vehicle. (C) Representative cytograms depicting CD69 expression on CD8+ T cells in DLN at day 7. (D) Quantitation of newly or recently activated CD69+CD8+ T cells in the DLN at day 7. Data from at least 2 independent experiments with 1–3 mice per group. n = 4 Vehicle, 4 RT, 6 ATRi QDx7 + RT. (B and D) Mean and SD bars shown. *P < 0.05, **P < 0.01, ***P < 0.001, ****P < 0.0001 by ANOVA with Tukey’s multiple-comparison test.
Figure 7
Figure 7. Prolonged daily ATRi treatment abolishes the adaptive CD8+ T cell response following RT.
(AD) CT26 tumor–bearing mice were treated with ATRi on days 1–9 (ATRi QDx9), RT 2 Gy x 2 (days 1–2), ATRi QDx9 + RT, or vehicle, and immunoprofiled at day 9, 1 hour after the final dose of ATRi. (A) Quantitation of proliferating (Ki67+) CD8+ T cells, as percentages of CD8+ T cells, in DLN and TILs. (B) Quantitation of CD8+ T cells in DLN (per 1,000 cells) and TILs (per milligram of tumor). (C) Quantitation of CD8+ Tem and Tcm cells, as percentages of CD8+ T cells, in DLN. (AC) Data from 2 independent experiments (1 for ATRi QDx9 TIL) with 2–5 mice per group. n = 7 Vehicle, 7 ATRi QDx9 DLN (4 TIL), 9 RT TIL (6 DLN), 7 ATRi QDx9 + RT. (D) Representative cytograms and quantitation of Pentamer+ CD8+ T cells, as percentages of CD8+CD4 cells, in DLN. Data from 5 independent experiments with 1–4 mice per group. n = 10 Vehicle, 9 ATRi QDx9, 9 RT, 12 ATRi QDx9 + RT. (E and F) B16 tumor–bearing mice were treated with RT 4 Gy x 2 (days 1–2), ATRi QDx3 + RT, ATRi QDx9 + RT, or vehicle, and immunoprofiled at day 9 (1 hour after the final dose of ATRi QDx9). (E) Quantitation of proliferating (Ki67+) CD8+ T cells, as percentages of live, CD45+ immune cells, in DLN and TILs. (F) Quantitation of CD8+ T cells, per milligram of tumor, in TILs. (E and F) Data from 2 independent experiments with 2–6 mice per group. n = 9 Vehicle DLN (5 TIL), 8 RT, 7 ATRi QDx3 + RT, 9 ATRi QDx9 + RT DLN (8 TIL). (AF) Mean and SD bars shown. *P < 0.05, **P < 0.01, ***P < 0.001, ****P < 0.0001 by ANOVA with Tukey’s multiple-comparison test.
Figure 8
Figure 8. ATRi cessation is necessary for extended survival and complete responses after treatment with ATRi and sequential RT plus PD-L1 blockade.
(A) Schema for CT26 tumor–bearing mice treated with RT 2 Gy x 2 (days 1–2), RT + anti–PD-L1 (αPD-L1; days 7, 9, 11), ATRi QDx3 + RT + αPD-L1, ATRi QDx9 + RT + αPD-L1, or vehicle. (B) Proportions of mice that reached 2 tumor volume doublings, plotted over time. *P < 0.05, **P < 0.01 by log-rank test with Holm-Šidák adjustment for multiple comparisons (all groups). (C) Survival curves for non-vehicle groups. The survival endpoint was when tumor volume exceeded 1,000 mm3. *P < 0.05, **P < 0.01 by log-rank test with Holm-Šidák adjustment for multiple comparisons (non-vehicle groups). (D) Individual tumor growth curves for the ATRi QDx3 + RT + αPD-L1 and ATRi QDx9 + RT + αPD-L1 groups. The numbers of tumor-free mice (complete responders) are noted. (AD) Data from 2 independent experiments with 5–8 mice per group (1 experiment for ATRi QDx9 + RT + αPD-L1). n = 14 Vehicle, 12 RT, 13 RT + αPD-L1, 14 ATRi QDx3 + RT + αPD-L1, and 8 ATRi QDx9 + RT + αPD-L1. (E) Individual tumor growth curves for ATRi QDx3 + RT + αPD-L1 complete responders (CR, n = 4) rechallenged with CT26 and for control mice (n = 6) challenged with CT26 for the first time. (F) Representative cytograms and quantitation of IFN-γ+TNF-α+ CD8+ T cells in AH1 peptide–stimulated (CR + AH1, n = 4) versus unstimulated (CR No Stim, n = 4) splenocytes from CR mice and AH1 peptide–stimulated splenocytes from tumor-naive mice (Naive + AH1, n = 2). *P > 0.05 by 2-tailed, unpaired t test. Naive + AH1 controls were not included in the statistical analysis.

Similar articles

Cited by

References

    1. Bracci L, et al. Immune-based mechanisms of cytotoxic chemotherapy: implications for the design of novel and rationale-based combined treatments against cancer. Cell Death Differ. 2014;21(1):15–25. doi: 10.1038/cdd.2013.67. - DOI - PMC - PubMed
    1. O’Connor MJ. Targeting the DNA damage response in cancer. Mol Cell. 2015;60(4):547–560. doi: 10.1016/j.molcel.2015.10.040. - DOI - PubMed
    1. Ciccia A, Elledge SJ. The DNA damage response: making it safe to play with knives. Mol Cell. 2010;40(2):179–204. doi: 10.1016/j.molcel.2010.09.019. - DOI - PMC - PubMed
    1. Huang RX, Zhou PK. DNA damage response signaling pathways and targets for radiotherapy sensitization in cancer. Signal Transduct Target Ther. 2020;5(1):60. doi: 10.1038/s41392-020-0150-x. - DOI - PMC - PubMed
    1. Pilger D, et al. Interfaces between cellular responses to DNA damage and cancer immunotherapy. Genes Dev. 2021;35(9–10):602–618. - PMC - PubMed

Publication types