Review
. 2023 Feb 14;7(1):12.
doi: 10.3390/vision7010012.

The Action Cycle Theory of Perception and Mental Imagery

Affiliations
Review

The Action Cycle Theory of Perception and Mental Imagery

David F Marks. Vision (Basel). .

Abstract

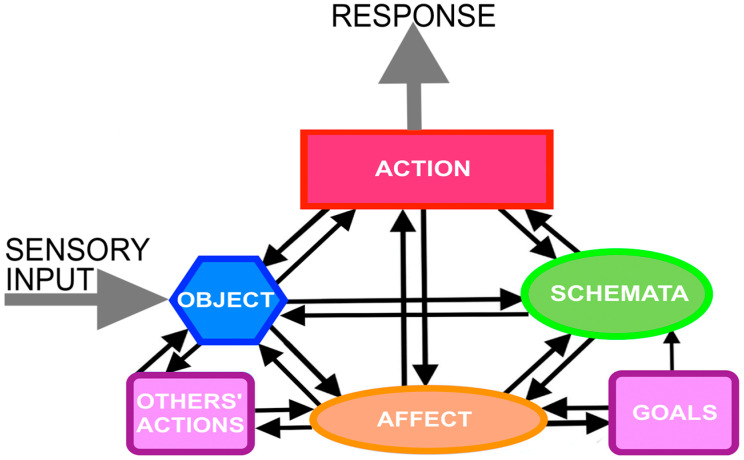
The Action Cycle Theory (ACT) is an enactive theory of the perception and a mental imagery system that is comprised of six modules: Schemata, Objects, Actions, Affect, Goals and Others' Behavior. The evidence supporting these six connected modules is reviewed in light of research on mental imagery vividness. The six modules and their interconnections receive empirical support from a wide range of studies. All six modules of perception and mental imagery are influenced by individual differences in vividness. Real-world applications of ACT show interesting potential to improve human wellbeing in both healthy people and patients. Mental imagery can be applied in creative ways to make new collective goals and actions for change that are necessary to maximize the future prospects of the planet.

Keywords: Action Cycle Theory; VVIQ; action; affect; individual differences; mental imagery; neuroscience; perception; schemata; vividness.


Conflict of interest statement

The author declares no conflict of interest.

Figures

Figure 1
Figure 1
Descartes’ 1644 illustration from Principles of Philosophy [1] showing his theory of vision. Light rays from the arrow stimulus (A,B,C) impress particles into the eyes from which the image is transmitted to the pineal gland, the confluence of mind and body. It is as if the visual system is an internal screen or theatre [2]. The picture shows the pineal gland converting an external stimulus into the action of pointing.
Figure 2
Figure 2
The six modules of Action Cycle Theory: Object, Schemata, Action, Affect, Goals and Other’s Actions. The large grey arrows represent sensory input and the organism’s response in perception. In mental imagery, the system of six modules is activated in the absence of sensory input. The black arrows indicate hypothesized causal relationships. The majority of interconnections are reciprocal, meaning that any module can causally influence, and be causally influenced by, its neighbors. The absence of an arrow going from Schemata to Goals indicates that Schemata do not influence Goals that are determined only by Affect, i.e., the degree to which happiness or pleasure can be increased and/or pain can be diminished.
Figure 3
Figure 3
Mental activities controlled by schemata in the cerebellum. The figure shows a coronal section of a human cerebellum on which the sites of the observed activities are indicated by colored circles. Reprinted with permission from ref. [43]. 2008, M. Ito.
Figure 4
Figure 4
Anatomical location of regions of interest. Nodes of each region are displayed in different colors: the parahippocampal place area (PPA) is represented in sky-blue; retro-splenial complex (RSC) is represented in green; and occipital place area (OPA) is shown in pink. The edges between regions represent the connections separately modelled for each hemisphere in the Dynamic Causal Modelling (DCM) analysis. Reprinted with permission from ref. [52]. 2022. M G Tullo. Regions of each hemisphere were visualized using the BrainNet Viewer [53].
Figure 5
Figure 5
Relative activity in visual cortex correlates with subjective vividness rating. (a) Timeline of the visualization task. Participants began to visualize upon hearing the ‘go’ signal and stopped visualization upon hearing the ‘stop’ signal, resulting in a 10-s visualization phase and 10-s rest phase. All instructions were auditory. (b) Time course of the relative fMRI signal in visual cortex for 8 participants. Relative fMRI was taken as the BOLD signal in early visual cortex (Brodmann’s areas 17 and 18, illustrated in inset) minus the BOLD signal measured over all of grey matter. For plotting purposes, participants are ordered by their relative visual cortex activity averaged over the visualization window of 0–10 s. The negative signal for some subjects is due in part to the subtraction of the whole brain activity—i.e., other regions can increase more than the visual cortex during the time window. (c) The relative visual cortex signal averaged over the visualization window correlates significantly with the subjective rating of vividness (p = 0.04). Reprinted with permission from ref. [25]. 2005. X. Cui et al. Note that there were only 8 participants in this study, and the p level for the correlation was only 0.04. The 5 subjects with the most vivid visual imagery produced positive relative fMRI signals in the visual cortex. Other studies have obtained different results [27].
Figure 6
Figure 6
Correlation between VVIQ scores and VI BOLD signal. (A) Correlations between the percent signal change for VI in each subject and the VVIQ scores of these individual subjects in three ROIs. There were significant negative correlations between A1 (primary auditory cortex) activity and the vividness of the imagery, a trend for positive correlations with V1 (primary visual cortex) and no correlation with PC (posterior cingulate ‘default brain’ area). (B) Voxel-by-voxel correlations between VI activity and individual VVIQ correlations. Results presented on axial slices covering mainly auditory cortex. The investigators found negative correlations in auditory and somatosensory cortex only. Positive correlations were found in visual, prefrontal and parahippocampal areas bilaterally. Reprinted with permission from ref. [59]. 2005. A. Amedi et al.
Figure 7
Figure 7
Skin conductance data for imagery and perception experiments with aphantasics and controls. (a) Imagery experiment. Fifty seconds of baseline SCL was recorded prior to each scenario trial while participants viewed an on-screen instruction. Next, each scenario trial was presented to participants as a succession of 50 on-screen phrases, each displayed for 2 s. (b) (i) Aggregated progressions of baseline-corrected SCL across the duration of scenarios (sampled as average across 5 s time bins). (ii) Mean and SEM across time bins. (c) Perception experiment. Baseline SCL was recorded while participants viewed neutral photos, before being presented with a succession of frightening photos. Photos appeared on screen for 5 s each and immediately followed one another. (d) (i) Aggregated progressions of baseline-corrected SCL across the duration of the frightening photos sequence (sampled as average across 5 s time bins). (ii) Mean and SEM across time bins. Reprinted with permission from ref. [88]. 2021. M. Wicken et al.
Figure 8
Figure 8
Overlap between executed, observed and imagined reaching in left dorsal premotor (superior frontal sulcus and gyrus) and left posterior parietal areas, on group surface-averaged activations from 15 subjects, displayed on one subject’s inflated hemisphere. The overlaps in premotor and parietal regions served as regions of interest in the percent signal change analysis. (a) Dorsal view of left hemisphere. (b) Medial view of left hemisphere. Executed, observed and imagined reaching all activated a medial parietal area located in between the parieto-occipital sulcus and the posterior end of the cingulate sulcus, outlined in light blue. Sup. frontal gyr. = superior frontal gyrus; POS = parieto-occipital sulcus; calcarine = calcarine sulcus; cingulate sulc. = cingulate sulcus. Reprinted with permission from ref. [100]. 2007. F. Filimon, et al.

Similar articles

Cited by

References

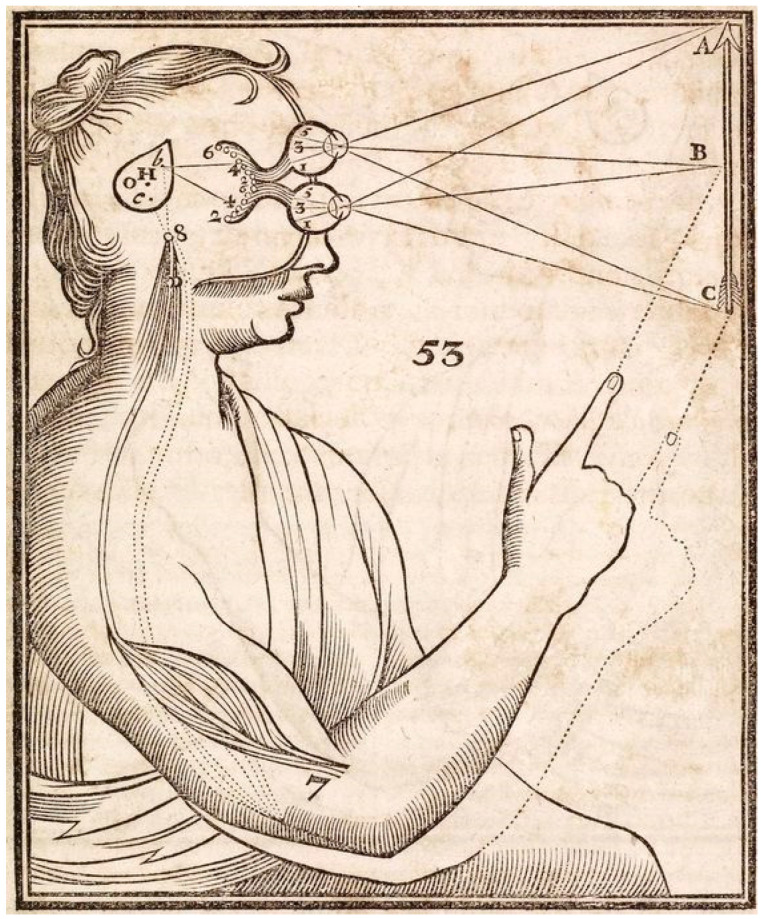
    1. Descartes R. Principles of Philosophy. Simon and Shuster; New York, NY, USA: 2012. 1644.
    1. O’Regan J.K. Solving the real mysteries of visual perception: The world as an outside memory. Can. J. Psychol. Can. de Psychol. 1992;46:461–488. doi: 10.1037/h0084327. - DOI - PubMed
    1. von Helmholtz H. Treatise on Physiological Optics. Volume III. Courier Corporation; Chelmsford, MA, USA: 2013. p. 209. Translated from the Third German Edition Edited by James P. C. Southall.
    1. Gregory R.L. The Medawar Lecture 2001: Knowledge for Vision: Vision for Knowledge. Philos. Trans. R. Soc. B Biol. Sci. 2005;360:1231–1251. doi: 10.1098/rstb.2005.1662. - DOI - PMC - PubMed
    1. Bruner J.S., Postman L. Emotional selectivity in perception and reaction. J. Personal. 1947;16:69–77. doi: 10.1111/j.1467-6494.1947.tb01076.x. - DOI

LinkOut - more resources