. 2023 Feb 21;14(1):963.
doi: 10.1038/s41467-023-36603-z.

Parabrachial tachykinin1-expressing neurons involved in state-dependent breathing control

Affiliations

Parabrachial tachykinin1-expressing neurons involved in state-dependent breathing control

Joseph W Arthurs et al. Nat Commun. .

Abstract

Breathing is regulated automatically by neural circuits in the medulla to maintain homeostasis, but breathing is also modified by behavior and emotion. Mice have rapid breathing patterns that are unique to the awake state and distinct from those driven by automatic reflexes. Activation of medullary neurons that control automatic breathing does not reproduce these rapid breathing patterns. By manipulating transcriptionally defined neurons in the parabrachial nucleus, we identify a subset of neurons that express the Tac1, but not Calca, gene that exerts potent and precise conditional control of breathing in the awake, but not anesthetized, state via projections to the ventral intermediate reticular zone of the medulla. Activating these neurons drives breathing to frequencies that match the physiological maximum through mechanisms that differ from those that underlie the automatic control of breathing. We postulate that this circuit is important for the integration of breathing with state-dependent behaviors and emotions.


Conflict of interest statement

The authors declare no competing interests.

Figures
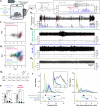
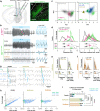
Fig. 1
Fig. 1. Rapid dynamic breathing patterns characterize the awake, normally behaving, state.
a Schematic of experimental setup and example plethysmograph recording showing quantified parameters. b Representative recordings from an awake freely behaving mouse breathing room air (b1), during near maximal chemoreflex stimulation with 10% O2; 5% CO2 (b2) or 10% CO2 (b3) and following transition to the anesthetized state with 1.5% isoflurane in room air (b4). Panels show plethysmograph pressure waveforms (top) and corresponding 3-breath moving average of breathing frequency (black) and breathing acceleration (violet). Magenta stars indicate breathing bouts that exceed 8 Hz. c PCA of breathing patterns generated spontaneously in the awake state (22,345 breaths from n = 6 mice). Magenta colored dots correspond to the onset (first 5 breaths) of rapid breathing bouts as shown in b1. d PCA of spontaneous, chemoreflex-driven, and anesthetized breathing patterns (d1; 67,579 breaths from n = 6 mice) and relative contributions of respiratory parameters to PCs 1 and 2 (D2). e Quantified average acceleration (left) and number of rapid breathing bouts per minute (right). n = 6; one-way RM ANOVA with Tukey’s multiple comparisons tests. f Probability density histograms (top) and mean values from each mouse (n = 6; bottom) comparing breathing frequencies (left) and peak inspiratory pressures (right) during each condition. Inset illustrates the rapid breathing frequencies (~8–12 Hz) that characterize the awake spontaneously breathing state. Breathing frequencies under spontaneous conditions were bimodal and were separated into “slow” and “fast” modes for analysis. One-way RM ANOVA with Tukey’s multiple comparisons tests. *p < 0.05; **p < 0.01; ***p < 0.001; ****p < 0.0001. Means±SE. Source data are provided as a Source Data file.
Fig. 2
Fig. 2. Peptidergic PBN subpopulations have opposing effects on breathing.
a Example RNAscope images illustrating partially overlapping Tac1, Calca, and Oprm1 populations in the PBL (a1) with Venn Diagram (a2) and table (a3) showing the estimated size of each subpopulation as a fraction of total PBL cells (n = 9839 cells analyzed from n = 3 mice). Green arrows in a1 and green box in a3 indicate Tac1 neurons that do not co-express Calca. Scale bars = 40 µm and 20 µm (zoomed). b Schematic of viral gene transfer approach (b1) and recombinase-dependent expression of ChR2:YFP in Tac1 (b2) or CGRP (b3) PBN neurons representative of n = 7 (Tac1) or n = 6 (CGRP) mice. Scale bar = 200 µm. scp superior cerebellar peduncle, Cbx cerebellar cortex. c Representative plethysmograph recordings from a mouse when awake (top) and lightly anesthetized with 1.5% isoflurane (bottom) during photoactivation of PBNTac1 neurons for 15 s at 30 Hz. Panels on right show overlay of 1 s of breathing with light OFF (black) and light ON (blue). d Same as c but during photoactivation of PBNCGRP neurons. Scale bars in c also apply to d. e PCA comparing spontaneous breathing patterns (22,351 breaths from n = 6 mice) to breathing patterns during photoactivation of PBNTac1 (3,507 breaths from n = 7 mice) and PBNCGRP (848 breaths from n = 6 mice) neurons. f Probability density histograms (top) and mean values from each mouse (bottom; n = 7 Tac1, n = 6 CGRP) comparing breathing frequencies and peak inspiratory pressures during photoactivation of Tac1 or CGRP PBN neurons. Tac1 and CGRP data were pooled for the light OFF condition shown in the probability density histograms. Light OFF and ON conditions and Tac1 vs. CGRP Light ON conditions were compared using two-tailed Wilcoxon matched pairs and Mann–Whitney tests, respectively. g Same as f but in the isoflurane anesthetized state (abscissa scaled to match f). *p < 0.05; **p < 0.01. Means±SE. Source data and statistical details provided in Source Data file.
Fig. 3
Fig. 3. PBN neurons that express Tac1 but not CGRP exert potent control of breathing that is state-dependent and respiratory phase-independent.
a Dual recombinase-dependent gene transfer approach to direct ChR2:YFP to neurons that express Tac1 but not CGRP (a1) and representative histology of viral expression (a2) in n = 7 mice. Scale bar = 200 µm. b Plethymography recordings comparing 30-Hz photostimulations (15 s) when all Tac1 neurons are targeted versus targeting of Tac1 neurons that do not co-express CGRP. Photostimulations were repeated following induction of isoflurane or urethane anesthesia. Overlays of breathing patterns during 1 s of light OFF (black) and light ON (blue) conditions shown on right. c PCA comparing spontaneous breathing patterns (22,351 breaths, n = 6 mice) to breathing patterns during photoactivation of PBNTac1 (3,507 breaths, n = 7 mice) and PBNTac1+; CGRP- (3755 breaths, n = 7 mice) neurons. d Probability-densities (top) and mean values from each mouse (bottom; n = 7 Tac1, n = 7 Tac1+; CGRP-) comparing breathing frequencies (left) and peak inspiratory pressures (right) during photostimulations. Tac1 and Tac1+; CGRP- data were pooled for the light OFF condition shown in the probability density histograms. Light OFF versus ON conditions and Tac1 versus CGRP Light ON conditions were compared using two-tailed Wilcoxon matched pairs and Mann–Whitney tests, respectively. e and f Same as d but in the isoflurane or urethane anesthetized state. g Breathing responses to 25-ms light pulses or sham stimulations delivered at different phases of the respiratory cycle in the awake or anesthetized state. h Plots showing the effects of brief photoactivations of PBNTac1+; CGRP- neurons on respiratory cycle length relative to the time of stimulation (abscissa and ordinate normalized to mean sham respiratory cycle length). Green and blue dots represent stimulations (n = 283 awake, n = 223 isoflurane, n = 160 urethane) occurring during inspiration or expiration, respectively; sham stimulations shown in light gray. i Latency from photostimulation to the onset of the next breath expressed as a % of sham stimulations during inspiration or expiration. Mixed effects model with Tukey’s multiple comparisons tests (n = 6 awake, n = 5 isoflurane, n = 4 urethane). *p < 0.05;  ***p < 0.001; ****p < 0.0001. Means ± SE. Source data and statistical details provided in Source Data file.
Fig. 4
Fig. 4. Tac1+; CGRP- PBN neurons exert precise temporal control of breathing throughout the maximum physiological range.
a Example plethysmograph recordings showing entrainment of the respiratory rhythm during 15-s photostimulations of Tac1+; CGRP- neurons at 6, 8, 10, or 12 Hz (a1). Traces are expanded in a2, and overlayed and averaged (bolded lines) in a3 to illustrate relative effects on TI and TE. b Average breathing frequency (replicates shown in light gray) before and during 15-s photostimulations of Tac1+; CGRP- PBN neurons at 6–14 Hz (n = 7 mice). c Cross-correlations of laser pulse and plethysmograph waveforms for data shown in b. Note optimal correlation and entrainment at 11 Hz stimulation frequency. d Probability density histograms of evoked breath frequencies during 6–14 Hz photostimulations relative to the light OFF condition (data pooled from all stimulation frequencies). e Average number of breaths per stimulation for each mouse (n = 7) relative to the stimulation frequency showing a near 1:1 relationship at 8–12 Hz. f Comparison of TI and TE of the evoked respiratory rhythm, and g comparison of maximum cross correlation and corresponding lag time relative to stimulation frequency (n = 7). Means ± SE. Source data and statistical details provided in Source Data file.
Fig. 5
Fig. 5. Tac1 PBN projections to the CeA and vIRt.
a Schematic of experimental approach using co-injection of AAV-DIO-YFP and AAV-DIO-synaptophysin:mCh to label PBNTac1 cell bodies and synapses, respectively. b Labeling of Tac1 neurons (YFP pseudocolored cyan) in the PBN and their synapses (synaptophysin:mCh pseudocolored magenta). c Labeling of Tac1 synapses in the CeA. d Labeling of Tac1 synapses in the vIRt. Scale bars = 500 µm for b1, c1, and d1. Panels to the right (b2, c2, d2-6) show 10X magnification and inverted grayscale images of synaptophysin:mCh for enhanced contrast. Scale bars = 200 µm. Sections in d2–6 are arranged rostral to caudal corresponding to ~−6.7 mm to −7.5 mm relative to Bregma. NA nucleus ambiguus. Images representative of n = 3 replicates.
Fig. 6
Fig. 6. State-dependent breathing control by Tac1+; CGRP- PBN neurons is mediated by direct projections to the ventral medulla.
a Approach to activate axon terminals of Tac1+; CGRP- PBN neurons in the CeA or vIRt. b Plethymograph recordings comparing 30-Hz photostimulations (15 s) of Tac1+; CGRP- terminals in the vIRt (top) or CeA (bottom) in the awake or anesthetized state. Panels on right show overlayed breathing patterns during 1 s of light OFF (black) and light ON (blue) conditions. c PCA comparing spontaneous breathing patterns (22,351 breaths, n = 6 mice) to breathing patterns during photoactivation of Tac1+; CGRP- projections to the vIRt (top; 3330 breaths, n = 5 mice) or CeA (bottom; 1966 breaths, n = 4 mice). d Probability densities and mean values from each mouse (n = 5 vIRt, n = 4 CeA) comparing breathing frequencies (top) and peak inspiratory pressures (bottom) during 30-Hz photostimulations. vIRt and CeA data were pooled for the light OFF condition shown in the probability density histograms. Light OFF versus ON conditions and vIRt versus CeA Light ON conditions were compared using two-tailed Wilcoxon matched pairs and Mann–Whitney tests, respectively. e Same as d but following induction of isoflurane anesthesia. f Plethysmograph recordings showing breathing responses to 25-ms photostimulations (or sham) of Tac1+; CGRP- projections in the vIRt (left) or CeA (right) at different phases of the respiratory cycle in an awake mouse. g Quantified effects of brief photoactivation of Tac1+; CGRP- projections from the PBN to the vIRt (top) and CeA (bottom) on respiratory cycle length relative to the time of stimulation (abscissa and ordinate normalized to mean sham respiratory cycle length). Individual stimulations of the vIRt (n = 245 awake, n = 225 isoflurane) or CeA (n = 176 awake, n = 198 isoflurane) during inspiration or expiration are represented by green and blue dots, respectively; sham stimulations are shown in light gray. h Latency from photstimulations to the onset of the next breath expressed as a % of sham stimulations in awake or isoflurane anesthetized mice. RM two-way ANOVA with Bonferroni’s multiple comparisons tests (n = 5 vIRt, n = 4 CeA). ****p < 0.0001. Means±SE. Source data and statistical details provided in Source Data file.

References

    1. Marder E, Bucher D. Central pattern generators and the control of rhythmic movements. Curr. Biol. 2001;11:R986–996. doi: 10.1016/S0960-9822(01)00581-4. - DOI - PubMed
    1. Marder E, Calabrese RL. Principles of rhythmic motor pattern generation. Physiol. Rev. 1996;76:687–717. doi: 10.1152/physrev.1996.76.3.687. - DOI - PubMed
    1. Ashhad S, Kam K, Del Negro CA, Feldman JL. Breathing rhythm and pattern and their influence on emotion. Annu. Rev. Neurosci. 2022;45:223–247. doi: 10.1146/annurev-neuro-090121-014424. - DOI - PMC - PubMed
    1. Boiten FA, Frijda NH, Wientjes CJ. Emotions and respiratory patterns: review and critical analysis. Int. J. Psychophysiol. 1994;17:103–128. doi: 10.1016/0167-8760(94)90027-2. - DOI - PubMed
    1. Homma I, Masaoka Y. Breathing rhythms and emotions. Exp. Physiol. 2008;93:1011–1021. doi: 10.1113/expphysiol.2008.042424. - DOI - PubMed

Publication types

LinkOut - more resources