. 2023 Feb 21;14(1):906.
doi: 10.1038/s41467-023-36484-2.

Sugar transporter Slc37a2 regulates bone metabolism in mice via a tubular lysosomal network in osteoclasts

Affiliations

Sugar transporter Slc37a2 regulates bone metabolism in mice via a tubular lysosomal network in osteoclasts

Pei Ying Ng et al. Nat Commun. .

Abstract

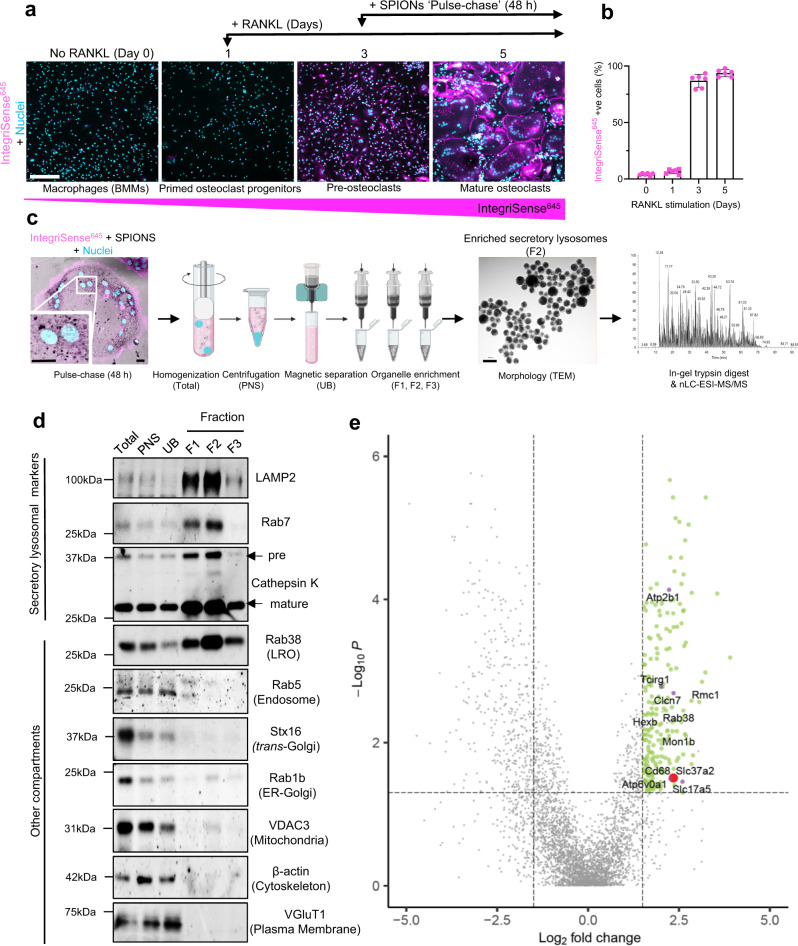
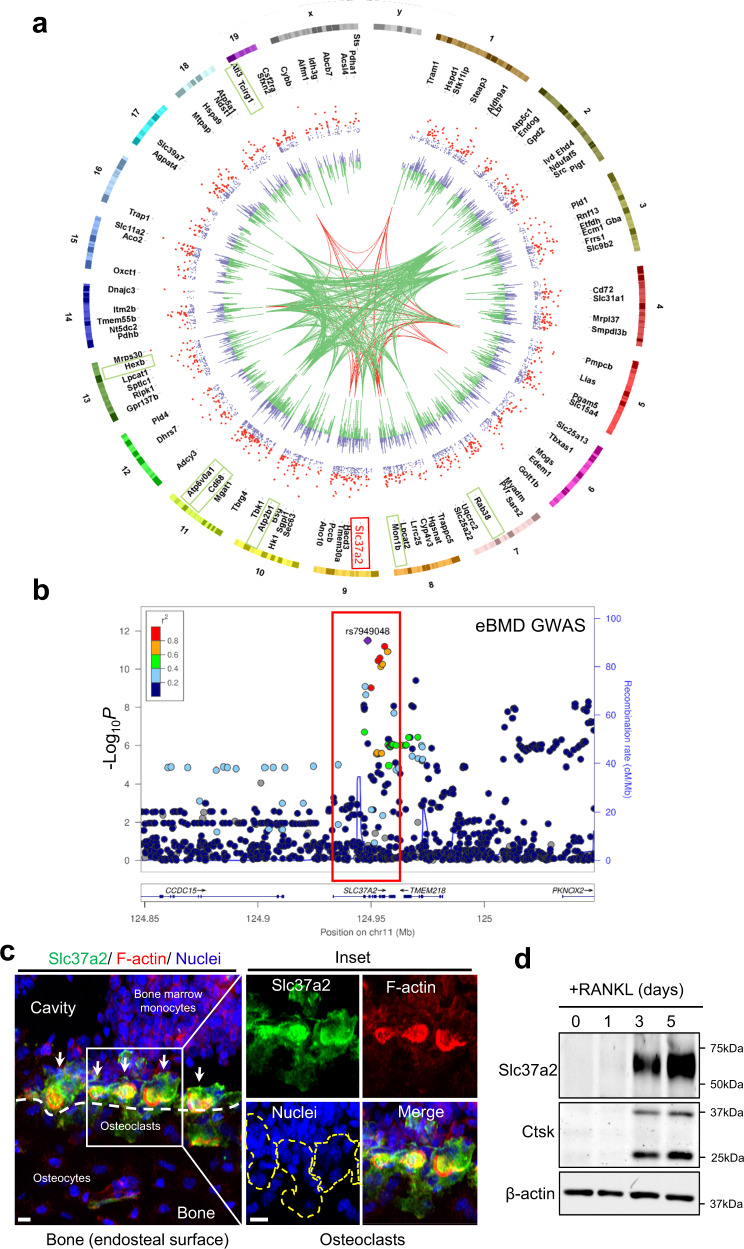
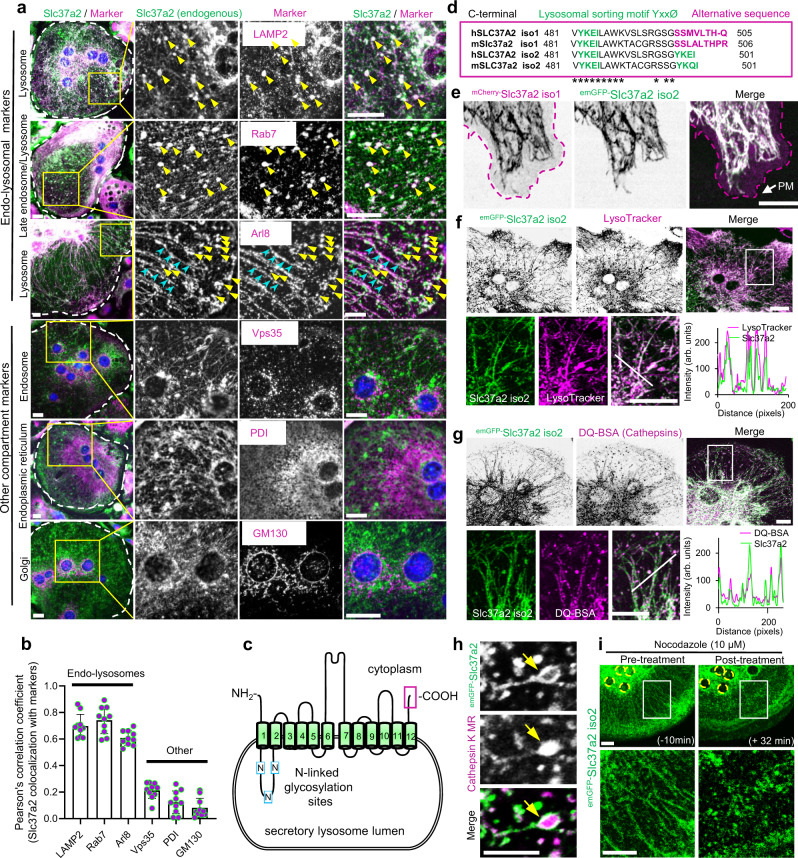
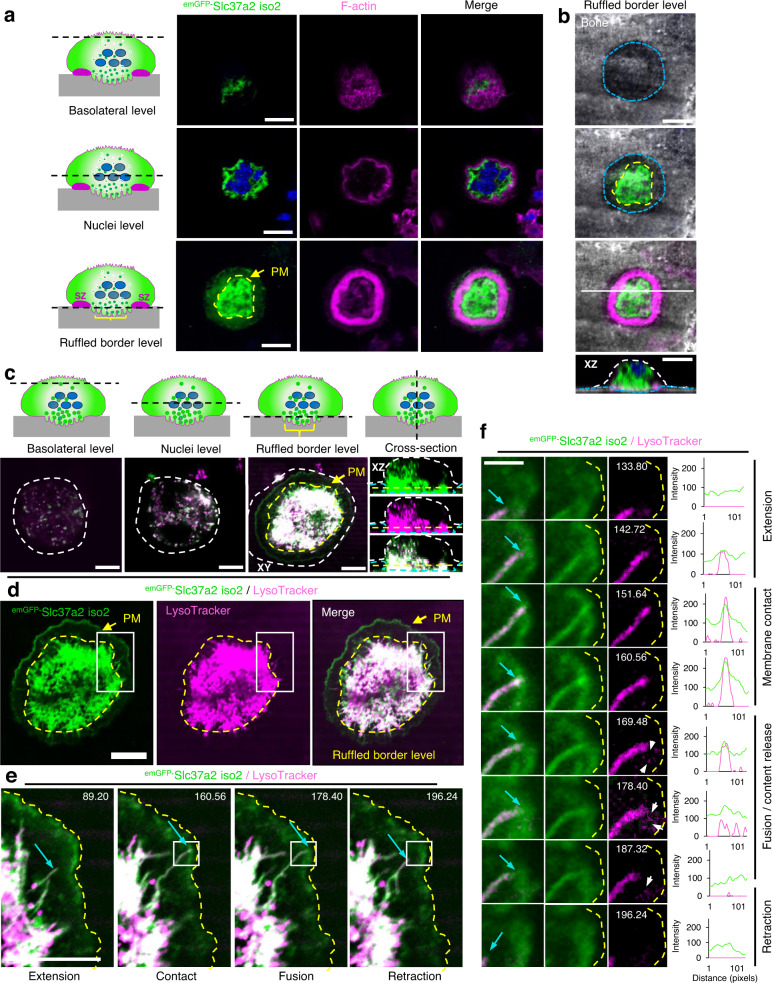
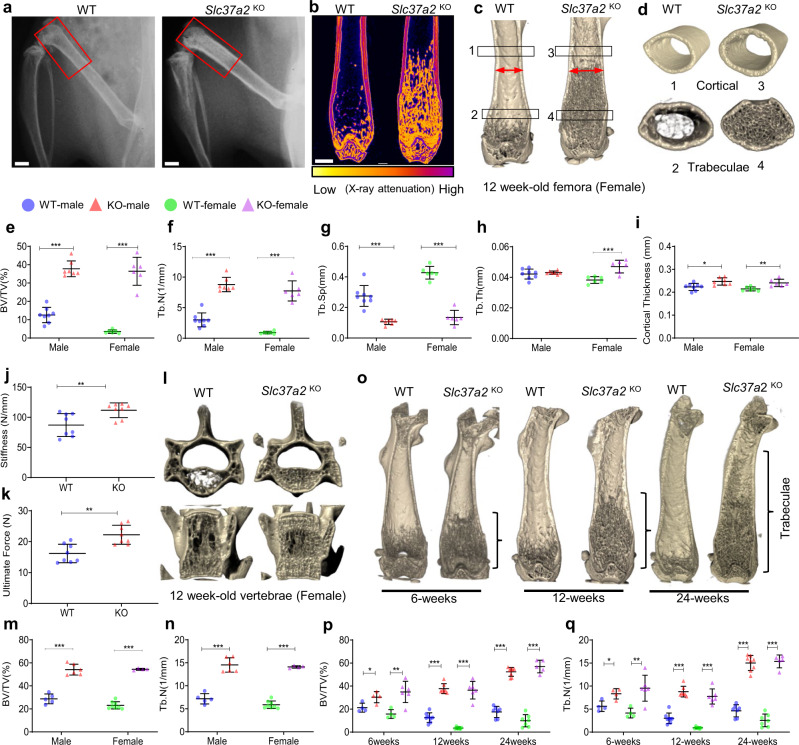
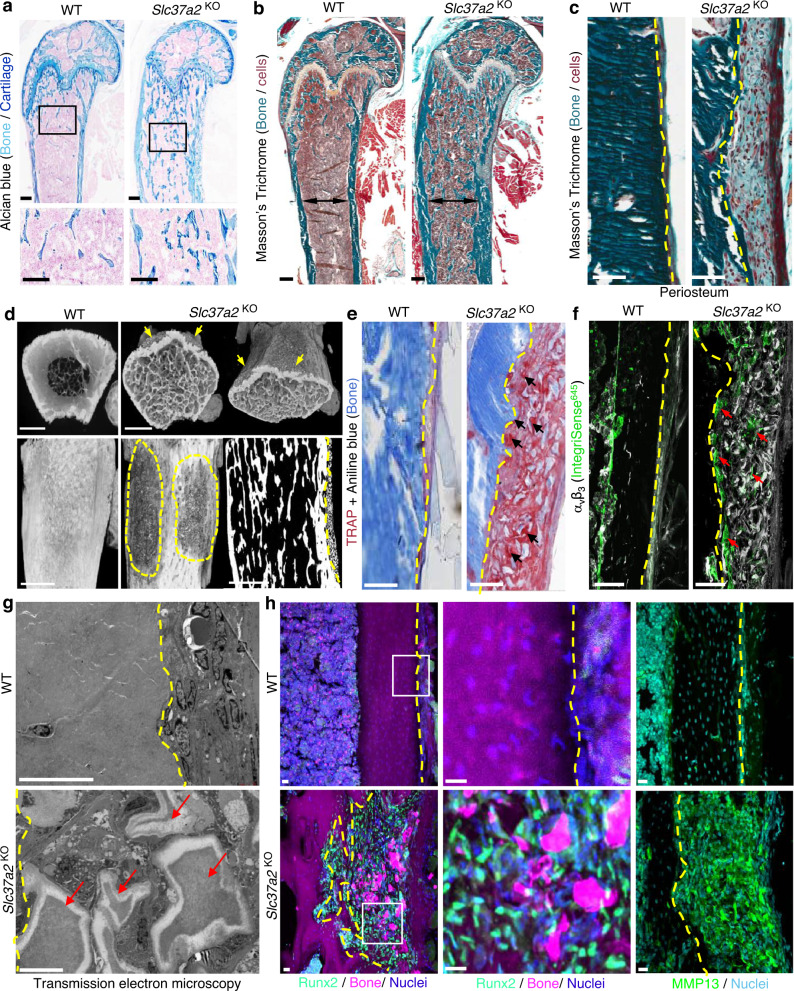
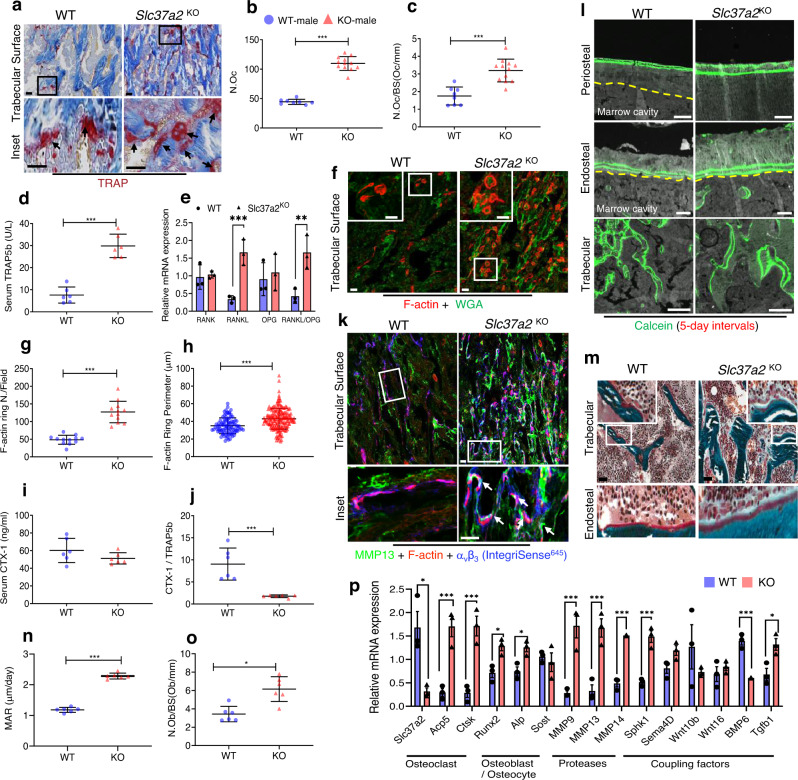
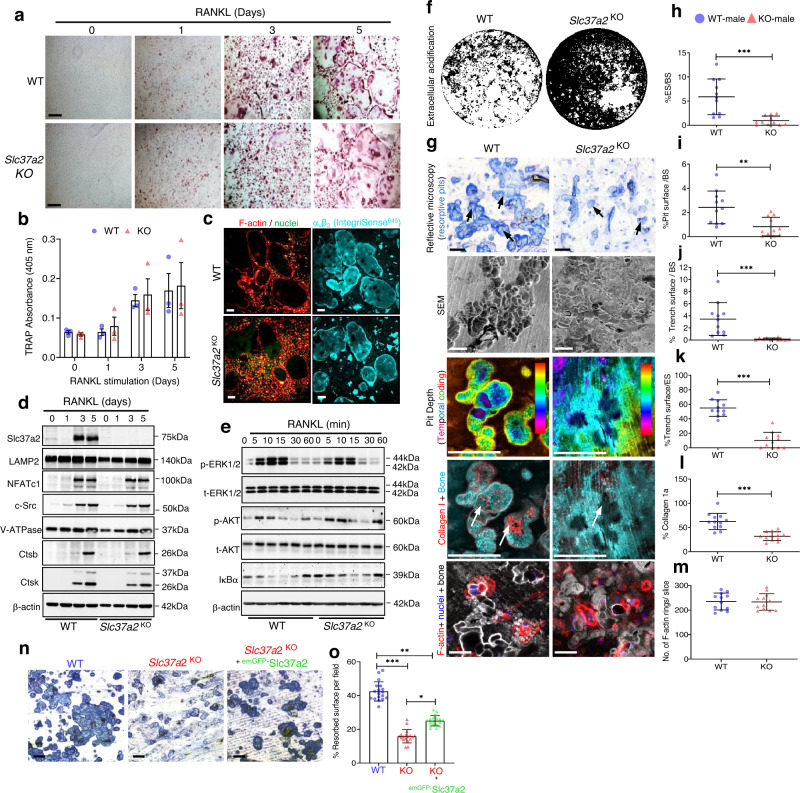
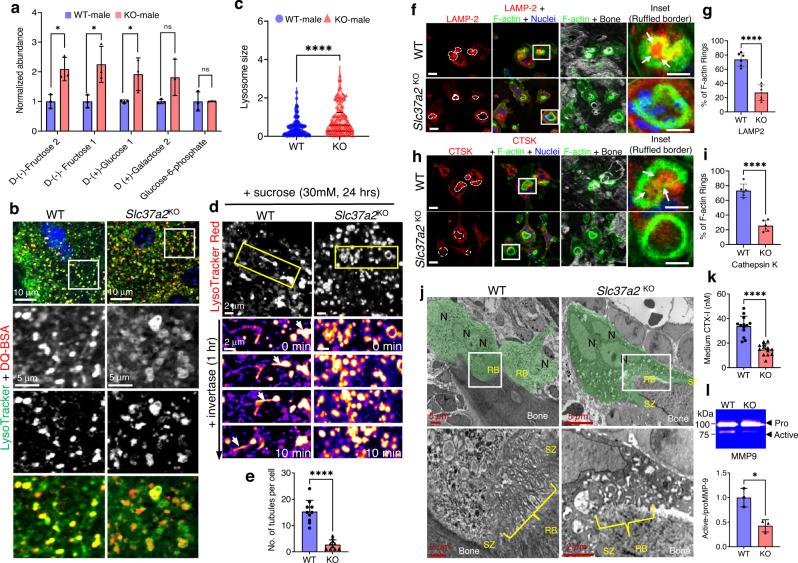
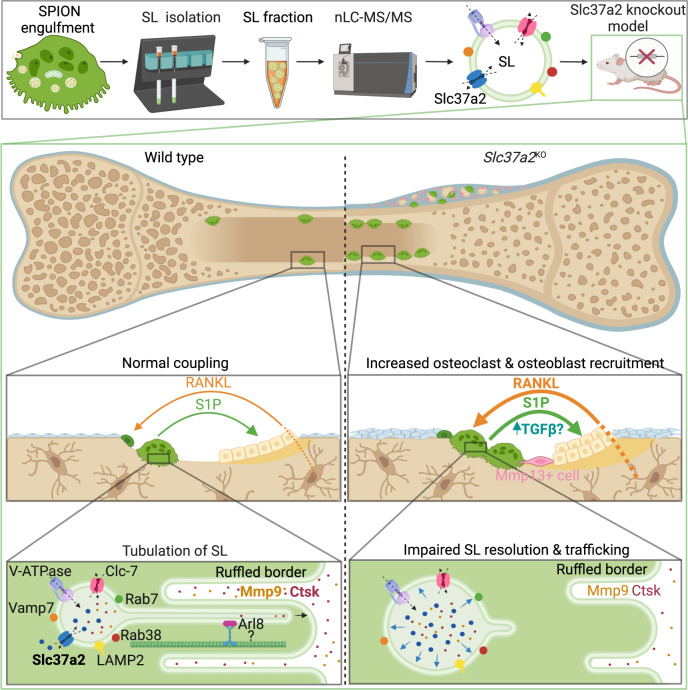
Osteoclasts are giant bone-digesting cells that harbor specialized lysosome-related organelles termed secretory lysosomes (SLs). SLs store cathepsin K and serve as a membrane precursor to the ruffled border, the osteoclast's 'resorptive apparatus'. Yet, the molecular composition and spatiotemporal organization of SLs remains incompletely understood. Here, using organelle-resolution proteomics, we identify member a2 of the solute carrier 37 family (Slc37a2) as a SL sugar transporter. We demonstrate in mice that Slc37a2 localizes to the SL limiting membrane and that these organelles adopt a hitherto unnoticed but dynamic tubular network in living osteoclasts that is required for bone digestion. Accordingly, mice lacking Slc37a2 accrue high bone mass owing to uncoupled bone metabolism and disturbances in SL export of monosaccharide sugars, a prerequisite for SL delivery to the bone-lining osteoclast plasma membrane. Thus, Slc37a2 is a physiological component of the osteoclast's unique secretory organelle and a potential therapeutic target for metabolic bone diseases.


Conflict of interest statement

The authors declare no competing interests.

Figures

Fig. 1
Fig. 1. Proteomic analysis of enriched osteoclast secretory lysosomes identifies Slc37a2.
a Experimental setup for SPION ‘pulse-chase’ and representative confocal images of mouse bone marrow monocyte (BMMs) differentiation into mature αvβ3-integrin-positive (IntegriSense645) osteoclasts following RANKL stimulation. Bar 150 µm. b Quantitation of IntegriSense645 positive cells during RANKL stimulation (n = 3 biologically independent cells from 2 experiments). Data are presented as mean percentage (%) ± SD. c Schema of the SPION-based SL enrichment method, validation, and proteomic analysis. Created with BioRender.com. d Immunoblotting for protein markers of various subcellular compartments in whole-cell homogenates (H), post-nuclear supernatant (PNS), magnetic column flow-through (UB), and enriched SL fractions (F1–F3) (n = 3). LRO lysosome-related organelle. e Volcano plot depicting the difference between proteins in whole cell homogenates and secretory lysosomes (SLs) (n = 3, P > 0.05, ANOVA, Benjamini–Hochberg adjusted). The top 218 proteins up-regulated in the lysosomal fractions are shown in green (FC > 1.5, P < 0.05) with the top 6 membrane transporters colored in purple and Slc37a2 highlighted in red.
Fig. 2
Fig. 2. Slc37a2 is a candidate regulator of human bone mass and is highly expressed in mature osteoclasts.
a CIRCOS plot displaying mouse chromosomes, gene names for the top 218 proteins up-regulated in the SL fractions, scatterplot representing protein abundance ratio (secretory lysososomes (SLs)/homogenate) adjusted P values (purple) with significant associations (P < 0.05) colored red, histogram representing Log2FC abundance values for each protein SLs/homogenate purple (+ve), green (−ve), gene groupings representing human homologs associated with eBMD at P < 6.6E−9 (green) and P < 5E−20 (red). Protein abundance ratio adjusted P values (ANOVA, Benjamini–Hochberg) are displayed as −Log10P values. Red box denotes Slc37a2 and green boxes other notable genes. b Regional association plots for the human SLC37A2 gene (red box) generated using estimated bone mineral density (eBMD) GWAS association results. Genetic variants within 100 kb of the lead variant (rs7949048, purple) are depicted (x-axis) along with their eBMD P value (–Log10) generated using a linear mixed non-infinitesimal model (LMM). c Slc37a2 expression in the femur of 12-week-old male WT mice by immunohistochemistry. Arrows indicate osteoclasts and a dashed line defines bone (white) and osteoclast (yellow) surfaces. Bars, 10 μm (n = 3). d Slc37a2 expression during in vitro osteoclast differentiation of bone marrow monocytes (BMMs) by immunoblotting. Cathepsin K (Ctsk) and β-actin served as controls (n = 3). Source data are provided as a Source Data file.
Fig. 3
Fig. 3. Slc37a2 localizes to a network of tubular secretory lysosomes.
a Endogenous localization of Slc37a2 in mouse bone marrow monocyte (BMM)-derived osteoclasts. Slc37a2 co-localizes with late endo-lysosomal markers (LAMP2, Rab7, and Arl8), but not with endosomes (Vps35), the endoplasmic reticulum (PDI) or the Golgi (GM130). Bar, 10 µm. b Pearson’s correlation coefficient (Rr) calculated from 10 osteoclasts pooled from two independent experiments. Data are presented as means ± SD. c Schematic of Slc37a2 structure and topology on SL membranes, with transmembrane (green cylinders), luminal cytosolic domains (black lines), N-linked glycosylation sites (blue boxes, N), and extreme C-terminus (magenta box) indicated. d Amino acid alignment of the far C-terminus for human SLC37A2 and mouse Slc37a2 isoforms (1 and 2) with lysosomal sorting motifs and alternative sequences indicated. Asterisks indicate conserved amino acids. e Confocal image of a mouse osteoclast cultured on glass co-microinjected with mCherry-Slc37a2 isoform 1 and emGFP-Slc37a2 isoform 2. Purple dashed line outlines the plasma membrane (PM). Bar, 10 µm (n = 5). f and g Representative confocal image of a live mouse osteoclast on glass microinjected with emGFP-Slc37a2 isoform 2 and pulsed with endolysosomal probes LysoTracker Red (f, n = 3) or DQ-BSA (g, n = 3). Line scans of the individual fluorescent intensities (arbitrary units, arb. units) correspond to the white diagonal line in the magnified views. Bars, 10 µm. h High-resolution live confocal image of a representative tubular SL bearing emGFP-Slc37a2 isoform 2 and housing Cathepsin K Magic Red (MR) within its lumen (yellow arrow). Bar, 2 µm. (n = 3). i Time-lapse confocal image of an osteoclast expressing emGFP-Slc37a2 isoform 2 before (−10 min) and after (+32 min) treatment with the microtubule disrupting agent nocodazole (10 µM). Bar, 10 µm (n = 3). Source data are available in the Source Data file. See also related Supplementary Movies 1–3.
Fig. 4
Fig. 4. emGFP-Slc37a2+ tubules orientate towards the ruffled border and fuse with the bone-apposed plasma membrane.
a and b Multilevel confocal images of a mouse osteoclast cultured on bone expressing emGFP-Slc37a2 isoform 2 and stained with rhodamine-phalloidin to indicate the F-actin ring and underlying ruffled border. Representative XY serial confocal sections depict emGFP-Slc37a2 distribution at the basolateral, nuclear (blue), and ruffled border level(s) (n = 3). XZ denotes the side view corresponding to the white horizontal line in the merged panel. Dashed lines indicate ruffled border regions within sealing zones (yellow), resorptive pit (blue) and cell border (white). Bars 10 µm. c Multilevel XY and XZ confocal images of a live osteoclast cultured on bone expressing emGFP-Slc37a2 isoform 2 and labeled with LysoTracker Red. Dashed lines denote the plasma membrane (PM, white), sealing zone (yellow), and bone surface (blue). Bars, 10 µm. (n = 3). d Bottom-up view of the ruffled border level with the sealing zone denoted by the yellow dashed line. Bar, 10 µm. (n = 3). e and f Magnified regions of a time-lapse series illustrating extension, membrane contact, transient fusion, and retraction of an emGFP-Slc37a2+ tubule (blue arrow) with the bone-lining plasma membrane (yellow dashed line), with time points, indicated. White arrows highlight content release/exocytosis indicative of tubule fusion with the PM as confirmed by corresponding signal intensities in fluorescence line scans intensities (arbitrary units). Bar, 2 µm. (n = 2). Osteoclast cartoons depicted in panels a and c are adapted from ref. . See also related Supplementary Movies 4, 5.
Fig. 5
Fig. 5. Slc37a2KO exhibits high bone mass and increased bone strength.
a Radiography of the hindlimbs of 12-week-old female WT and Slc37a2KO mice. Bar, 1 mm. b–d Representative sagittal µCT section false-colored to indicate X-ray attenuation (b) and µCT 3D reconstructed images of sagittal (c) and transverse (d) sections of distal femurs of 12-week-old female WT and Slc37a2KO mice. e–i µCT analysis of femurs of 12-week-old male and female WT (n = 8 male and 6 female) and Slc37a2KO (n = 7 male and 6 female) mice. e Male P < 0.0001 and female P < 0.0001. f Male P < 0.0001 and female P < 0.0001. g Male P < 0.0001 and female P < 0.0001. h Male P = 0.7874, female P < 0.0001. i Male P = 0.0114, female P = 0.0053. j and k Biomechanical three-point bending test of 12-week-old male WT and Slc37a2KO femurs. Stiffness (j, P = 0.0083) and ultimate force (k, P = 0.0013) are presented (n = 8 mice per genotype). l–n Representative µCT images of vertebrae (l) and µCT analysis of vertebrae (m and n) of 12-week-old male and female WT (n = 5 male and 8 female) and Slc37a2KO (n = 6 male and 4 female) mice. m Male P < 0.0001 and female P < 0.0001, n male P < 0.0001 and female P < 0.0001. o–q Representative µCT images of female femurs (o) and µCT analysis of femurs (p and q) of 6-, 12- and 24-week-old male and female WT (6-weeks n = 4 male and 4 female; 12-weeks n = 8 male and 6 female; 24-weeks n = 7 male and 7 female) and Slc37a2KO (6-weeks n = 4 male and 6 female; 12-weeks n = 7 male and 6 female; 24-weeks n = 8 male and 5 female) mice. p 6-weeks male P = 0.026112, female P = 0.004736; 12-weeks male P < 0.0001, female P < 0.0001; 24-weeks male P < 0.0001, female P < 0.0001). q 6-weeks male P = 0.014847, female P = 0.006968; 12-weeks male P < 0.0001, female P < 0.0001; 24-weeks male P < 0.0001, female P < 0.0001). All data are presented as means ± SD. *P < 0.05, **P < 0.01, ***P < 0.001, by two-tailed unpaired Student’s t-test. Source data are available in the Source Data file.
Fig. 6
Fig. 6. Slc37a2KO mice exhibit high bone mass and a periosteal bone lesion.
a Representative histological images of Alcian blue staining of the distal femur of 12-week-old female WT and Slc37a2KO mice (n = 5), Bars, 0.1 mm. b and c Mason’s Trichome staining of femurs from 12-week-old female WT and Slc37a2KO mice (b, n = 3) and representative images of the periosteal surface along the metaphyseal–diaphyseal junction (c, n = 3). Black double arrows indicate maximal femoral diameter and dashed lines indicate the periosteal bone surface. Bars, 1 mm. d High-resolution µCT images of 12-week-old female WT and Slc37a2KO femurs indicating the periosteal lesions (arrows and dashed outlines) (n = 2). Bars, 1 mm. e and f Histological evaluation of TRAP+ (e, n = 3) and αvβ3+ (f, n = 3) cells along the periosteal surface of 12-week-old femurs from female WT and Slc37a2KO mice. Dashed lines denote the periosteal bone surface, arrows indicate TRAP+ or αvβ3+ cells. Bars, 1 mm. g Transmission electron microscopic evaluation of the periosteal layer of femurs from WT and Slc37a2KO(n = 2). Dashed yellow lines indicate the periosteal bone surface. Red arrows depict demineralized bone/cartilaginous fragments. Bars, 10 µm. h Representative images of cryosections depicting the periosteal surface along the femurs of 12-week-old female WT and Slc37a2KO mice immunostained for Runx2 or MMP13 (n = 4). Bars, 20 µm.
Fig. 7
Fig. 7. Slc37a2 deletion impairs bone resorption leading to compensatory increases in osteoclastogenesis, protease expression, and osteoblast-mediated bone formation.
a Representative images of the primary spongiosa of proximal WT and Slc37a2KO male femora stained for TRAP and b, c histomorphometric analysis of TRAP+ osteoclasts (n = 8 WT and 12 Slc37a2KO animals per group) (b P < 0.001; c P < 0.001). Bar, 50 μm. d Serum TRAP5b levels (n = 6 animals per genotype, P < 0.001) and e RANK/RANKL/OPG mRNA expression in femurs (n = 3 animals per genotype, RANK P = 0.750121; RANKL P = 0.003713; OPG P = 0.658277; RANKL/OPG P = 0.014159) of 12-week-old male WT and Slc37a2KO mice. fh Confocal images of representative femur cryosections stained for F-actin and Wheat-germ agglutinin, (WGA) from 12-week-old male mice (f) and quantitation of F-actin numbers (g, n = 12 fields/group P < 0.001) and diameters (h, n = 92 cells/5 independent WT samples and 192 cells/9 independent Slc37a2KOsamples, P < 0.001). Bars 50 μm. i CTX-1 levels (n = 6, P = 0.1815) and j ratio of CTX-1/TRAP5b levels in serum of 12-week-old male WT and Slc37a2KO mice (n = 6, P = 0.0006). k Representative confocal image of the primary spongiosa of WT and Slc37a2KO male femora immunostained for MMP13, F-actin and αvβ3 (IntegriSense645). Arrows indicate flat bone-lining MMP13+ cells occupying resorptive lacunae in magnified images. Bars 50 μm. lo Representative images of 12-week-old male femurs from WT and Slc37a2KO mice depicting fluorescent calcein-double labeling (l, Bars, 100 µm), Mason’s Trichrome staining (m, Bars, 100 μm) and histomorphometric analyses of bone mineral apposition rate (n, n = 6, P < 0.001) and osteoblast numbers/ bone surface (o, n = 6, P = 0.0186). p Relative mRNA expression in femora from 12-week-old WT and Slc37a2KO mice (n = 3). Slc37a2 P = 0.017655; Acp5 P = 0.003896; Ctsk P = 0.003602; Runx2 P = 0.016348; Alp P = 0.018260; MMP9 P = 0.005514; MMP13 P = 0.004579; MMP14 P = 0.000163; Sphk1 P = 0.001930; BMP6 P = 0.000829; Tgfb1 P = 0.023799. All data are presented as means ± SD. *P < 0.05, ** P < 0.01, ***P < 0.001 by two-tailed unpaired Student’s t tests. Source data are available in the Source Data file.
Fig. 8
Fig. 8. Slc37a2 deletion impairs bone resorption but does not alter osteoclast differentiation, spreading, or RANKL-signaling cascades.
a and b WT and Slc37a2KO BMM-derived osteoclasts were TRAP stained (a), and TRAP activity measured (405 nm) (b) (n = 3). Bar, 50 µm. c Representative images of WT and Slc37a2KO osteoclasts immunostained for F-actin, αvβ3 (IntegriSense645) and nuclei. Bar 50 µm. d Expression of osteoclast and SL markers during RANKL-induced differentiation of WT and Slc37a2KO BMMs by immunoblotting using indicated antibodies (n = 3). e RANKL-signaling in WT and Slc37a2KO BMMs. Immunoblotting of the levels and phosphorylation states of ERK1/2, AKT, and IκBα in response to RANKL (n = 3). f Representative Von Kossa staining of WT and Slc37a2KO osteoclasts on mineralized substrates (n = 3). g–m Representative images of in vitro bone resorption assays of WT and Slc37a2KO osteoclasts using reflective microscopy, SEM, and confocal microscopy with quantification of the percentage of eroded surface (h, n = 11 bone discs from 3 experiments; P = 0.0004), pit area (i, n = 11 bone discs from 3 experiments; P = 0.0029), trench surface per bone slice (j, n = 11 bone discs from 3 experiments; P = 0.0006), trench surface/eroded surface (k, n = 11 bone discs from 3 experiments; P < 0.0001), collagen1a staining (l, n = 12 bone discs from 3 experiments; P < 0.0001) and a number of F-actin rings per bone slice (m, n = 12 bone discs from 3 experiments; P = 0.9293). Black and white arrows indicate bone resorption pits in toluidine blue and collagen 1 stained bone slices, respectively. Bars, 50 µm. n and o Rescue of Slc37a2KO osteoclasts activity by lentiviral transduction of emGFP-Slc37a2. Depicted are representative images of toluidine blue stained resorptive pits of WT, Slc37a2KO, and emGFP-Slc37a2 transduced Slc37a2KO osteoclasts with quantification of the percentage resorbed surface per field quantified (n = 54 fields from 3 experiments, WT vs. Slc37a2KO P < 0.0001; WT vs. emGFP-Slc37a2KO P = 0.0011; Slc37a2KO vs. emGFP-Slc37a2KO P = 0.0250). All data are presented as means ± SD. * P < 0.05, ** P < 0.01, *** P < 0.001 by two-tailed unpaired Student’s t-test (hm) or nested one-way ANOVA (o). Bar, 50 µm. Source data are available in the Source Data file.
Fig. 9
Fig. 9. Export of monosaccharides and delivery of SLs to the ruffled border is impaired Slc37a2KO osteoclasts.
a Quantitative metabolomics profiling of monosaccharide sugars in BMM-derived osteoclasts from WT and Slc37a2KO mice (n = 3; d-(−)-Fructose 2 P = 0.014536; d-(−)-Fructose 1 P = 0.028321; d-(+)-Glucose 1 P = 0.046169). b and c Representative confocal images of WT and Slc37a2KO osteoclasts stained with LysoTracker Green and DQ-BSA (b) and quantitation of SL size (c) (n = 109 SLs pooled from 10 cells per group, P < 0.0001). d Time-lapse confocal image series of WT and Slc37a2KO osteoclasts cultured in high sucrose conditions (30 mM, 24 h) to induce sucrosome formation and imaged for 10 min post-treatment with invertase (0.5 mg/ml, 1 h). SLs were pulsed with LysoTracker Red prior to imaging. Arrows track an SL resolution and tubulation event. e Number of tubules per cell post-treatment with invertase (n = 10 cells, P < 0.0001). f–i Confocal images of WT and Slc37a2KO osteoclasts cultured on bone and immunostained for F-actin in combination with either LAMP-2 (f, Bars, 10 μm) or cathepsin k (CTSK) (h, Bars, 10 μm) and quantitation (g, P < 0.0001; i, P < 0.0001). Arrows indicate delivery of LAMP2 and CTSK within F-actin rings (n = 6). j Representative TEM micrographs of WT and Slc37a2KO osteoclasts (green) lining trabecular bone surfaces within the primary spongiosa of 5-day-old male littermates (n = 3). Magnified pictures illustrate ruffled borders (RB). N nuclei, SZ sealing zone. k, l CTX-1 and active MMP9 levels in media from cultures of bone-resorbing WT and Slc37a2KO osteoclasts as monitored by ELISA (k) and gel zymography (l). n = 13, P < 0.0001 (k) and n = 3, P = 0.0117 (l). Data are presented as means ± SD *P < 0.05 and ****P < 0.0001 by two-tailed unpaired Student’s t-test. Source data are available in the Source Data file. See also related Supplementary Movie 6.
Fig. 10
Fig. 10. Working model of Slc37a2 in osteoclast function and bone metabolism.
Top panel provides an overview of proteomic identification of sugar transporter Slc37a2 on osteoclast secretory lysosomes, the middle panels highlight tissue level alterations in osteoclast–osteoblast coupling during bone remodeling in Slc37a2-deficient mice and the bottom panel illustrates the proposed role for Slc37a2 in the regulation of sugar export from secretory lysosomes, a prerequisite for secretory lysosome resolution, membrane tubulation and delivery to the osteoclast ruffled border. Created with BioRender.com.

References

    1. Zaidi M. Skeletal remodeling in health and disease. Nat. Med. 2007;13:791–801. doi: 10.1038/nm1593. - DOI - PubMed
    1. Teitelbaum SL, Ross FP. Genetic regulation of osteoclast development and function. Nat. Rev. Genet. 2003;4:638–649. doi: 10.1038/nrg1122. - DOI - PubMed
    1. Cappariello A, Maurizi A, Veeriah V, Teti A. The great beauty of the osteoclast. Arch. Biochem. Biophys. 2014;558:70–78. doi: 10.1016/j.abb.2014.06.017. - DOI - PubMed
    1. Stenbeck G. Formation and function of the ruffled border in osteoclasts. Semin. Cell Dev. Biol. 2002;13:285–292. doi: 10.1016/S1084952102000587. - DOI - PubMed
    1. Baron R, et al. Polarized secretion of lysosomal enzymes: co-distribution of cation-independent mannose-6-phosphate receptors and lysosomal enzymes along the osteoclast exocytic pathway. J. Cell Biol. 1988;106:1863–1872. doi: 10.1083/jcb.106.6.1863. - DOI - PMC - PubMed

Publication types