

Phosphatidic acid-regulated SOS2 controls sodium and potassium homeostasis in Arabidopsis under salt stress
- PMID: 36811145
- PMCID: PMC10106984
- DOI: 10.15252/embj.2022112401
Phosphatidic acid-regulated SOS2 controls sodium and potassium homeostasis in Arabidopsis under salt stress
Abstract
The maintenance of sodium/potassium (Na+ /K+ ) homeostasis in plant cells is essential for salt tolerance. Plants export excess Na+ out of cells mainly through the Salt Overly Sensitive (SOS) pathway, activated by a calcium signal; however, it is unknown whether other signals regulate the SOS pathway and how K+ uptake is regulated under salt stress. Phosphatidic acid (PA) is emerging as a lipid signaling molecule that modulates cellular processes in development and the response to stimuli. Here, we show that PA binds to the residue Lys57 in SOS2, a core member of the SOS pathway, under salt stress, promoting the activity and plasma membrane localization of SOS2, which activates the Na+ /H+ antiporter SOS1 to promote the Na+ efflux. In addition, we reveal that PA promotes the phosphorylation of SOS3-like calcium-binding protein 8 (SCaBP8) by SOS2 under salt stress, which attenuates the SCaBP8-mediated inhibition of Arabidopsis K+ transporter 1 (AKT1), an inward-rectifying K+ channel. These findings suggest that PA regulates the SOS pathway and AKT1 activity under salt stress, promoting Na+ efflux and K+ influx to maintain Na+ /K+ homeostasis.
Keywords: AKT; SOS pathway; phosphatidic acid; salt stress; sodium and potassium homeostasis.
© 2023 The Authors.
Conflict of interest statement
The authors declare that they have no conflict of interest.
Figures
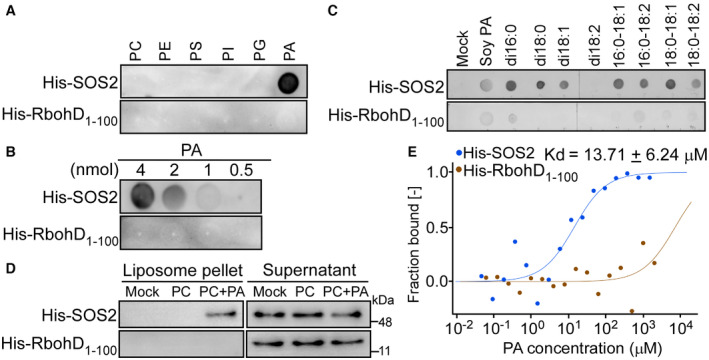
Lipid dot‐blot screen assays between the recombinant protein His‐SOS2 and different lipids. His‐SOS2 was extracted and purified from E. coli. The amount of each lipid spot is 5 nmol. PC, phosphatidylcholine; PE, phosphatidylethanolamine; PS, phosphatidylserine; PI, phosphatidylinositol; PG, phosphatidylglycerol. His‐RbohD1–100 was used as a negative control. SOS2 was detected by immunoblot using anti‐His antibody.
Dose‐dependent binding of His‐SOS2 to PA.
The binding of His‐SOS2 to different PA species. The amount of each PA spot is 5 nmol. PA species: natural PA from soy, dipalmitoyl PA (di16:0 PA), distearoyl PA (di18:0 PA), dioleoyl PA (di18:1 PA), dilinoleoyl PA (di18:2 PA), palmitoyl‐oleoyl PA (16:0–18:1 PA), palmitoyl‐linoleoyl PA (16:0–18:2 PA), stearoyl‐oleoyl PA (18:0–18:1 PA), and stearoyl‐linoleoyl PA (18:0–18:2 PA). For mock control, no PA was incubated with the proteins.
The His‐SOS2 binding to the liposome‐containing PA. Liposomes were made up of 16:0–18:2 PC only or the mixtures of 16:0–18:2 PC + 16:0–18:2 PA. After incubation with the recombinant proteins, liposomes were pelleted by centrifugation. The liposome‐conjugated proteins in pellet and proteins remaining in supernatant were detected by immunoblot using anti‐His antibody. For the mock control, no liposomes were incubated with the proteins.
Microscale thermophoresis (MST) assay between His‐SOS2 and PA. His‐SOS2 was labeled and kept at a constant concentration (1.0 μM). His‐RbohD1‐100, as the negative control, was labeled and kept at a constant concentration (4.5 μM). PA was hydrated in TBST buffer (0.005% Tween 20) and diluted 16 times in a 1:1 ratio.
- A
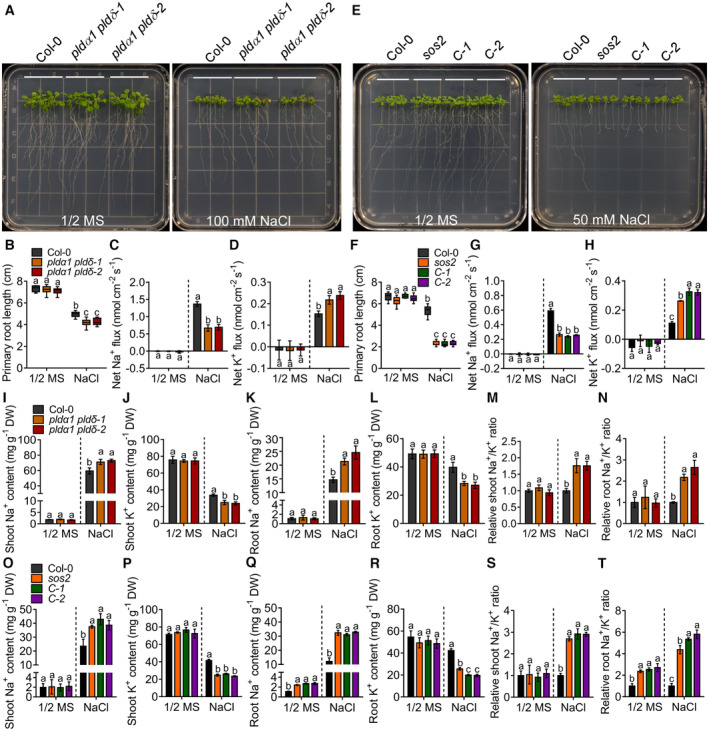
The PA synthesis of defective mutants pldα1 pldδ‐1 and pldα1 pldδ‐2 are salt sensitive. Six‐day‐old seedlings were grown in half‐strength Murashige and Skoog (MS), and then transferred to half‐strength MS medium with or without 100 mM NaCl for 7 days.
- B
Analysis of primary root length, related to Fig 2A.
- C, D
Analysis of the average values of the net Na+ (C) and K+ (D) fluxes of Col‐0 and pldα1 pldδ. Six‐day‐old seedlings were treated with or without 100 mM NaCl for 24 h. Error bars represent SD (n ≥ 3).
- E
PA positively regulates salt tolerance through SOS2. The mutants sos2, C‐1, and C‐2 represent CRISPR‐Cas9‐induced mutation of SOS2 in Col‐0, pldα1 pldδ‐1, and pldα1 pldδ‐2 backgrounds, respectively. Six‐day‐old seedlings were treated with or without 50 mM NaCl for 7 days.
- F
Analysis for primary root length, related to Fig 2E.
- G, H
Analysis of the average values of the net Na+ (G) and K+ (H) fluxes of Col‐0, sos2, C‐1, and C‐2. Six‐day‐old seedlings were treated with or without 50 mM NaCl for 24 h. Error bars represent SD (n ≥ 3).
- I–N
The contents of shoot Na+ (I), shoot K+ (J), root Na+ (K), and root K+ (L) as well as the relative ratios of shoot Na+/K+ (M) and root Na+/K+ (N) of Col‐0 and pldα1 pldδ mutants. Six‐day‐old seedlings were transferred to half‐strength MS medium with or without 100 mM NaCl treatment for 7 days. Error bars represent SEM of three independent biological repeats.
- O–T
The contents of shoot Na+ (O), shoot K+ (P), root Na+ (Q), and root K+ (R) as well as the relative ratios of shoot Na+/K+ (S) and root Na+/K+ (T) of Col‐0, sos2, C‐1, and C‐2 mutants. Six‐day‐old seedlings were transferred to half‐strength MS medium with or without 50 mM NaCl treatment for 7 days. Error bars represent SEM of three independent biological repeats.
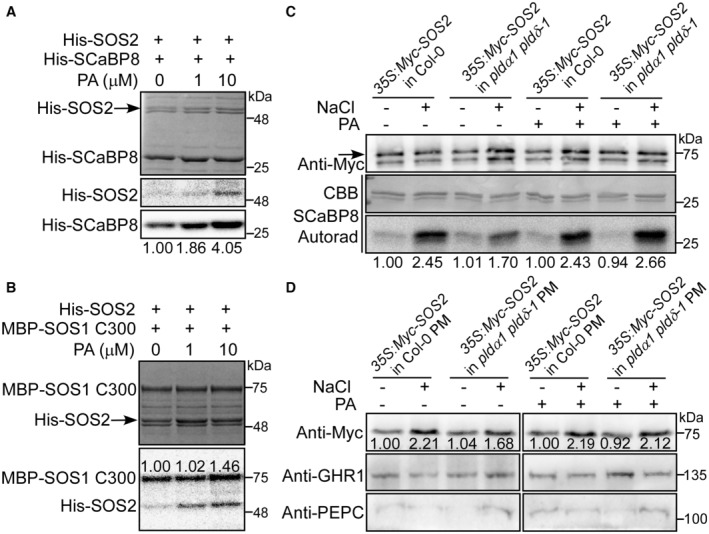
PA promotes the phosphorylation of SCaBP8 by SOS2. The phosphorylation activity of His‐SOS2 on His‐SCaBP8 was detected with or without 1 or 10 μM PA. The solvent of methanol was used as mock control. Coomassie brilliant blue‐stained (CBB) gel is shown in the upper panel, and autoradiograph (Autorad) results are shown in the middle and lower panels. The numbers indicate the relative ratios of the signal intensity of autoradiograph. Statistical analysis of the relative ratios is shown in Fig EV1A.
PA promotes the phosphorylation of SOS1 C300 by SOS2. CBB gel is shown in the upper panel, and Autorad result is shown in the lower panel. The numbers indicate the relative ratios of the signal intensity of autoradiograph. Statistical analysis of the relative ratios is shown in Fig EV1A.
PA promotes the activity of SOS2 under salt stress. Ten‐day‐old transgenic plants expressing 35S:6×Myc‐SOS2 in Col‐0 or pldα1 pldδ‐1 background were treated with or without 100 mM NaCl or 50 μM PA for 12 h. The total protein was extracted and immunoprecipitated with anti‐Myc antibody‐conjugated agarose, and then the purified Myc‐SOS2 proteins at similar protein levels were incubated with His‐SCaBP8 in the kinase assays. His‐SCaBP8 was used as a specific substrate of SOS2. The numbers below the blots indicate the relative ratios of the signal intensity between the autoradiograph and Myc‐SOS2 bands (Autorad/Myc). Statistical analysis of the relative ratios is shown in Fig EV1B.
PA promotes the PM localization of SOS2 under salt stress. Ten‐day‐old seedlings were treated as described in Fig 3C. GHR1 was used as a plasma membrane marker. PEPC was used as a cytoplasm marker. The numbers represent the relative ratios of the signal intensity between Myc‐SOS2 and GHR1 bands (Myc/GHR1). Statistical analysis of the relative ratios is shown in Fig EV1E.
- A
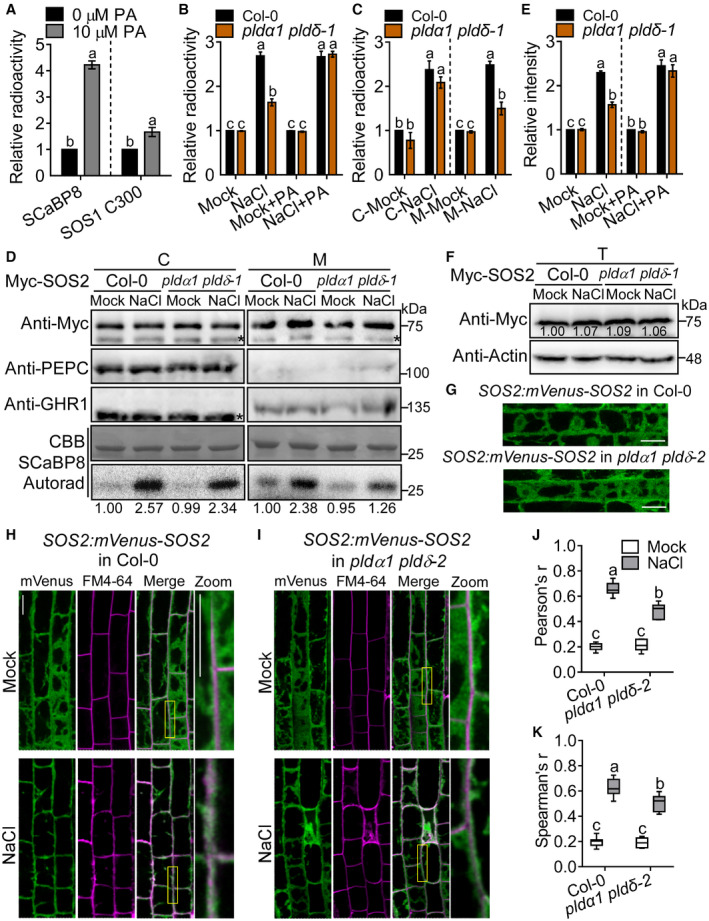
Analysis of the relative signal ratios of the results of Fig 3A and B. Error bars represent SEM of three independent biological repeats. Statistical analyses were done by Student's t‐test (P ≤ 0.01).
- B
Analysis of the relative signal ratios of the result of Fig 3C.
- C
Analysis of the relative signal ratios of the result of Fig EV1D.
- D
PA promotes SOS2 activity in the membrane fractions. Ten‐day‐old transgenic seedlings expressing 35S:6×Myc‐SOS2 were treated with or without 100 mM NaCl for 12 h. Cytoplasm (C) and membrane (M) proteins were immunoprecipitated with anti‐Myc antibody‐conjugated agarose, respectively. The purified Myc‐SOS2 proteins at similar protein levels were incubated with His‐SCaBP8 in the kinase assay. The numbers below the blots indicate the relative ratios of the signal intensity between the autoradiograph and Myc‐SOS2 bands (Autorad/Myc). The asterisks point to nonspecific bands.
- E
Analysis of the relative signal ratios of the result of Fig 3D.
- F
Analysis for total protein level of SOS2 under salt stress. Ten‐day‐old transgenic seedlings expressing 35S:6×Myc‐SOS2 were treated with or without 100 mM NaCl for 12 h. Total protein (T) was extracted for immunoblot with anti‐Myc and anti‐actin antibodies, respectively. The numbers indicate the relative ratios of the signal intensity between Myc‐SOS2 and actin bands (Myc/Actin).
- G
Confocal images of the localization of mVenus‐SOS2. Six‐day‐old transgenic seedlings expressing SOS2:mVenus‐SOS2 in Col‐0 or pldα1 pldδ‐2 were used to observe the localization of SOS2 in a deeper confocal plane level than that in Fig EV1H and I. Scale bars (white lines): 20 μm.
- H, I
PA promotes the PM localization of SOS2 under salt stress. Confocal images of mVenus‐SOS2 (green signals) with FM4‐64‐labeled plasma membrane (magenta signals). Five‐day‐old seedlings were transferred to half‐strength MS medium with or without 100 mM NaCl for 24 h. The yellow box marks the region zoomed in. Scale bars (white lines): 20 μm.
- J, K
Ratios of Pearson's r and Spearman's r of mVenus and FM4‐64 signals on the PM. Statistical analyses were done by two‐way ANOVA with Holm–Sidak's multiple comparisons test (n = 7; P ≤ 0.01).
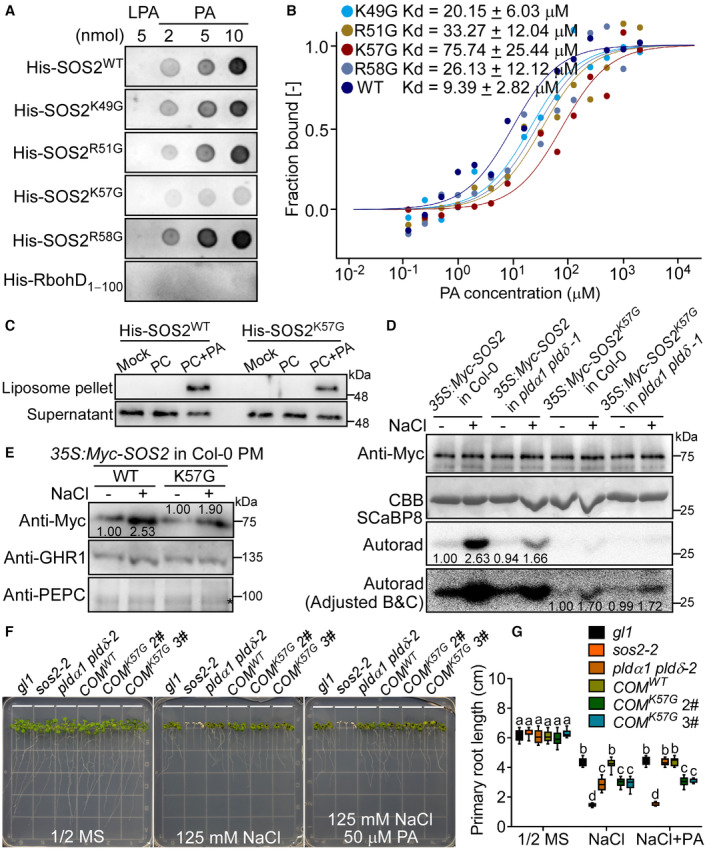
The lipid dot‐blot assays show that the site K57 is critical for SOS2 binding to PA. His‐SOS2 with indicated point mutations were incubated with PA or lysophosphatidic acid (LPA). LPA was used as the control. SOS2 was detected by immunoblot using anti‐His antibody.
MST assays show that the site K57 is critical for SOS2 binding to PA. His‐SOS2 with indicated point mutations were labeled and kept at a constant concentration (0.5 μM). PA was hydrated in TBST buffer and diluted 15 times in a 1:1 ratio. Statistical analysis of the Kd values is shown in Fig EV2A.
Liposome‐binding assays show that the site K57 is critical for SOS2 binding to PA. The recombinant proteins were incubated with indicated liposomes, respectively.
SOS2K57G has weak activity and cannot be activated by PA under salt stress. Ten‐day‐old seedlings expressing 35S:6 × Myc‐SOS2 or 35S:6 × Myc‐SOS2 K57G in Col‐0 or pldα1 pldδ‐1 background were treated with or without 100 mM NaCl for 12 h. The brightness and contrast (B, C) of the autoradiograph were adjusted to clearly show the activity of SOS2K57G. The numbers below the blots indicate the relative ratios of the signal intensity between the autoradiograph and Myc‐SOS2 bands (Autorad/Myc). Statistical analysis of the relative ratios is shown in Fig EV2E.
The site K57 is important for the PM localization of SOS2 under salt stress. Ten‐day‐old seedlings were treated with or without 100 mM NaCl for 12 h. The numbers represent the relative ratios of the signal intensity between Myc‐SOS2 and GHR1 bands (Myc/GHR1). The asterisk points to nonspecific band. Statistical analysis of the relative ratios is shown in Fig EV2F.
The mutation K57G blocks SOS2 activation under salt stress. Six‐day‐old seedlings transgenic lines expressing SOS2:GFP‐SOS2 WT or SOS2:GFP‐SOS2 K57G in sos2‐2 (denoted by COM WT or COM K57G ) were treated with 125 mM NaCl and 50 μM PA for 7 days. The sos2‐2 mutant is in gl1 background, but the mutation gl1 does not affect salt sensitivity when compared with Col‐0 ecotype.
Analysis for primary root length, related to Fig 4F. Data were shown in a box and whiskers (min to max) form (n = 12). Statistical analyses were done by two‐way ANOVA with Holm–Sidak's multiple comparisons test (P ≤ 0.05).
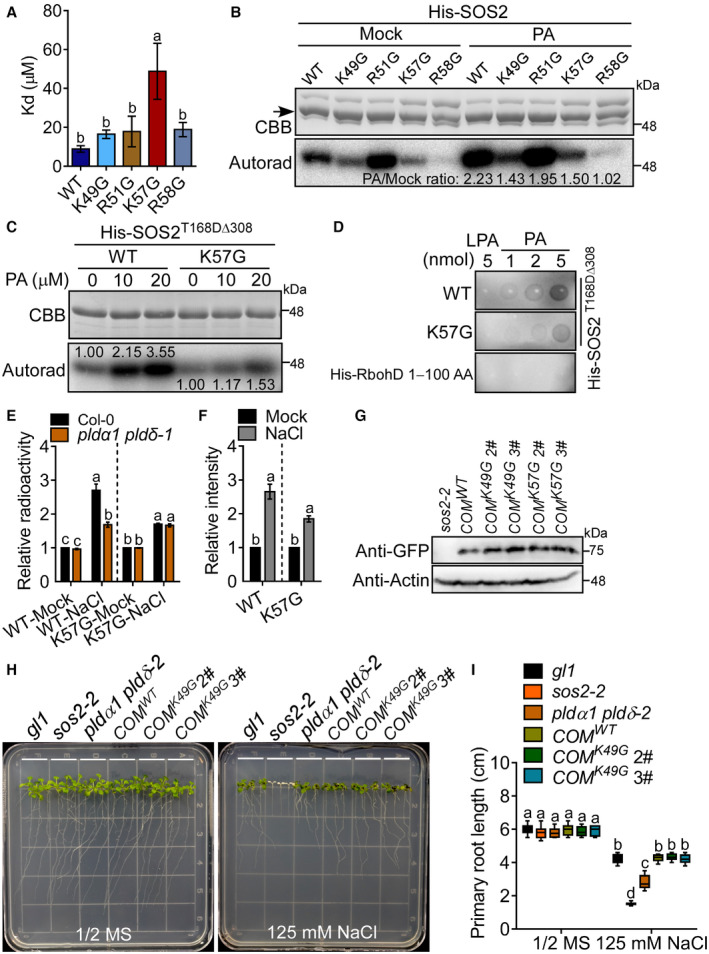
Analysis of the Kd values of the MST result of Fig 4B. Error bars represent SEM of three independent biological repeats. Statistical analysis was determined by one‐way ANOVA with Holm‐Sidak's multiple comparisons test (P ≤ 0.05).
The activity of His‐SOS2 with indicated point mutations with or without 10 μM PA treatment. The black arrow points to the indicated recombinant protein. The numbers below the blots indicate the signal intensity ratios of PA treatment to mock (PA/Mock).
The site K57 is important for PA‐activating SOS2 in vitro. The K57G mutation was combined with a highly active mutation T168DΔ308 of SOS2. The numbers below the blots indicate the relative ratios of the signal intensity of autoradiograph.
The lipid dot‐blot assays show that the site K57 is important for PA binding to His‐SOS2T168DΔ308.
Statistical analysis of the relative signal ratios of the result of Fig 4D. Error bars represent SEM of three independent biological repeats. Statistical analysis was done by two‐way ANOVA with Holm‐Sidak's multiple comparisons test (P ≤ 0.01).
Statistical analysis of the relative signal ratios of the result of Fig 4E. Error bars represent SEM of three independent biological repeats. Statistical analysis was determined by Student's t‐test (P ≤ 0.01).
The protein levels of SOS2 mutations in the complementary lines in Figs 4F and EV2H. The total protein was extracted from sos2‐2 or the indicated complementary plants for immunoblot analyses with anti‐GFP and anti‐Actin antibodies, respectively.
SOS2K49G mutation may not affect the function of SOS2 under salt stress. Six‐day‐old seedlings of T3 homozygous lines expressing SOS2:GFP‐SOS2 K49G in the sos2‐2 background (denoted by COM K49G ) were treated with 125 mM NaCl for 7 days.
Analysis for primary root length, related to Fig EV2H. Statistical analysis was done by two‐way ANOVA with Holm‐Sidak's multiple comparisons test (n = 12; P ≤ 0.05).
- A
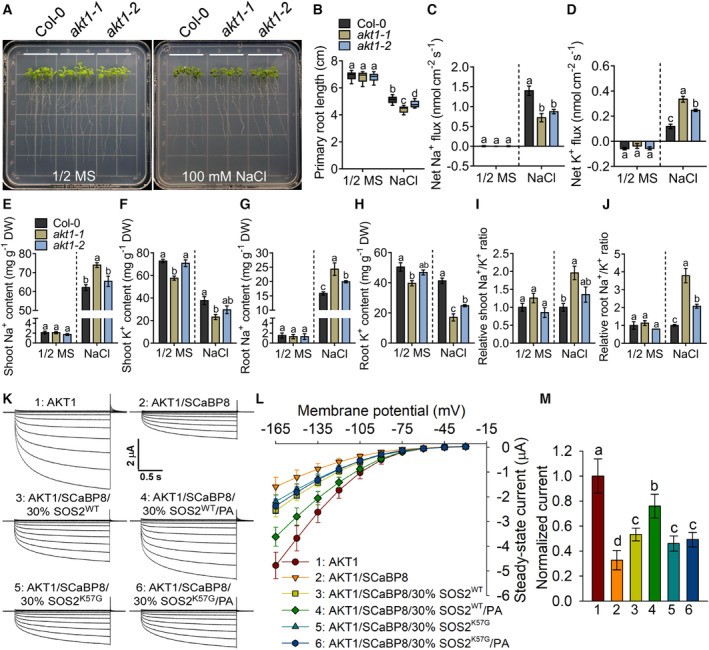
The loss‐of‐function mutants akt1‐1 and akt1‐2 are salt sensitive. Six‐day‐old seedlings of Col‐0 (WT) and akt1 mutants were treated with or without 100 mM NaCl for 7 days.
- B
Analysis for primary root length, related to Fig 5A. Data were shown in a box and whiskers (min to max) form (n ≥ 10). Statistical analysis was done by two‐way ANOVA with Holm‐Sidak's multiple comparisons test (P ≤ 0.05).
- C, D
Analysis of the average values of the net Na+ (C) and K+ (D) fluxes of Col‐0 and akt1 mutants with or without 100 mM NaCl treatment for 24 h. Error bars represent SD (n ≥ 4).
- E–J
The contents of shoot Na+ (E), shoot K+ (F), root Na+ (G), and root K+ (H) as well as the relative ratios of shoot Na+/K+ (I) and root Na+/K+ (J) of Col‐0 and akt1 mutants. Six‐day‐old seedlings were treated with or without 100 mM NaCl treatment for 7 days. Error bars represent SEM of three independent biological repeats.
- K
Time‐ and voltage‐dependent AKT1‐mediated K+ current recordings from oocytes. Whole‐cell K+ currents were recorded in oocytes that were co‐injected with an indicated mixture of cRNAs for AKT1, SCaBP8, and SOS2 (SOS2WT or SOS2K57G), in the presence of CIPK23 and CBL1. Thirty percent SOS2 means that the cRNA injection amount of SOS2 was 30% of SCaBP8. The oocytes were treated with or without 50 μM PA for 1.5 h.
- L
I‐V relationship of AKT1 steady‐state currents in oocytes. Error bars represent SD (n = 8).
- M
Comparison of steady‐state currents elicited by −150 mV, related to Fig 5L. Error bars represent SD (n = 8).
- A
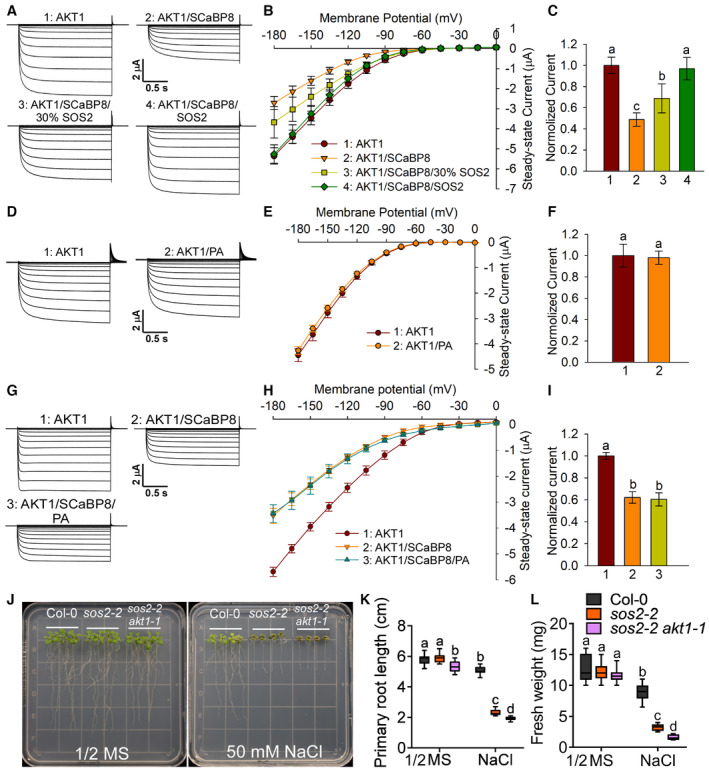
SOS2 relieves SCaBP8‐mediated AKT1 inhibition in oocytes. The recorded oocytes were co‐injected with an indicated mixture of cRNAs for AKT1, SCaBP8, and SOS2 in the presence of CIPK23 and CBL1.
- B
I‐V relationship of AKT1 steady‐state currents in oocytes. Error bars represent SD (n ≥ 7).
- C
Comparison of steady‐state currents elicited by −165 mV, related to Fig EV3B.
- D
PA cannot affect AKT1‐mediated K+ currents in oocytes. The oocytes were treated with or without 100 μM PA for 1.5 h.
- E
I‐V relationship of AKT1 steady‐state currents in oocytes. Error bars represent SD (n = 10).
- F
Comparison of steady‐state currents elicited by −150 mV, related to Fig EV3E. Error bars represent SD (n = 10). Statistical analysis was determined by Student's t‐test.
- G
PA has no effect on the AKT1‐mediated K+ currents inhibited by SCaBP8. The recorded oocytes were co‐injected with an indicated mixture of cRNAs for AKT1 and SCaBP8 in the presence of CIPK23 and CBL1. Oocytes were treated with or without 100 μM PA for 1.5 h.
- H
I‐V relationship of AKT1 steady‐state currents in oocytes. Error bars represent SD (n = 6).
- I
Comparison of steady‐state currents elicited by −180 mV, related to Fig EV3H.
- J
Salt phenotype of sos2‐2 and sos2‐2 akt1‐1 mutants. Six‐day‐old seedlings were treated with or without 50 mM NaCl for 7 days.
- K, L
Analyses for primary root length (K) and fresh weight per seedling (L), related to Fig EV3J. Statistical analyses were done by two‐way ANOVA with Holm–Sidak's multiple comparisons test (n = 12; P ≤ 0.01).
- A
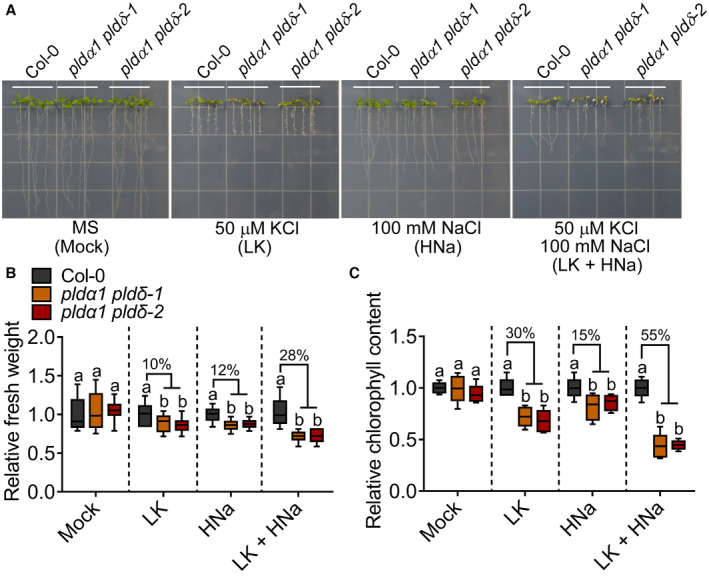
The mutants pldα1 pldδ‐1 and pldα1 pldδ‐2 are more sensitive to the LK plus HNa stress than HNa stress alone. Five‐day‐old seedlings were transferred to MS (containing about 20 mM KCl) and LK medium (containing about 50 μM KCl) with or without 100 mM NaCl for 6 days.
- B, C
Analyses for the relative fresh weight (B) and relative chlorophyll content (C). The growth levels are presented as values relative to that of Col‐0 for each set of experiments (Mutant/Col‐0). The percentages indicate the degree of growth reduction of the mutants relative to Col‐0. Statistical analyses were done by one‐way ANOVA with Holm–Sidak's multiple comparisons test (B: n = 12, C: n = 5; P ≤ 0.05).
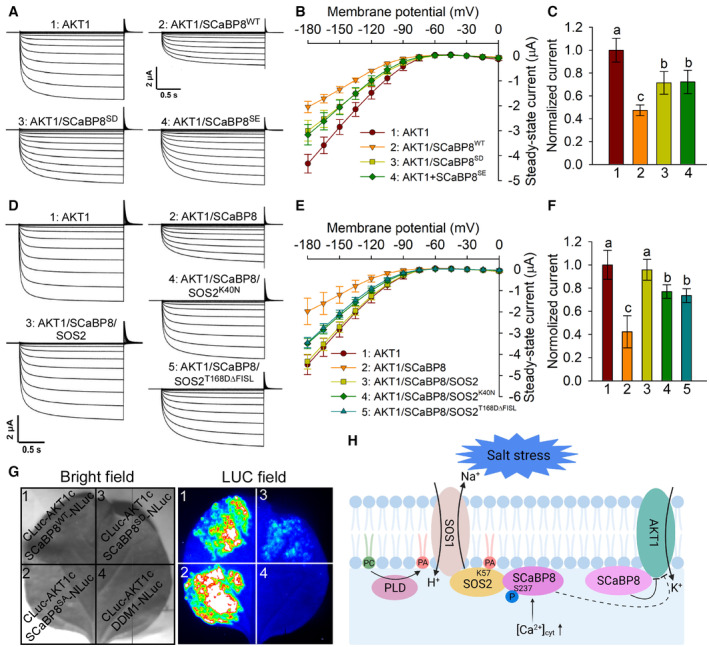
Phospho‐mimetic SCaBP8SD and SCaBP8SE attenuate the SCaBP8‐mediated inhibition of AKT1 in oocytes. Time‐ and voltage‐dependent AKT1‐mediated K+ currents were recorded. The recorded oocytes were co‐injected with an indicated mixture of cRNAs for AKT1 and SCaBP8 (SCaBP8WT, SCaBP8SD, or SCaBP8SE) in the presence of CIPK23 and CBL1.
I‐V relationship of AKT1 steady‐state currents in oocytes. Error bars represent SD (n = 8).
Comparison of steady‐state currents elicited by −150 mV, related to Fig 6B.
SOS2K40N and SOS2T168DΔFISL attenuate the SCaBP8‐mediated inhibition of AKT1 in oocytes. The recorded oocytes were co‐injected with an indicated mixture of cRNAs for AKT1, SCaBP8, and SOS2 (SOS2WT, SOS2T168DΔFISL or SOS2K40N) in the presence of CIPK23 and CBL1.
I‐V relationship of AKT1 steady‐state currents in oocytes. Error bars represent SD (n ≥ 7).
Comparison of steady‐state currents elicited by −150 mV, related to Fig 6E.
Split‐luciferase complementation (split‐LUC) assays show the interaction between phospho‐mimetic SCaBP8S237D and AKT1c. The combination of CLuc‐AKT1c/DDM1‐NLuc was used as a negative control. The transcriptional expression level of genes is shown in Appendix Fig S6D.
Under salt stress, the content of PLD‐derived PA of the PM increases rapidly. PA binds to the K57 site of SOS2, promotes the activity and PM localization of SOS2, and then activates SOS1 to promote Na+ efflux. In addition, PA promotes the phosphorylation of SCaBP8 at S237 by SOS2, and then attenuates the SCaBP8‐mediated inhibition of AKT1, thereby promoting K+ influx.
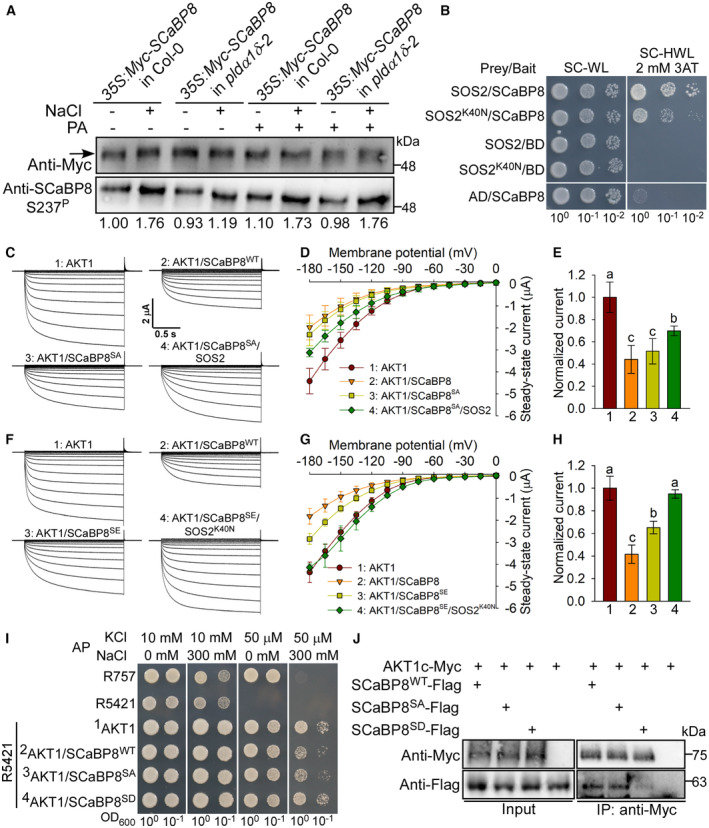
PA promotes S237 phosphorylation of SCaBP8 by SOS2 under salt stress. Ten‐day‐old seedlings expressing 35S:6×Myc‐SCaBP8 were treated with or without 100 mM NaCl or 50 μM PA for 12 h. The total protein was extracted and immunoprecipitated with anti‐Myc antibody‐conjugated agarose, and then the purified Myc‐SCaBP8 proteins at similar protein levels were used for immunoblot analysis with anti‐Myc and anti‐SCaBP8 S237P antibodies. The numbers below the blots indicate the relative ratios of the signal intensity between the S237P and Myc‐SCaBP8 bands (S237P/Myc). Statistical analysis of the relative ratios is shown in Appendix Fig S6A.
SOS2K40N can interact with SCaBP8 in yeast two‐hybrid assays. Combinations of AD/BD‐SCaBP8, AD‐SOS2/BD, and AD‐SOS2K40N/BD were used as negative controls.
Time‐ and voltage‐dependent AKT1‐mediated K+ current recordings from oocytes. The recorded oocytes were co‐injected with an indicated mixture of cRNAs for AKT1, ScaBP8 (ScaBP8WT or ScaBP8SA), and SOS2 in the presence of CIPK23 and CBL1.
I‐V relationship of AKT1 steady‐state currents in oocytes. Error bars represent SD (n ≥ 5).
Comparison of steady‐state currents elicited by −180 mV, related to Fig EV5D.
Time‐ and voltage‐dependent AKT1‐mediated K+ current recordings from oocytes. The recorded oocytes were co‐injected with an indicated mixture of cRNAs for AKT1, SCaBP8 (SCaBP8WT or SCaBP8SE), and SOS2K40N in the presence of CIPK23 and CBL1.
I‐V relationship of AKT1 steady‐state currents in oocytes. Error bars represent SD (n = 4).
Comparison of steady‐state currents elicited by −180 mV, related to Fig EV5G.
Phosphorylation of S237 of SCaBP8 relieves its inhibition on AKT1 in R5421 yeast cells under LK plus HNa stress. The yeast cells transformed with AKT1 and empty vectors or indicated genes were grown on AP medium for 3 days.
Co‐immunoprecipitation assays in tobacco show that the interaction between phospho‐mimetic SCaBP8S237D and AKT1c is weaker than that of SCaBP8WT.
Similar articles
-
Phosphorylation of SOS3-LIKE CALCIUM BINDING PROTEIN8 by SOS2 protein kinase stabilizes their protein complex and regulates salt tolerance in Arabidopsis.Plant Cell. 2009 May;21(5):1607-19. doi: 10.1105/tpc.109.066217. Epub 2009 May 15. Plant Cell. 2009. PMID: 19448033 Free PMC article.
-
SCABP8/CBL10, a putative calcium sensor, interacts with the protein kinase SOS2 to protect Arabidopsis shoots from salt stress.Plant Cell. 2007 Apr;19(4):1415-31. doi: 10.1105/tpc.106.042291. Epub 2007 Apr 20. Plant Cell. 2007. PMID: 17449811 Free PMC article.
-
Reconstitution in yeast of the Arabidopsis SOS signaling pathway for Na+ homeostasis.Proc Natl Acad Sci U S A. 2002 Jun 25;99(13):9061-6. doi: 10.1073/pnas.132092099. Epub 2002 Jun 17. Proc Natl Acad Sci U S A. 2002. PMID: 12070350 Free PMC article.
-
Regulation of ion homeostasis under salt stress.Curr Opin Plant Biol. 2003 Oct;6(5):441-5. doi: 10.1016/s1369-5266(03)00085-2. Curr Opin Plant Biol. 2003. PMID: 12972044 Review.
-
A Salt Overly Sensitive Pathway Member from Brassica juncea BjSOS3 Can Functionally Complement ΔAtsos3 in Arabidopsis.Curr Genomics. 2018 Jan;19(1):60-69. doi: 10.2174/1389202918666170228133621. Curr Genomics. 2018. PMID: 29491733 Free PMC article. Review.
Cited by
-
Suaeda salsa NRT1.1 Is Involved in the Regulation of Tolerance to Salt Stress in Transgenic Arabidopsis.Int J Mol Sci. 2023 Aug 14;24(16):12761. doi: 10.3390/ijms241612761. Int J Mol Sci. 2023. PMID: 37628942 Free PMC article.
-
Transcriptomic and Lipidomic Analysis Reveals Complex Regulation Mechanisms Underlying Rice Roots' Response to Salt Stress.Metabolites. 2024 Apr 21;14(4):244. doi: 10.3390/metabo14040244. Metabolites. 2024. PMID: 38668372 Free PMC article.
-
Unraveling the Contribution of MulSOS2 in Conferring Salinity Tolerance in Mulberry (Morus atropurpurea Roxb).Int J Mol Sci. 2024 Mar 24;25(7):3628. doi: 10.3390/ijms25073628. Int J Mol Sci. 2024. PMID: 38612440 Free PMC article.
-
Calcium signaling in plant mineral nutrition: From uptake to transport.Plant Commun. 2023 Nov 13;4(6):100678. doi: 10.1016/j.xplc.2023.100678. Epub 2023 Aug 26. Plant Commun. 2023. PMID: 37635354 Free PMC article. Review.
-
Functions of Phytochrome Interacting Factors (PIFs) in Adapting Plants to Biotic and Abiotic Stresses.Int J Mol Sci. 2024 Feb 12;25(4):2198. doi: 10.3390/ijms25042198. Int J Mol Sci. 2024. PMID: 38396875 Free PMC article. Review.
References
-
- Batistič O, Waadt R, Steinhorst L, Held K, Kudla J (2010) CBL‐mediated targeting of CIPKs facilitates the decoding of calcium signals emanating from distinct cellular stores. Plant J 61: 211–222 - PubMed
-
- Chaves‐Sanjuan A, Sanchez‐Barrena MJ, Gonzalez‐Rubio JM, Moreno M, Ragel P, Jimenez M, Pardo JM, Martinez‐Ripoll M, Quintero FJ, Albert A (2014) Structural basis of the regulatory mechanism of the plant CIPK family of protein kinases controlling ion homeostasis and abiotic stress. Proc Natl Acad Sci USA 111: E4532–E4541 - PMC - PubMed
Publication types
MeSH terms
Substances
LinkOut - more resources
Full Text Sources
Molecular Biology Databases
Miscellaneous
