. 2023 May 2;83(9):1459-1475.
doi: 10.1158/0008-5472.CAN-22-2585.

circFNDC3B Accelerates Vasculature Formation and Metastasis in Oral Squamous Cell Carcinoma

Affiliations

circFNDC3B Accelerates Vasculature Formation and Metastasis in Oral Squamous Cell Carcinoma

Xiang Li et al. Cancer Res. .

Abstract

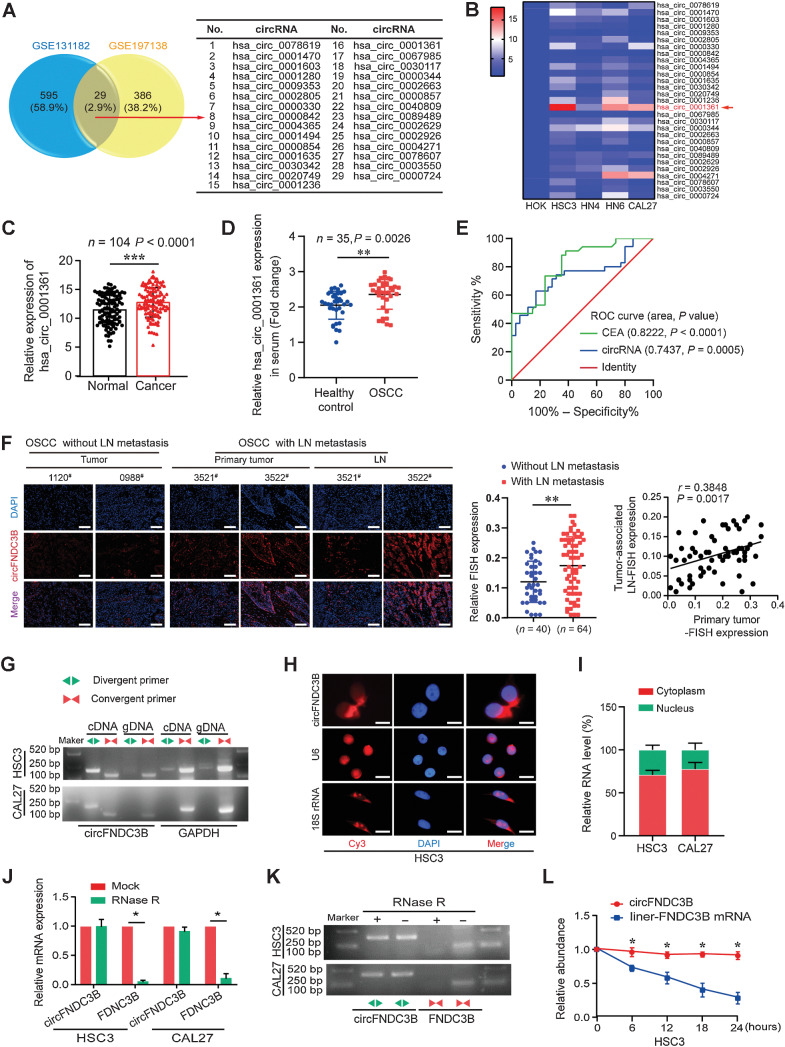
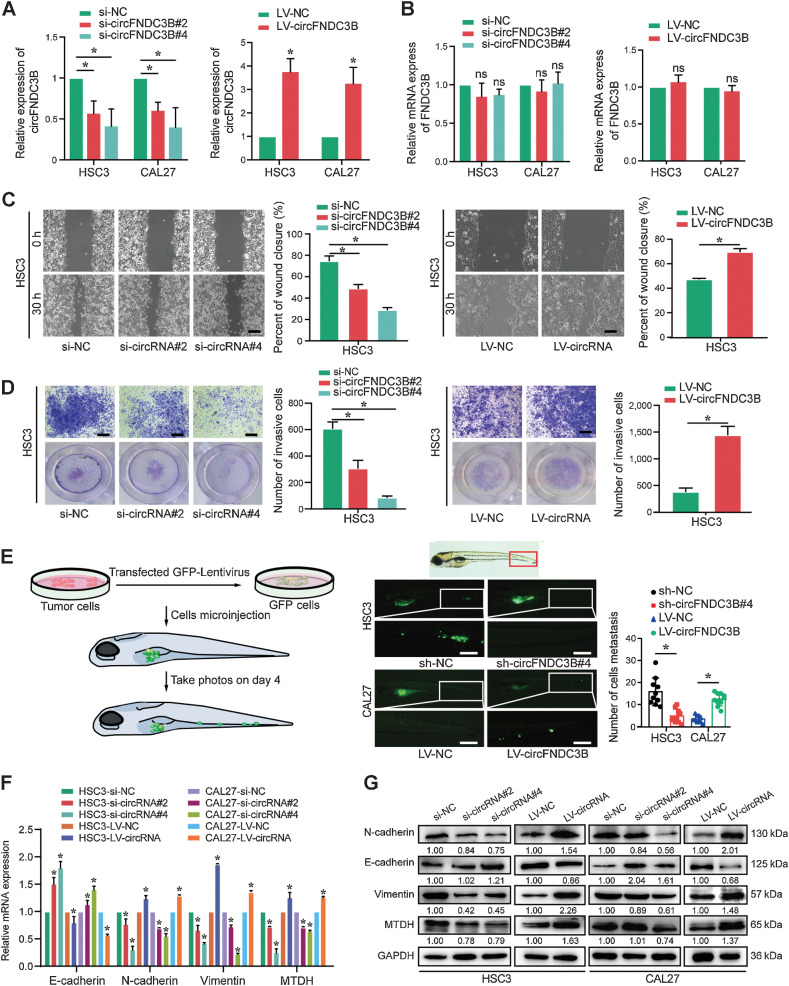
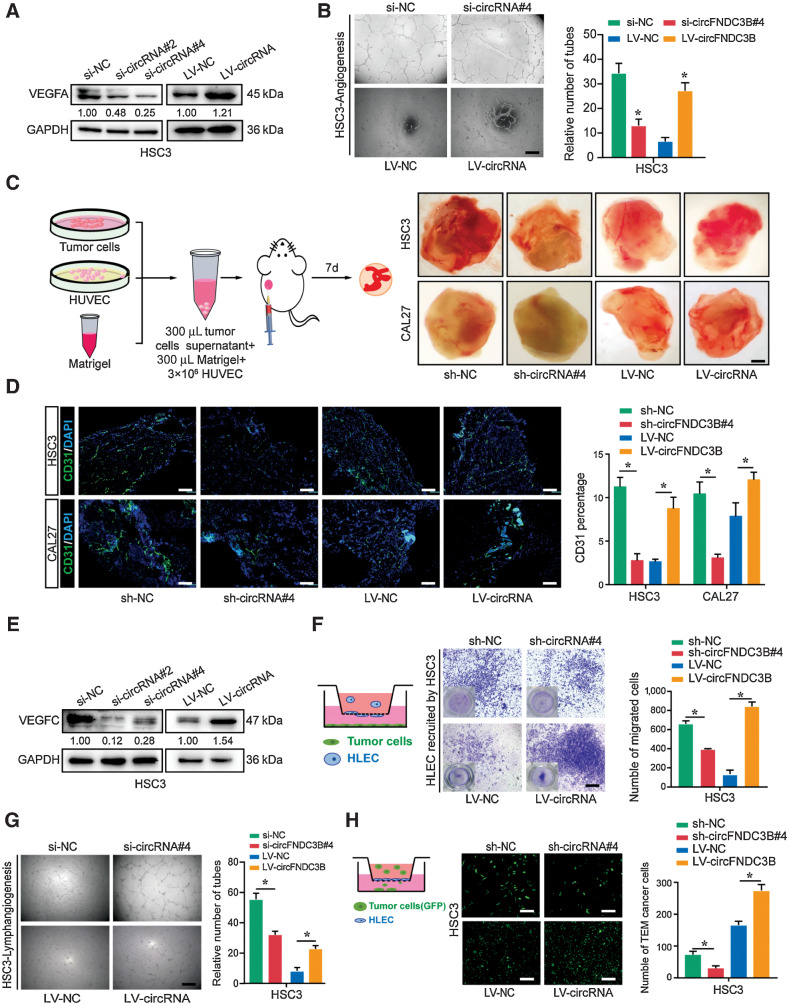
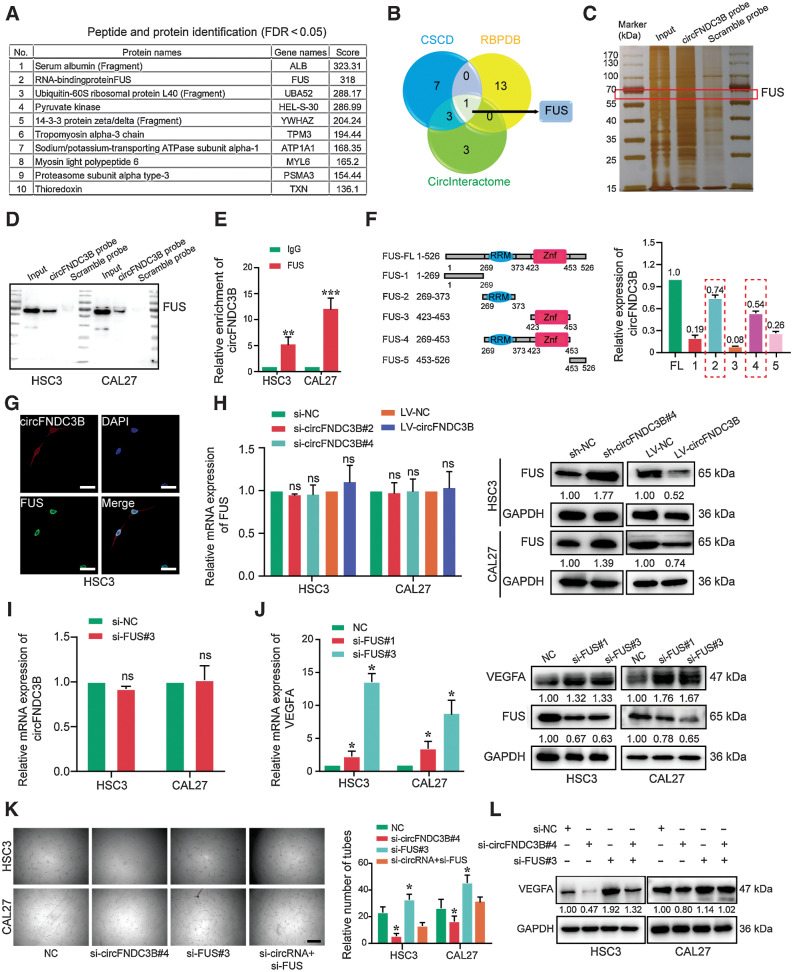
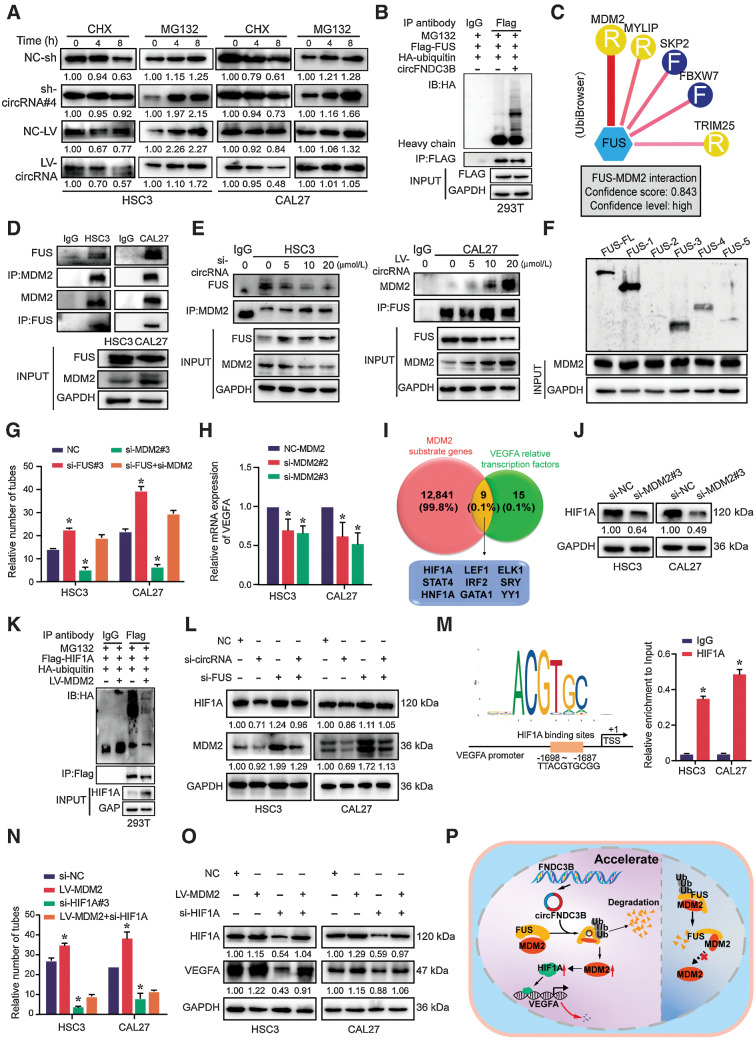
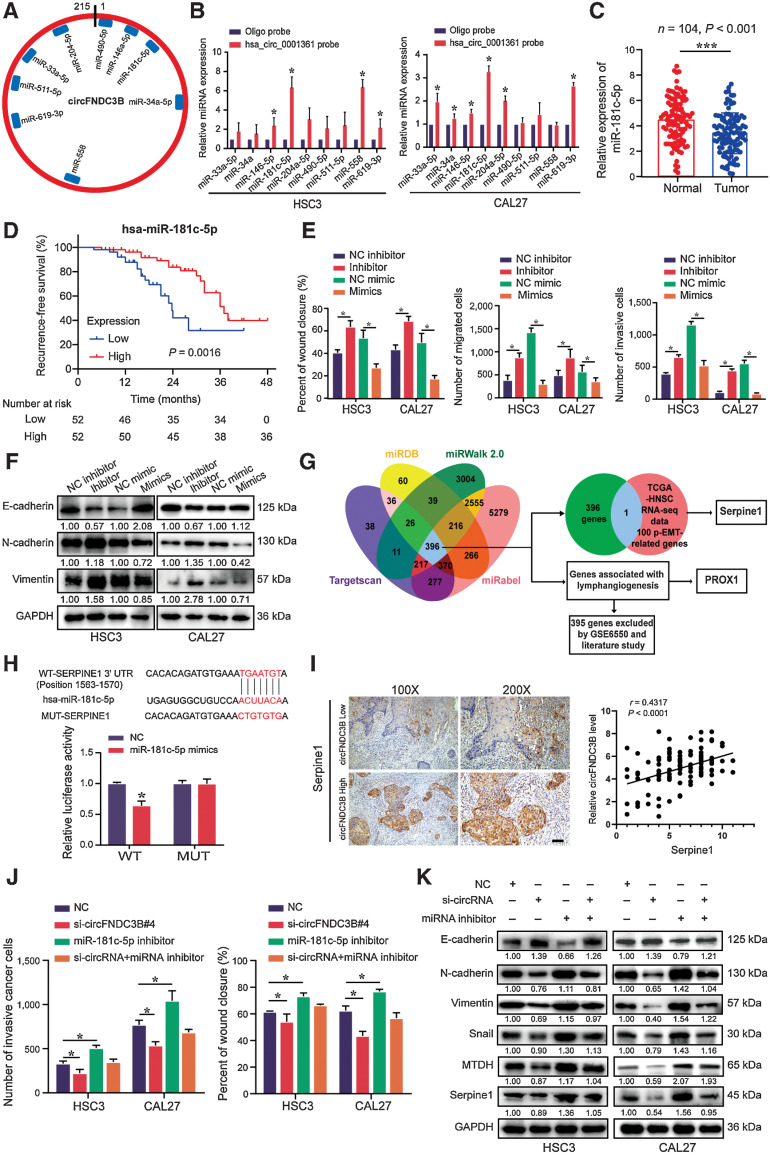
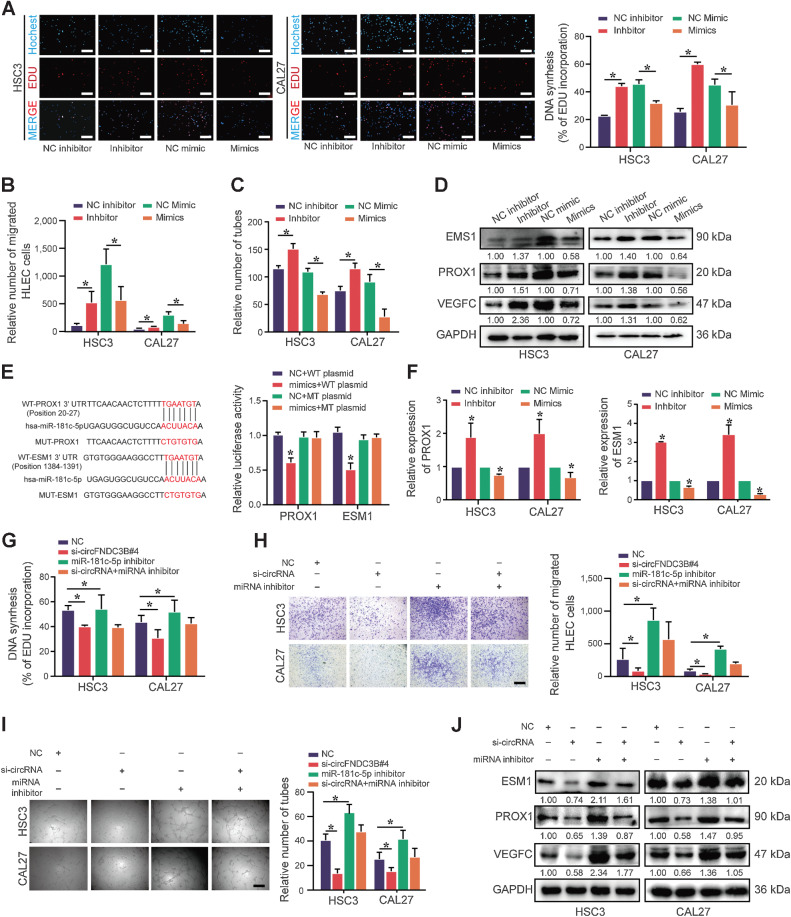
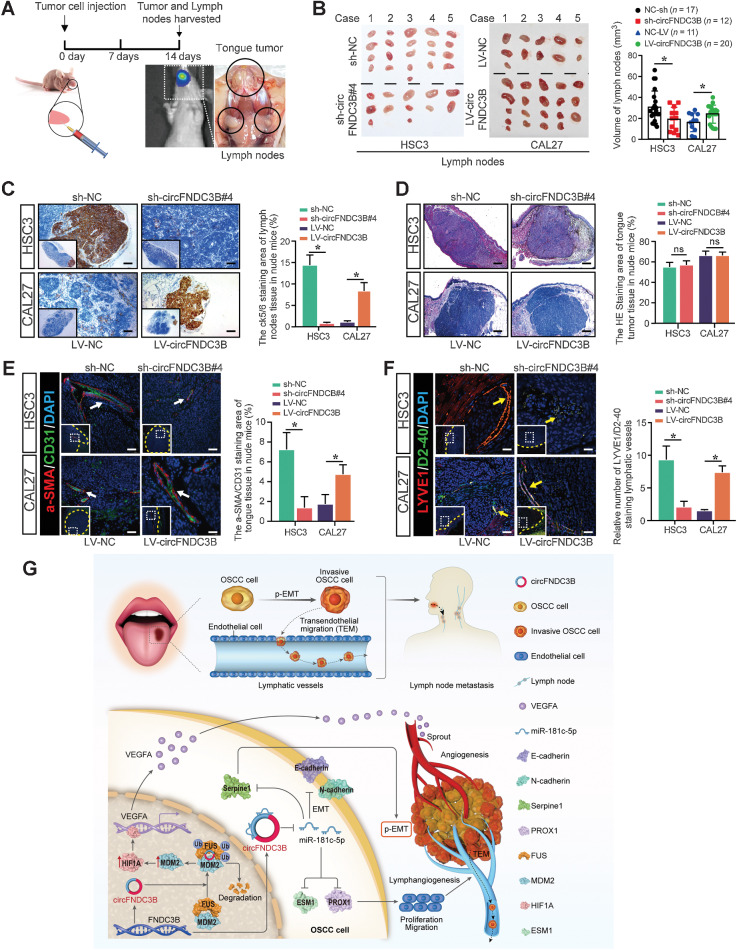
Emerging evidence has demonstrated that circular RNAs (circRNA) are involved in cancer metastasis. Further elucidation of the role of circRNAs in oral squamous cell carcinoma (OSCC) could provide insights into mechanisms driving metastasis and potential therapeutic targets. Here, we identify a circRNA, circFNDC3B, that is significantly upregulated in OSCC and is positively associated with lymph node (LN) metastasis. In vitro and in vivo functional assays showed that circFNDC3B accelerated the migration and invasion of OSCC cells and the tube-forming capacity of human umbilical vein endothelial cells and human lymphatic endothelial cells. Mechanistically, circFNDC3B regulated ubiquitylation of the RNA-binding protein FUS and the deubiquitylation of HIF1A through the E3 ligase MDM2 to promote VEGFA transcription, thereby enhancing angiogenesis. Meanwhile, circFNDC3B sequestered miR-181c-5p to upregulate SERPINE1 and PROX1, which drove epithelial-mesenchymal transition (EMT) or partial-EMT (p-EMT) in OSCC cells and promoted lymphangiogenesis to accelerate LN metastasis. Overall, these findings uncovered the mechanistic role of circFNDC3B in orchestrating cancer cell metastatic properties and vasculature formation, suggesting circFNDC3B could be a potential target to reduce OSCC metastasis.

Significance: Dual functions of circFNDC3B in enhancing the metastatic ability of cancer cells and promoting vasculature formation through regulation of multiple pro-oncogenic signaling pathways drive lymph node metastasis of OSCC.


Figures

Figure 1. The identification and characterization of hsa_circ_0001361 in OSCC. A, Download GEO data sets for comprehensive analysis of differentially expressed circRNAs. Twenty-nine upregulated expressed circRNAs were listed. B, The relative expression levels of 29 circular RNAs were detected in 4 groups of HNSCC cell lines and HOK by qRT-PCR. Hsa_circ_0001361 has the highest relative expression. C, qRT-PCR analysis of hsa_circ_0001361 expression in 104 paired OSCC tissues and normal tissues. D, Serum hsa_circ_0001361 expression in healthy controls and OSCC patients were determined by qRT-PCR (n = 35, P = 0.0026). E, ROC curves were used to evaluate the diagnostic value of serum circFNDC3B in OSCC, compared with CEA. F, FISH staining assay showed that circFNDC3B expression in OSCC tissues with LN metastasis was higher than that without LN, and higher circFNDC3B expression in OSCC primary tumor was positively correlated with its expression in paired lymph nodes. G, Combining PCR with an electrophoresis assay indicated the presence of circFNDC3B using divergent and convergent primers from cDNA or genomic DNA in HSC3 and CAL27 cells. H, Representative FISH images showed the cellular localization of circFNDC3B. The circFNDC3B probe was labeled with Cy3 (red), and nuclei were stained with DAPI (blue). The images were photographed at 400× magnification. I, The location of circFNDC3B was confirmed using a subcellular fractionation assay and qRT-PCR data indicated that circFNDC3B is mainly located in the cytoplasm, and a minor part is in the nucleus. J and K, qRT-PCR and electrophoresis analysis for the resistance of circFNDC3B and linear FNDC3B to RNase R in HSC3 and CAL27 cells. Two-tailed t test was used. L, Actinomycin D assay to evaluate the stability of circFNDC3B and FNDC3B mRNA in HSC3 cells. Two-tailed t test was used. *, Statistical significance. #, Case numbers of patients. Scale bars, 100 μm (F) and 10 μm (H).
Figure 1.
The identification and characterization of hsa_circ_0001361 in OSCC. A, Downloaded GEO data sets for comprehensive analysis of differentially expressed circRNAs. Twenty-nine upregulated expressed circRNAs were listed. B, The relative expression levels of 29 circular RNAs were detected in four groups of HNSCC cell lines and HOK by qRT-PCR. Hsa_circ_0001361 has the highest relative expression. C, qRT-PCR analysis of hsa_circ_0001361 expression in 104 paired OSCC tissues and normal tissues. D, Serum hsa_circ_0001361 expression in healthy controls and OSCC patients were determined by qRT-PCR (n = 35, P = 0.0026). E, ROC curves were used to evaluate the diagnostic value of serum circFNDC3B in OSCC, compared with CEA. F, FISH staining assay showed that circFNDC3B expression in OSCC tissues with LN (**, P = 0.0030) metastasis was higher than that without LNs, and higher circFNDC3B expression in OSCC primary tumor was positively correlated with its expression in paired LNs. G, Combining PCR with an electrophoresis assay indicated the presence of circFNDC3B using divergent and convergent primers from cDNA or genomic DNA in HSC3 and CAL27 cells. H, Representative FISH images showed the cellular localization of circFNDC3B. The circFNDC3B probe was labeled with Cy3 (red), and nuclei were stained with DAPI (blue). The images were photographed at ×400 magnification. I, The location of circFNDC3B was confirmed using a subcellular fractionation assay and qRT-PCR data indicated that circFNDC3B is mainly located in the cytoplasm, and a minor part is in the nucleus. J and K, qRT-PCR and electrophoresis analysis for the resistance of circFNDC3B and linear FNDC3B to RNase R in HSC3 and CAL27 cells. Two-tailed t test was used. L, Actinomycin D assay to evaluate the stability of circFNDC3B and FNDC3B mRNA in HSC3 cells. Two-tailed t test was used. *, P < 0.05. #, Case numbers of patients. Scale bars, 100 μm (F) and 10 μm (H).
Figure 2. circFNDC3B accelerates the migration, invasion, EMT, and metastasis of OSCC cells. A and B, circFNDC3B and FNDC3B mRNA levels were assessed by qRT-PCR in HSC3 and CAL27 cells treated with si-circFNDC3Bs and LV-circFNDC3B, as indicated. C, The migration capability was suppressed in HSC3 cells treated with si-circFNDC3B#2 and si-circFNDC3B#4, whereas migration was promoted in HSC3 cells transfected with the LV-circFNDC3B, as determined using the wound-healing assay. D, The cell invasion ability was measured using transwell matrigel invasion assays after transfected with si-circFNDC3B or circFNDC3B overexpression in HSC3 cells. E, Zebrafish xenografts revealed that the HSC3-sh-NC group had more tumor metastasis to tail areas of the fish compared with the HSC3-sh-circFNDC3B group, whereas the CAL27-LV-circFNDC3B group had more tumor metastasis cancer cells than the CAL27-LV-NC group. F and G, mRNA and protein expression levels of EMT and metastasis markers were detected via qRT-PCR and Western blot analysis in HSC3 and CAL27 cells. Data were presented as the mean of >3 independent experiments ± standard deviation (SD). *, Statistical significance. ns, no statistical significance. Scale bars, 100 μm (C–E).
Figure 2.
circFNDC3B accelerates the migration, invasion, EMT, and metastasis of OSCC cells. A and B, circFNDC3B and FNDC3B mRNA levels were assessed by qRT-PCR in HSC3 and CAL27 cells treated with si-circFNDC3Bs and LV-circFNDC3B, as indicated. C, The migration capability was suppressed in HSC3 cells treated with si-circFNDC3B#2 and si-circFNDC3B#4, whereas migration was promoted in HSC3 cells transfected with the LV-circFNDC3B, as determined using the wound-healing assay. D, The cell invasion ability was measured using transwell Matrigel invasion assays after transfection with si-circFNDC3B or circFNDC3B overexpression in HSC3 cells. E, Zebrafish xenografts revealed that the HSC3-sh-NC group had more tumor metastasis to tail areas of the fish compared with the HSC3-sh-circFNDC3B group, whereas the CAL27-LV-circFNDC3B group had more tumor metastasis cancer cells than the CAL27-LV-NC group. F and G, mRNA and protein expression levels of EMT and metastasis markers were detected via qRT-PCR and Western blot analysis in HSC3 and CAL27 cells. Data are presented as the mean of >3 independent experiments ± SD. *, P < 0.05. ns, no statistical significance. Scale bars, 100 μm (C–E).
Figure 3. circFNDC3B enhances angiogenesis and lymphangiogenesis. A, Western blot assays showed that si-circFNDC3B downregulated VEGFA expression, and LV-circFNDC3B promoted its expression in HSC3. B, The conditioned medium from si-circFNDC3B HSC3 cells dramatically inhibited the tube formation of HUVECs in vitro, whereas HSC3-LV-circFNDC3B had the opposite results. C, Pattern diagram of Matrigel plug assay for in vivo evaluation of angiogenesis. And representative images of resected Matrigel plug. Intensity of the red color is used as a parameter for qualitative assessment. D, Representative image of Matrigel plug cryo-section. Endothelial cells are stained for CD31 (green), and nuclei are stained with DAPI (blue). E, Western blot assays showed that si-circFNDC3B downregulated VEGFC expression in HSC3, whereas LV-circFNDC3B upregulated its expression. F and G, Transwell assays (F) and tube formation (G) of HLECs treated with conditioned medium from circFNDC3B-silencing or overexpressing HSC3 cells. H, The indicated tumor cells were seeded on HLEC monolayers reaching confluence in 24-well transwell inserts. After incubation for 24 hours, the transmigrated HSC3 cells were imaged. These experiments were replicated three times. Data were presented as the mean ± SD. *, Statistical significance. Scale bars, 100 μm (B, D, and F–H); 0.25 cm (C).
Figure 3.
circFNDC3B enhances angiogenesis and lymphangiogenesis. A, Western blot assays showed that si-circFNDC3B downregulated VEGFA expression, and LV-circFNDC3B promoted its expression in HSC3. B, The conditioned medium from si-circFNDC3B HSC3 cells dramatically inhibited the tube formation of HUVECs in vitro, whereas HSC3-LV-circFNDC3B had the opposite results. C, Pattern diagram of Matrigel plug assay for in vivo evaluation of angiogenesis and representative images of resected Matrigel plug. Intensity of the red color was used as a parameter for qualitative assessment. D, Representative image of Matrigel plug cryosection. Endothelial cells were stained for CD31 (green), and nuclei were stained with DAPI (blue). E, Western blot assays showed that si-circFNDC3B downregulated VEGFC expression in HSC3, whereas LV-circFNDC3B upregulated its expression. F and G, Transwell assays (F) and tube formation (G) of HLECs treated with conditioned medium from circFNDC3B-silencing or overexpressing HSC3 cells. H, The indicated tumor cells were seeded on HLEC monolayers reaching confluence in 24-well transwell inserts. After incubation for 24 hours, the transmigrated HSC3 cells were imaged. These experiments were replicated three times. Data are presented as the mean ± SD. *, P < 0.05. Scale bars, 100 μm (B, D, and F–H); 0.25 cm (C).
Figure 4. circFNDC3B promotes angiogenesis by binding FUS in OSCC. A, List of the top 10 differentially expressed proteins identified by mass spectrometry, FDR < 0.05. B, Venn diagram demonstrating the overlapping of the interacting RBPs of circFNDC3B predicted by CSCD, RBPDB and CircInteractome. C, Silver staining of circFNDC3B pulldown in OSCC cells. The red box showed different expressions of FUS (65 kDa) between the sense and antisense lanes. D, Western blot showed circFNDC3B pulldown of the FUS. E, Expression of circFNDC3B was detected by qRT-PCR after RIP for FUS in HSC3 and CAL27. F, Truncated versions of FLAG-FUS were produced according to the FUS domain. mRNAs isolated from the RIP assays with anti-FLAG tag antibody were identified by qRT-PCR analysis using circFNDC3B primers in 293T cells. Three independent experiments were performed. G, The colocalization of FUS and circFNDC3B was detected by immunofluorescence staining in HSC3 cells. H, qRT-PCR and Western blot were used to detect the expression of FUS after transfecting with si-circFNDC3B and LV-circFNDC3B. I, Transcript level of circFNDC3B was not regulated by FUS. This means that FUS was downstream of circFNDC3B. J, The transcriptional levels and protein expression of VEGFA were upregulated by FUS silencing. K and L, Vessel formation (K) and Western blot (L) analysis showed that si-FUS functionally rescued angiogenesis and the expression of VEGFA upon circFNDC3B silencing. *, Statistical significance. ns, no statistical significance. Scale bars, 10 μm (G) and 100 μm (K).
Figure 4.
circFNDC3B promotes angiogenesis by binding FUS in OSCC. A, List of the top 10 differentially expressed proteins identified by mass spectrometry, FDR < 0.05. B, Venn diagram demonstrating the overlapping of the interacting RBPs of circFNDC3B predicted by CSCD, RBPDB, and CircInteractome. C, Silver staining of circFNDC3B pulldown in OSCC cells. The red box shows different expressions of FUS (65 kDa) between the sense and antisense lanes. D, Western blot showed circFNDC3B pulldown of the FUS. E, Expression of circFNDC3B was detected by qRT-PCR after RIP for FUS in HSC3 and CAL27. **, P = 0.0093; ***, P = 0.0009. F, Truncated versions of FLAG-FUS were produced according to the FUS domain. mRNAs isolated from the RIP assays with anti-FLAG tag antibody were identified by qRT-PCR analysis using circFNDC3B primers in 293T cells. Three independent experiments were performed. G, The colocalization of FUS and circFNDC3B was detected by immunofluorescence staining in HSC3 cells. H, qRT-PCR and Western blot were used to detect the expression of FUS after transfection with si-circFNDC3B and LV-circFNDC3B. I, Transcript level of circFNDC3B was not regulated by FUS. This means that FUS was downstream of circFNDC3B. J, The transcriptional levels and protein expression of VEGFA were upregulated by FUS silencing. K and L, Vessel formation (K) and Western blot (L) analysis showed that si-FUS functionally rescued angiogenesis and the expression of VEGFA upon circFNDC3B silencing. *, P < 0.05. ns, no statistical significance. Scale bars, 10 μm (G) and 100 μm (K).
Figure 5. FUS suppresses the transcription of VEGFA via modulating MDM2–HIF1A interactions. A, After treatment with CHX (10 μg/mL) and MG132(10 μg/mL) for indicated times, protein levels of FUS were determined by Western blot analyses of OSCC cells transfected with sh-/LV-circFNDC3B. B, Western blot analysis of ubiquitin immunoprecipitated with anti-HA tag antibodies in 293T cells. C, The UbiBrowser tool identified the E3 ligase that interacts with FUS. D, IP analysis revealed the FUS/MDM2 interaction in HSC3 and CAL27 cells. E, The FUS–MDM2 interaction was decreased in circFNDC3B downregulated HSC3 cells, whereas overexpression of circFNDC3B strengthened the interaction in CAL27 cells. F, IP analysis determined that FUS 1-269 and Znf domains specifically immunoprecipitated with MDM2. G, Quantification of tube formation presented that si-FUS could partially rescue the number of tubes through si-MDM2. Data were shown mean ± SD of n > 3/group. H, Transcript level of VEGFA was detected after transfecting si-MDM2. I, Venn diagram demonstrating the overlapping of MDM2 substrate genes and VEGFA relative transcription factors. J, The protein expression of HIF1A was detected in OSCC cells transfected with the si-MDM2. K, Overexpression of MDM2 inhibited HIF1A ubiquitination in 293T cells. L, Western blot analysis showed that the si-FUS could functionally rescue the expression of HIF1A and MDM2 upon circFNDC3B silencing. M, The JASPAR database found a binding site within the HIF1A and VEGFA promoter region. Chromatin immunoprecipitation (ChIP) demonstrated that the HIF1A antibody could be effectively precipitated with the region (−1698 to −1687) of the VEGFA promoter. N and O, Quantification of tube formation (N) and Western blot (O) presented that si-HIF1A could partially rescue the number of tubes and VEGFA expression through LV-MDM2. Data were shown mean ± SD of n > 3/group. P, The pattern diagram of that circFNDC3B in the nucleus might mediate FUS/MDM2 ubiquitination and attenuate MDM2/HIF1A/VEGFA axis in OSCC angiogenesis. *, Statistical significance.
Figure 5.
FUS suppresses the transcription of VEGFA via modulating MDM2–HIF1A interactions. A, After treatment with cycloheximide (CHX; 10 μg/mL) and MG132(10 μg/mL) for indicated times, protein levels of FUS were determined by Western blot analyses of OSCC cells transfected with sh-/LV-circFNDC3B. B, Western blot analysis of ubiquitin immunoprecipitated with anti-HA tag antibodies in 293T cells. C, The UbiBrowser tool identified the E3 ligase that interacts with FUS. D, IP analysis revealed the FUS/MDM2 interaction in HSC3 and CAL27 cells. E, The FUS–MDM2 interaction was decreased in circFNDC3B downregulated HSC3 cells, whereas overexpression of circFNDC3B strengthened the interaction in CAL27 cells. F, Immunoprecipitation analysis determined that FUS 1-269 and Znf domains specifically immunoprecipitated with MDM2. G, Quantification of tube formation presented that si-FUS could partially rescue the number of tubes through si-MDM2. Data are shown as mean ± SD of n > 3/group. H, Transcript level of VEGFA was detected after transfecting si-MDM2. I, Venn diagram demonstrating the overlapping of MDM2 substrate genes and VEGFA relative transcription factors. J, The protein expression of HIF1A was detected in OSCC cells transfected with the si-MDM2. K, Overexpression of MDM2 inhibited HIF1A ubiquitination in 293T cells. L, Western blot analysis showed that the si-FUS could functionally rescue the expression of HIF1A and MDM2 upon circFNDC3B silencing. M, The JASPAR database found a binding site within the HIF1A and VEGFA promoter region. Chromatin immunoprecipitation demonstrated that the HIF1A antibody could be effectively precipitated with the region (−1698 to −1687) of the VEGFA promoter. N and O, Quantification of tube formation (N) and Western blot (O) presented that si-HIF1A could partially rescue the number of tubes and VEGFA expression through LV-MDM2. Data are shown as mean ± SD of n > 3/group. P, The pattern diagram of circFNDC3B in the nucleus might mediate FUS/MDM2 ubiquitination and attenuate MDM2/HIF1A/VEGFA axis in OSCC angiogenesis. *, P < 0.05.
Figure 6. circFNDC3B promotes OSCC metastasis through the miR-181c-5p/Serpine1 pathway. A, The potential target miRNAs of circFNDC3B were predicted using CircInteractome and circMIR. B, RNA pulldown assays revealed that miRNAs directly interact with circFNDC3B in HSC3 and CAL27 cells. C, Expression of miR-181c-5p was detected by qRT-PCR in 104 paired OSCC tissues and normal tissues. D, The survival analysis revealed that lower miR-181c-5p levels were significantly associated with worse RFS. E, Statistics of wound healing, transwell migration, and invasion assays were performed to identify the cell motility upon miR-181c-5p inhibitor or mimics in HSC3 and CAL27 cells. F, Western blot assays detected the expression of EMT markers in HSC3 and CAL27 cells transfected miR-181c-5p inhibitor or mimics. G, Schematic illustration showing potential target genes of miR-181c-5p as predicted by 4 miRNA databases, TCGA-HNSC RNA-seq data, and GSE6550. H, Schematic illustration showed the alignment of miR-181c-5p with Serpine1, and the red portion indicated the mutagenesis nucleotides. Dual luciferase reporter assays of miR-181c-5p with Serpine1 were performed. I, The correlation between circFNDC3B expression and IHC score of serpine1 was determined. J and K, Quantification of wound healing, transwell invasion assays (J) and Western blot (K) presented that miR-181c-5p inhibitor could partially rescue the cell motility, and the expression of EMT markers, MTDH and Serpine1 through si-circFNDC3B, respectively. Data were shown mean ± SD of n > 3/group. *, Statistical significance. Scale bar, 100 μm (I).
Figure 6.
circFNDC3B promotes OSCC metastasis through the miR-181c-5p/Serpine1 pathway. A, The potential target miRNAs of circFNDC3B were predicted using CircInteractome and circMIR. B, RNA pulldown assays revealed that miRNAs directly interact with circFNDC3B in HSC3 and CAL27 cells. C, Expression of miR-181c-5p was detected by qRT-PCR in 104 paired OSCC tissues and normal tissues. D, The survival analysis revealed that lower miR-181c-5p levels were significantly associated with worse RFS. E, Statistics of wound healing, transwell migration, and invasion assays were performed to identify the cell motility upon miR-181c-5p inhibitor or mimics in HSC3 and CAL27 cells. F, Western blot assays detected the expression of EMT markers in HSC3 and CAL27 cells transfected miR-181c-5p inhibitor or mimics. G, Schematic illustration showing potential target genes of miR-181c-5p as predicted by four miRNA databases, TCGA-HNSC RNA sequencing (RNA-seq) data, and GSE6550. H, Schematic illustration showed the alignment of miR-181c-5p with Serpine1, and the red portion indicated the mutagenesis nucleotides. Dual luciferase reporter assays of miR-181c-5p with Serpine1 were performed. I, The correlation between circFNDC3B expression and IHC score of serpine1 was determined. Scale bar, 100 μm. J and K, Quantification of wound healing, transwell invasion assays (J), and Western blot (K) presented that miR-181c-5p inhibitor could partially rescue the cell motility and the expression of EMT markers, MTDH and Serpine1 through si-circFNDC3B, respectively. Data were shown mean ± SD of n > 3/group. *, P < 0.05.
Figure 7. circFNDC3B promotes lymphangiogenesis via the miR‑181c‑5p/PROX1 axis in OSCC. A–C, The conditioned medium from miR-181c-5p inhibitor OSCC cells was dramatically beneficial to the proliferation (A), migration (B), and tube formation (C) of HLECs, whereas the miR-181c-5p mimics group had the opposite results. D, The protein expression of VEGFC, PROX1, and ESM1 in HSC3 and CAL27 cells with miR-181c-5p inhibitor or mimics transfection was detected by Western blot. E, Dual luciferase reporter assays showed the luciferase activity of WT or MUT PROX1 and ESM1 following cotransfection with miR-181c-5p mimics or NC. Relative firefly luciferase expression was normalized to that of Renilla luciferase. F, The mRNA expression of PROX1 and ESM1 in HSC3 and CAL27 cells with miR-181c-5p inhibitor or mimics transfection was detected by qRT-PCR. G–I, EdU (G), transwell migration assays (H) and tube formation (I) presented that the conditioned medium from miR-181c-5p inhibitor could partially rescue proliferation, migration, and tube formation of HLEC cocultured with the conditioned medium from si-circFNDC3B, respectively. J, Western blot analysis of ESM1, PROX1, and VEGFC. Data were presented as the mean ± SEM from three independent experiments. *, Statistical significance. Scale bars, 100 μm (A, H, and I).
Figure 7.
circFNDC3B promotes lymphangiogenesis via the miR-181c-5p/PROX1 axis in OSCC. A–C, The conditioned medium from miR-181c-5p inhibitor OSCC cells was dramatically beneficial to the proliferation (A), migration (B), and tube formation (C) of HLECs, whereas the miR-181c-5p mimics group had the opposite results. D, The protein expression of VEGFC, PROX1, and ESM1 in HSC3 and CAL27 cells with miR-181c-5p inhibitor or mimics transfection was detected by Western blot. E, Dual luciferase reporter assays showed the luciferase activity of WT or MUT PROX1 and ESM1 following cotransfection with miR-181c-5p mimics or NC. Relative firefly luciferase expression was normalized to that of Renilla luciferase. F, The mRNA expression of PROX1 and ESM1 in HSC3 and CAL27 cells with miR-181c-5p inhibitor or mimics transfection was detected by qRT-PCR. GI, EdU (G), transwell migration assays (H), and tube formation (I) presented that the conditioned medium from miR-181c-5p inhibitor could partially rescue proliferation, migration, and tube formation of HLEC cocultured with the conditioned medium from si-circFNDC3B, respectively. J, Western blot analysis of ESM1, PROX1, and VEGFC. Data are presented as the mean ± SEM from three independent experiments. *, P < 0.05. Scale bars, 100 μm (A, H, and I).
Figure 8. circFNDC3B enhances OSCC metastasis and associated neovascularization in vivo. A, Schematic diagram of an animal model to study LN metastasis of OSCC. B, Representative images of cervical LNs. C, IHC staining of LN micrometastases. D, H&E staining of tongue tumor. E and F, Immunofluorescence staining of angiogenesis (white arrow; E) and lymphangiogenesis (yellow arrow; F) in the tongue tumor microenvironment. Yellow dashed lines demarcate the boundary of tumor. G, Schematic illustration showing the suggested mechanism by which circFNDC3B functions as an oncogene for OSCC angiogenesis, metastasis, and lymphangiogenesis through the FUS/MDM2/HIF1A/VEGFA axis, and contributes as a miR-181c-5p sponge to upregulate Serpine1 and PROX1, respectively. *, Statistical significance. Scale bars, 100 μm (C and D) and 50 μm (E and F).
Figure 8.
circFNDC3B enhances OSCC metastasis and associated neovascularization in vivo. A, Schematic diagram of an animal model to study LN metastasis of OSCC. B, Representative images of cervical LNs. C, IHC staining of LN micrometastases. D, Hematoxylin and eosin staining of tongue tumor. E and F, Immunofluorescence staining of angiogenesis (white arrow; E) and lymphangiogenesis (yellow arrow; F) in the tongue tumor microenvironment. Yellow dashed lines demarcate the boundary of tumor. G, Schematic illustration showing the suggested mechanism by which circFNDC3B functions as an oncogene for OSCC angiogenesis, metastasis, and lymphangiogenesis through the FUS/MDM2/HIF1A/VEGFA axis and contributes as a miR-181c-5p sponge to upregulate Serpine1 and PROX1, respectively. *, P, 0.05. ns, no statistical significance. Scale bars, 100 μm (C and D) and 50 μm (E and F).

References

    1. Sung H, Ferlay J, Siegel RL, Laversanne M, Soerjomataram I, Jemal A, et al. . Global cancer statistics 2020: GLOBOCAN estimates of incidence and mortality worldwide for 36 cancers in 185 countries. CA Cancer J Clin 2021;71:209–49. - PubMed
    1. Liu J, Jiang X, Zou A, Mai Z, Huang Z, Sun L, et al. . circIGHG-induced epithelial-to-mesenchymal transition promotes oral squamous cell carcinoma progression via miR-142–5p/IGF2BP3 signaling. Cancer Res 2021;81:344–55. - PubMed
    1. Miyauchi S, Kim SS, Pang J, Gold KA, Gutkind JS, Califano JA, et al. . Immune modulation of head and neck squamous cell carcinoma and the tumor microenvironment by conventional therapeutics. Clin Cancer Res 2019;25:4211–23. - PMC - PubMed
    1. SH J, Hysi D. Methods and risk of bias in molecular marker prognosis studies in oral squamous cell carcinoma. Oral Dis 2018;24:115–19. - PubMed
    1. Dieterich LC, Tacconi C, Ducoli L, Detmar M. Lymphatic vessels in cancer. Physiol Rev 2022;102:1837–79. - PubMed

Publication types

MeSH terms