. 2023 Feb 28;120(9):e2214921120.
doi: 10.1073/pnas.2214921120. Epub 2023 Feb 22.

Exploiting the intrinsic misfolding propensity of the KRAS oncoprotein

Affiliations

Exploiting the intrinsic misfolding propensity of the KRAS oncoprotein

Kobe Janssen et al. Proc Natl Acad Sci U S A. .

Abstract

Mutant KRAS is a major driver of oncogenesis in a multitude of cancers but remains a challenging target for classical small molecule drugs, motivating the exploration of alternative approaches. Here, we show that aggregation-prone regions (APRs) in the primary sequence of the oncoprotein constitute intrinsic vulnerabilities that can be exploited to misfold KRAS into protein aggregates. Conveniently, this propensity that is present in wild-type KRAS is increased in the common oncogenic mutations at positions 12 and 13. We show that synthetic peptides (Pept-ins™) derived from two distinct KRAS APRs could induce the misfolding and subsequent loss of function of oncogenic KRAS, both of recombinantly produced protein in solution, during cell-free translation and in cancer cells. The Pept-ins exerted antiproliferative activity against a range of mutant KRAS cell lines and abrogated tumor growth in a syngeneic lung adenocarcinoma mouse model driven by mutant KRAS G12V. These findings provide proof-of-concept that the intrinsic misfolding propensity of the KRAS oncoprotein can be exploited to cause its functional inactivation.

Keywords: KRAS; oncogene; peptide; protein aggregation; protein folding.


Conflict of interest statement

The authors have organizational affiliations and stock ownership to disclose F.R. and J.S. are scientific founders of Aelin Therapeutics and members of its scientific advisory board and own stock options of Aelin Therapeutics. E.B., B.S., F.C., V.L.W. and D.V.d.V. are employees of Aelin Therapeutics and own stock options of Aelin Therapeutics. The authors have patent filings to disclose, F.R. and J.S. are listed as inventors of patents filed by VIB/KU Leuven/UGent/VUB and licensed to Aelin Therapeutics describing the TPA technology. The Pept-ins described in this manuscript are included in patents filed by Aelin Therapeutics and VIB/KU Leuven with F.C., E.B., J.S. and F.R. listed as inventors.

Figures

Fig. 1.
Fig. 1.
Aggregation tendency and intrinsic stability of KRAS WT and mutants. (A) Predicted aggregation tendency shown as TANGO score per residue of KRAS4b WT (Uniprot P01116-2) and mutants. (B) Zoom on TANGO predicted aggregation tendency of APR1. (C) KRAS missense mutational spectrum from The Cancer Genome Atlas (TCGA) (n = 790, Data release 21.0). (D) Structure of KRAS displaying the APRs (green) and Switch I & II regions (yellow). PDB 6GOD (KRAS full length WT GPPNHP). (E) Stretch-plot showing aggregation propensity (TANGO) and free energy contribution (ΔGContrib) of each APR in WT and mutant KRAS. (F) Mutant Aggregation and Stability Spectrum (MASS) plot displaying changes in free energy (ΔΔG) and aggregation propensity (ΔTANGO) between WT and different KRAS mutants for GTP- (PDBs 6GOD and 5VQ2) and GDP-bound structures (PDBs 4OBE and 5W22). (G) Solubility after 7 d at 37 °C in Dulbecco's phosphate-buffered saline (DPBS) of peptides covering the N-terminal region (res. 1 to 16) of KRAS WT and mutants. Peptide WT_PD has two aggregation-breaking mutations (Pro and Asp) in the WT sequence. Soluble fraction after 7 d normalized to freshly dissolved at day 1. n = 3, mean ± SD, one-way ANOVA with Dunnett’s multiple comparisons test. ns, not significant, ***P < 0.001, ****P < 0.0001. (HJ) Protein stability of KRAS WT and G12V. Concentration is 1 mg/mL in Tris buffer (20 mM Tris, pH 7.8, 150 mM NaCl, 5 mM MgCl2, 10% glycerol). Ramp rate 0.3 °C/min. (H) Unfolding fluorescence as barycentric mean and static light scattering at 266 nm for KRAS WT and G12V. Representative plots from one protein batch with six replicates. See SI Appendix, Fig. S2A for other mutants. (I) Melting vs. aggregation temperature for KRAS WT and mutants. (J) Detailed overview of TANGO predicted aggregation propensity of APR1 of WT and mutant KRAS and measured protein stability of purified KRAS protein. mean ± SD from measurements of two independent protein productions with at least four replicates per batch.
Fig. 2.
Fig. 2.
Design and characterization of Pept-ins derived from KRAS APRs. (A) Overview of Pept-ins derived from KRAS APRs. The normalized TANGO score is the total TANGO devided by peptide length. Pept-ins are given a color to ease comparison in following graphs. (B) Pept-in aggregation over time monitored using the amyloid-binding dye Th-T (Ex 440/Em 480, readout every 5 min). Pept-in concentration is 100 μM final concentration in DPBS. Representative plot showing two repeats per Pept-in. (C) Maximum Th-T values per Pept-in from (B). n = 6 from three independent experiments, mean ± SD, Repeated measures (RM) one-way ANOVA with Dunnett’s multiple comparison test. ns, not significant, **P < 0.01***P < 0.001. (D) TEM images of samples after 24-h incubation at 100 μM in DPBS. (E) Pept-in solubility measured after 24-h and 48-h incubation at 37 °C in DPBS. n = 3, mean ± SEM. (F) Th-T fluorescence over time of KRAS WT and G12V protein mixed with Pept-in seeds from Hepes stocks (9:1 molar ratio of protein to seeds). Unrelated TEM protein mixed with and without Pept-in seeds and Pept-in seeds alone are shown as controls. n = 6 from three independent experiments. Plots show mean of one representative experiment with duplicates. (G) Th-T fluorescence of KRAS WT and G12V protein and TEM protein mixed with freshly dissolved Pept-in (9:1 molar ratio of protein to Pept-in). Plot shows mean of n = 3. (H) FTIR spectra of KRAS WT and G12V protein incubated 5 h at 37 °C with 033 seeds from Hepes stocks (1:1 molar ratio of protein and seeds). (I) Results of in vitro translation of KRAS WT and mutants in the presence of biotin-labeled Pept-in (10 μM) for 2 h at 37 °C followed by pull-down using streptavidin-coated beads. Input (before pull-down) and streptavidin IP fractions are shown. Results are shown from one experiment of n = 3. SI Appendix, Fig. S4J shows another independent repeat.
Fig. 3.
Fig. 3.
KRAS-Pept-in target engagement and cellular effects. (A) Streptavidin pull-down and detection of KRAS protein in lysate of NCI-H441 cells. Cells were treated 16 h with 25 μM biotinylated Pept-in versions or vehicle. Input represents lysate fraction before pull-down. (B) Quantification of KRAS pull-downs in (A). Ratio of KRAS signal detected in streptavidin IP over input. n = 3, mean ± SD. (C) KRAS protein levels in soluble (s) and pellet (p) lysate fraction of NCI-H441 treated with 10 μM Pept-in or vehicle for 24 h. HSP70 detected in pellet. Cleaved PARP and housekeeping GAPDH detected in soluble lysate fraction. DsiRNA controls represent cells transfected with 10 nM DsiRNA NC control and three KRAS targeting DsiRNAs at timepoint 0. Quantifications of blots in SI Appendix, Fig. S7C. (D) Caspase-3/7 activity in NCI-H441 cells after 24-h treatment with 10 μM Pept-ins or vehicle. 500 nM staurosporine was included as assay control. Signal normalized to respective controls; vehicle for Pept-ins, DMSO for Staurosporine. n = 5, mean ± SD, Kruskal–Wallis with Dunn’s multiple comparison test to test Pept-in normalized to vehicle. *P < 0.05, **P < 0.01. (E) KRAS protein levels in soluble (s) and pellet (p) lysate fraction of NCI-H1299 treated with 10 μM Pept-in or vehicle for 24 h. HSP70 detected in pellet. Cleaved PARP and housekeeping GAPDH detected in soluble lysate fraction. DsiRNA controls represent cells transfected with DsiRNA (15 nM NC control and mix of three KRAS targeting, 5 nM each) at timepoint 0. Quantifications of blots in SI Appendix, Fig. S7D. (F) KRAS, GAPDH, p-ERK1/2 (Thr202/Tyr204), total ERK1/2, p-AKT (S473) and total AKT protein levels in lysates of NCI-H441 treated with indicated concentrations of Pept-in for 24 h. DsiRNA controls are the same as in (C). Quantifications of blots in SI Appendix, Fig. S7F. (G) MSD immunoassay quantification of p-AKT (S473) inhibition in NCI-H441 after 24-h treatment with Pept-in or DsiRNA, same as (E). Dose–responses of all Pept-ins. n = 3, mean ± SD, one-way ANOVA with Dunnett’s multiple comparison test. ns, not significant, ***P < 0.001, ****P < 0.0001. (H) MSD assay on SW620, HeLa and NCI-H1299 cells after 24-h treatment with 10 μM. n ≥ 3, mean ± SD, one-way ANOVA with Dunnett’s multiple comparison test. ns not significant, *P < 0.05, **P < 0.01, ****P < 0.0001.
Fig. 4.
Fig. 4.
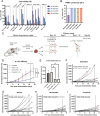
Anticancer activity of Pept-ins. (A) IC50 values of cancer cell line viability in 3D assay. Cell viability read-out after 5 d. Data represent mean ± SD from at least two independent experiments with two technical replicates per condition. (B) Cytotoxicity assay on peripheral blood mononuclear cells after 24-h treatment. Data from three independent experiments with two technical replicates, except Pept-in 016 (1 experiment with 2 replicates). (C) Illustration of mouse model and efficacy study. Created with BioRender.com. (D) Mice with subcutaneous KRAS-driven tumor received daily subcutaneous injections for 21 d of 20 mg/kg Pept-in or vehicle. Positive control cohort received daily 3 mg/kg Trametinib via oral administration. One group received no treatment. Tumor volumes were measured every 3 or 4 d. Each treatment group contains eight animals. Mice were killed when ethical abortion criteria were met during the study. Last observations were carried forward in case an individual was killed before end of study. Tumor volumes are normalized to day 0 (100%). Data represent mean ± SEM. Statistics represent a longitudinal analysis (mixed linear model) using type II ANOVA and pairwise comparisons with Bonferroni correction, *P < 0.05. (E) Cross-sectional analysis of normalized tumor size at last treatment day 21. Last observations were carried forward in case an individual was euthanized before end of study. (n = 8 per group; data represent mean ± SEM). One-way ANOVA with Dunnett’s multiple comparisons test, *P < 0.05. (FI) Normalized tumor growth per mouse in each treatment group. Death markers indicate reason of an individual’s killing.

References

    1. Esteras-Chopo A., Serrano L., Lopez de la Paz M., The amyloid stretch hypothesis: Recruiting proteins toward the dark side. Proc. Natl. Acad. Sci. U.S.A. 102, 16672–16677 (2005), 10.1073/pnas.0505905102. - DOI - PMC - PubMed
    1. Ventura S., et al. , Short amino acid stretches can mediate amyloid formation in globular proteins: The Src homology 3 (SH3) case. Proc. Natl. Acad. Sci. U.S.A. 101, 7258–7263 (2004), 10.1073/pnas.0308249101. - DOI - PMC - PubMed
    1. Chiti C. M., Dobson, Amyloid formation by globular proteins under native conditions. Nat. Chem. Biol. 5, 15–22 (2009), 10.1038/nchembio.131. - DOI - PubMed
    1. Hartl M., Hayer-Hartl, converging concepts of protein folding in vitro and in vivo. Nat. Struct. Mol. Biol. 16, 574–581 (2009), 10.1038/nsmb.1591. - DOI - PubMed
    1. Langenberg T., et al. , Thermodynamic and evolutionary coupling between the native and amyloid state of globular proteins. Cell Reports 31 (2020), 10.1016/j.celrep.2020.03.076. - DOI - PMC - PubMed

Publication types

Substances