. 2023 Feb 22;9(8):eade2540.
doi: 10.1126/sciadv.ade2540. Epub 2023 Feb 22.

Regulation of cargo exocytosis by a Reps1-Ralbp1-RalA module

Affiliations

Regulation of cargo exocytosis by a Reps1-Ralbp1-RalA module

Shifeng Wang et al. Sci Adv. .

Abstract

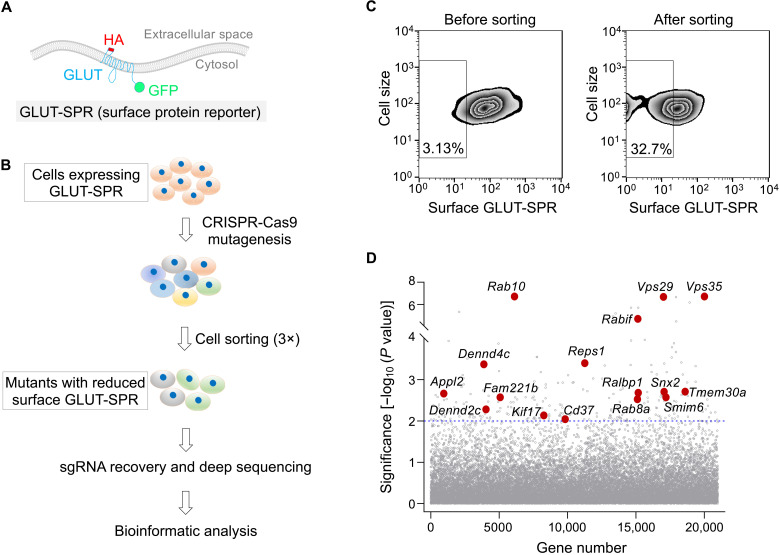
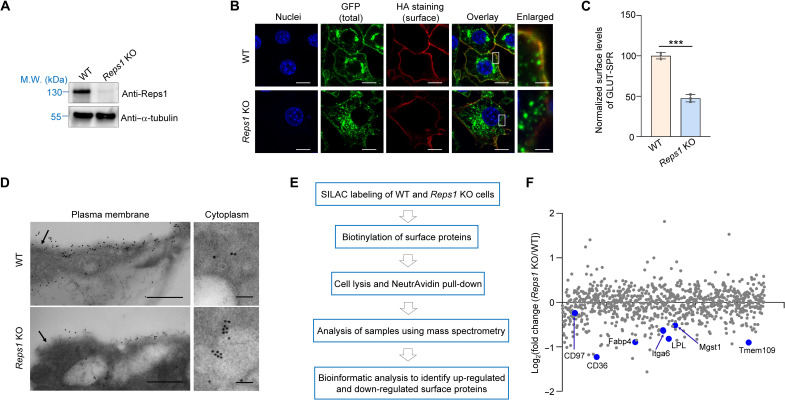
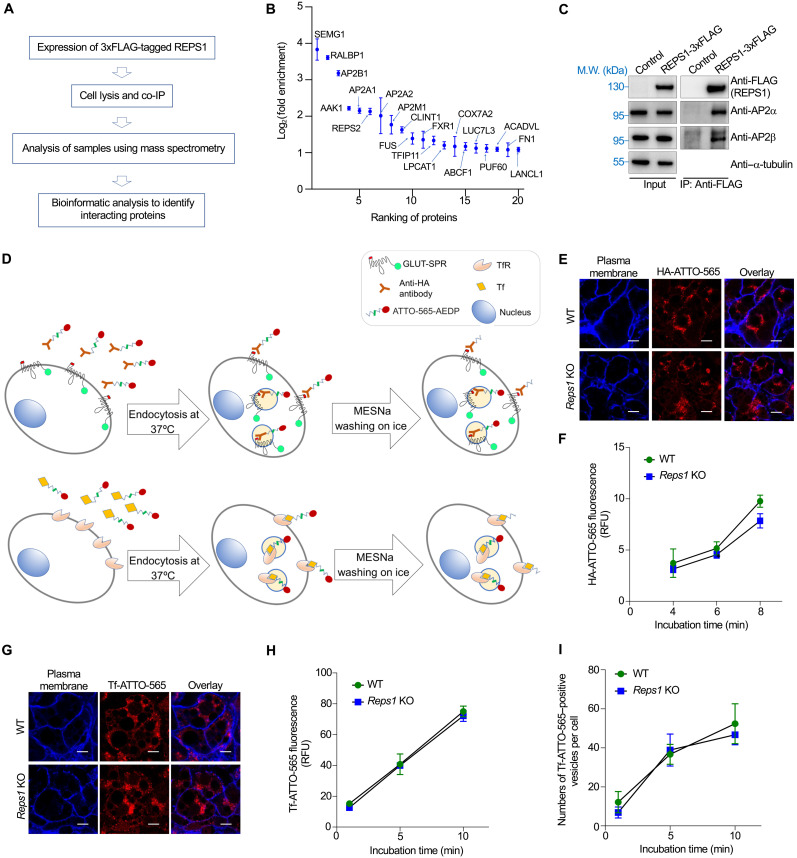
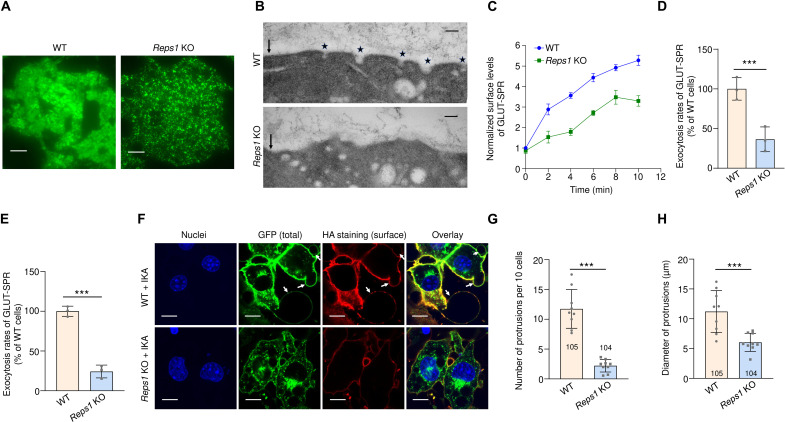
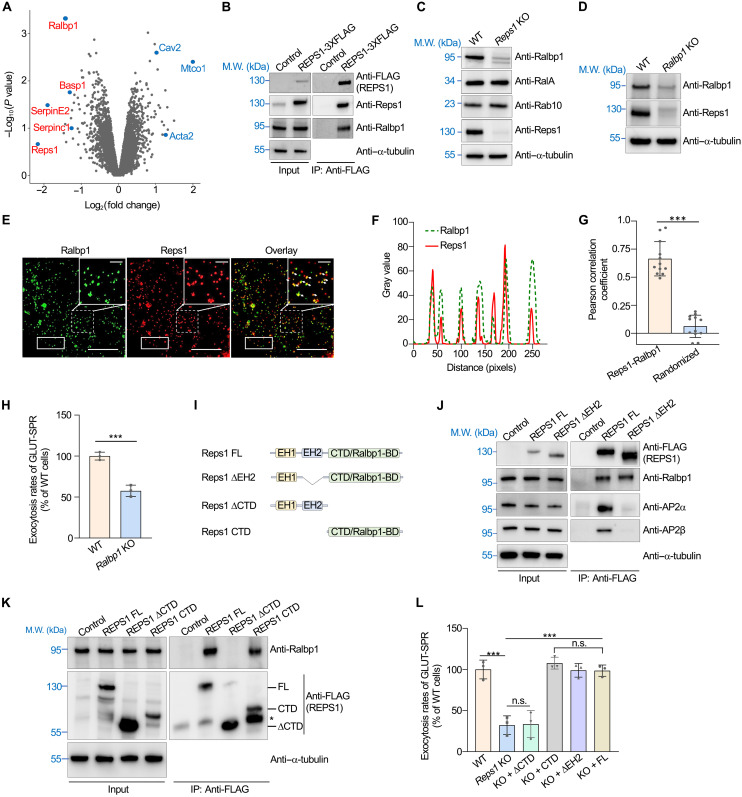
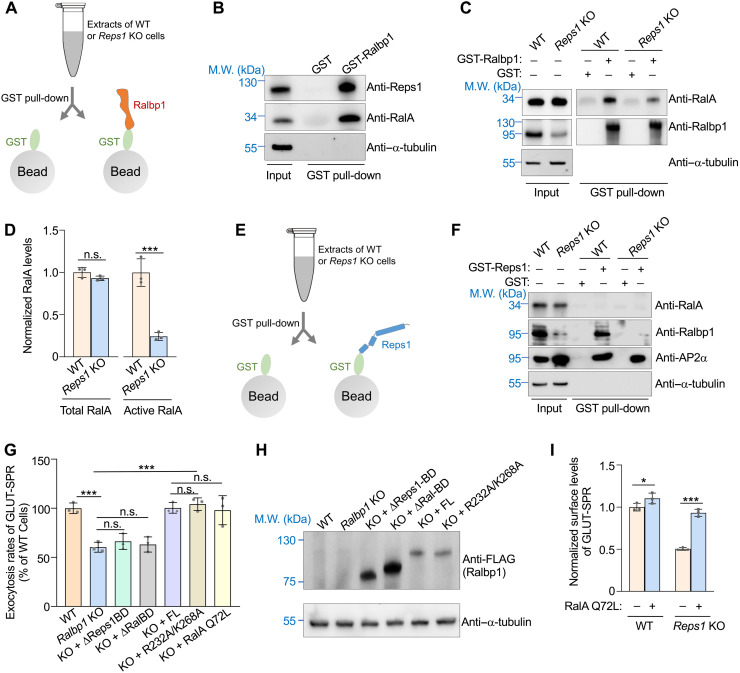
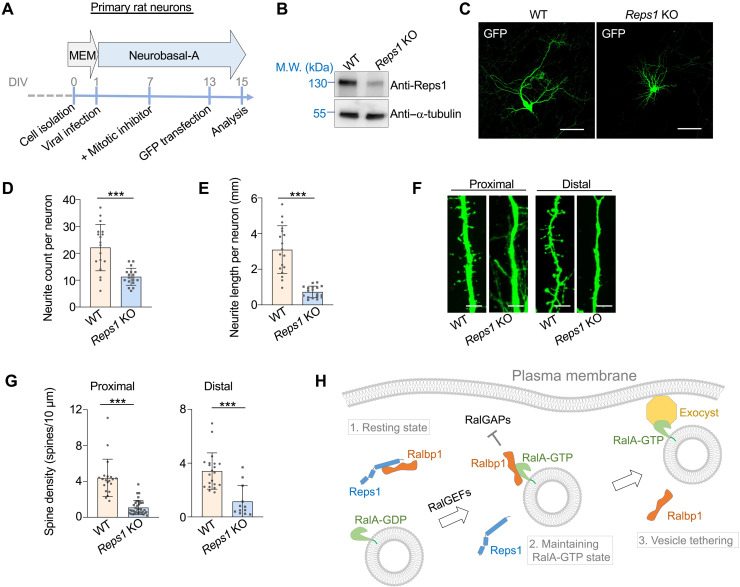
Surface levels of membrane proteins are determined by a dynamic balance between exocytosis-mediated surface delivery and endocytosis-dependent retrieval from the cell surface. Imbalances in surface protein levels perturb surface protein homeostasis and cause major forms of human disease such as type 2 diabetes and neurological disorders. Here, we found a Reps1-Ralbp1-RalA module in the exocytic pathway broadly regulating surface protein levels. Reps1 and Ralbp1 form a binary complex that recognizes RalA, a vesicle-bound small guanosine triphosphatases (GTPase) promoting exocytosis through interacting with the exocyst complex. RalA binding results in Reps1 release and formation of a Ralbp1-RalA binary complex. Ralbp1 selectively recognizes GTP-bound RalA but is not a RalA effector. Instead, Ralbp1 binding maintains RalA in an active GTP-bound state. These studies uncovered a segment in the exocytic pathway and, more broadly, revealed a previously unrecognized regulatory mechanism for small GTPases, GTP state stabilization.


Figures

Fig. 1.
Fig. 1.. Identification of genes involved in surface protein homeostasis using a genome-wide CRISPR genetic screen.
(A) Diagram of the surface protein reporter GLUT-SPR (HA-GLUT4-GFP) used in the CRISPR screen. The reporter is based on the multitransmembrane glucose transporter GLUT4. (B) Illustration of the genome-wide genetic screen to identify genes required for maintaining the surface levels of GLUT-SPR. (C) Flow cytometry analysis of the starting CRISPR library of preadipocyte fibroblasts (left) and the final population after three rounds of sorting (right) in the genome-wide CRISPR screen. GLUT-SPR molecules on the cell surface were labeled using anti-HA antibodies and allophycocyanin (APC)–conjugated secondary antibodies. APC and GFP fluorescence was measured by flow cytometry and used to calculate relative surface levels of the reporter. (D) Ranking of genes in the CRISPR screen based on their P values. Each dot represents a gene. A P value of 0.01 is set as the cutoff (shown as a horizontal dotted line). Selected genes are labeled. Full datasets of the CRISPR screen are included in tables S1 and S2. sgRNA, single-guide RNA.
Fig. 2.
Fig. 2.. Reps1 plays a critical role in maintaining surface protein homeostasis.
(A) Representative immunoblots showing the expression of the indicated proteins in WT and Reps1 KO adipocytes. M.W., molecular weight. (B) Representative confocal images showing the localization of GLUT-SPR (depicted in Fig. 1A) in unpermeabilized WT and Reps1 KO adipocytes. Before harvesting, cells were switched to culture media containing 20 nM insulin to mimic a physiological fed state. After 20 min, surface reporters were labeled using anti-HA antibodies and Alexa Fluor 568–conjugated secondary antibodies. Scale bars, 10 μm (1 μm for the enlarged images on the right). (C) Flow cytometry measurements of surface GLUT-SPR in cells described in (B). Data of mutant cells were normalized to those of WT cells. Data are presented as means ± SD of three biological replicates. ***P < 0.001 (calculated using Student’s t test). In all figures, data normalization was performed by setting the mean value of WT data points as 100 or 1, and all data points including WT ones were normalized to that mean value. (E) Electron micrographs of GLUT-SPR distribution in WT and Reps1 KO adipocytes. Cells were cultured as in (B) and frozen in acetone containing 0.25% glutaraldehyde and 0.1% uranyl acetate. Cell sections were stained with anti-GFP antibodies and gold-conjugated secondary antibodies. Arrows point to the plasma membrane. Direct magnification: ×49,000. Scale bars, 500 (left) and 100 nm (right). (E) Procedure of mass spectrometry–based surface proteomic analysis of WT and Reps1 KO cells. (F) Scatter plot showing adjusted fold changes of surface protein levels (Reps1 KO/WT) in mouse adipocytes. To calculate the adjusted values, fold changes of surface protein levels were divided by those of total protein levels based on whole-cell proteomic data shown in table S5.Selected down-regulated surface proteins are labeled. Full datasets are shown in table S3. In addition, see figs. S1 to S3.
Fig. 3.
Fig. 3.. Reps1 is dispensable for CME-mediated cargo internalization.
(A) Proteomic analysis procedure of Reps1-interacting proteins in HeLa cells. (B) Scatter plot showing the top proteins enriched in 3xFLAG-tagged REPS1 immunoprecipitates compared to the control sample. Error bars indicate SD of biological duplicates. Full datasets are included in table S4. (C) Representative immunoblots showing the interaction of REPS1 with AP2 adaptor. The 3xFLAG-tagged REPS1 protein was stably expressed in preadipocytes and immunoprecipitated using anti-FLAG antibodies. Control cells were transfected with an empty vector. IP, immunoprecipitation. (D) Diagrams of assays measuring the endocytosis of GLUT-SPR (top) and Tf (bottom). (E) Representative confocal images showing GLUT-SPR endocytosis. Cells were incubated with ATTO-565–conjugated anti-HA antibodies (HA-ATTO-565; 1 μg/ml) for 8 min at 37°C. After MESNa treatment on ice, cells were fixed and labeled with CF405M-conjugated concanavalin A (50 μg/ml). Scale bars, 10 μm. (F) Flow cytometry analysis of HA-ATTO-565 endocytosis. Cells were incubated with ATTO-565–conjugated anti-HA antibodies (HA-ATTO-565; 1 μg/ml) at 37°C for the indicated durations. After washing with MESNa, cells were disassociated using Accutase and analyzed using flow cytometry. Error bars indicates SD, n = 3. RFU, relative fluorescence unit. (G) Representative confocal images showing the endocytosis of ATTO-565–conjugated Tf (Tf-ATTO-565) into WT or Reps1 KO adipocytes. Cells were incubated with Tf-ATTO-565 (5 μg/ml) at 37°C for 10 min before the cells were harvested and processed as in (E). Scale bars, 10 μm. (H) Time course of Tf-ATTO-565 endocytosis into WT or Reps1 KO adipocytes measured by flow cytometry. Error bars indicate SD, n = 3. (I) Tf-ATTO-565 endocytosis was performed as in (G), and Tf-ATTO-565–positive endocytic vesicles were quantified on the basis of confocal images. About 100 cells from seven fields were analyzed for each sample. Error bars indicate SD of different fields.
Fig. 4.
Fig. 4.. Reps1 promotes cargo exocytosis.
(A) Representative TIRFM images of GLUT-SPR in WT and Reps1 KO adipocytes. Cells were cultured as in Fig. 2B, and GLUT-SPR on and near the plasma membrane was visualized using TIRFM. Scale bars, 10 μm. (B) Representative transmission electron microscopy (TEM) images showing vesicles near the plasma membrane in WT and Reps1 KO adipocytes. Cells were cultured as in Fig. 2B, and 80-nm sections of cells were visualized using TEM without staining. Arrows point to the plasma membrane, whereas stars point to vesicles fusing with the plasma membrane. Direct magnification: ×68,000. Scale bars, 100 nm. (C) Time course of GLUT-SPR surface levels in WT and Reps1 KO adipocytes. Cells were cultured as in (B), and surface reporter levels were measured using flow cytometry after the indicated periods in insulin-containing media. (D) Normalized initial exocytosis rates of the reporter based on data in (C). Data are presented as means ± SD of three biological replicates. ***P < 0.001 (calculated using Student’s t test). (E) Normalized initial exocytosis rates of GLUT-SPR in the presence of IKA. Experiments were carried out and analyzed as in (C) and (D) except that 4 μM IKA was included. (F) Representative confocal images showing the GLUT-SPR reporter in WT and Reps1 KO adipocytes. Cells were cultured as in Fig. 2B and incubated with 4 μM IKA for 20 min before cell harvesting. Arrows point to protrusions emanating from the plasma membrane. Scale bars, 25 μm. (G and H) Quantification of the number and diameter of protrusions in WT and Reps1 KO adipocytes based on nine confocal images from three independent experiments. Numbers of cells analyzed are indicated on the graphs. Error bars indicate SD. ***P < 0.001 (calculated using Student’s t test). Also, see fig. S4.
Fig. 5.
Fig. 5.. Reps1 acts in concert with Ralbp1 to regulate exocytosis.
(A) Whole-cell proteomic analysis to identify proteins down-regulated or up-regulated in Reps1 KO cells. Full datasets are shown in table S5. (B) Representative immunoblots showing the interaction of Reps1 with Ralbp1. The 3xFLAG-tagged REPS1 protein was stably expressed in preadipocytes and immunoprecipitated using anti-FLAG antibodies. Control cells were transfected with an empty vector. (C and D) Representative immunoblots showing the expression of the indicated proteins. (E) Representative SIM images showing the subcellular localization of Reps1 and Ralbp1. The 3xFLAG-tagged Reps1 protein was stably expressed in HeLa cells and stained using anti-FLAG antibodies, whereas endogenous Ralbp1 was stained using anti-Ralbp1 antibodies. Scale bars, 2 μm for main images and 1 μm for enlarged images. (F) Profile analysis plot comparing the distributions of Ralbp1 and Reps1 within the rectangular areas of (E). (G) Quantification of Ralbp1-Reps1 colocalization using the Pearson correlation coefficient. Images were captured as in (E) and analyzed using Image J. Each dot represents data of an individual cell. In randomized images, Reps1 images were rotated 90° clockwise, whereas Ralbp1 images were not rotated. (H) Normalized initial exocytosis rates of GLUT-SPR. Error bars indicate SD, n = 3. ***P < 0.001 (calculated using Student’s t test). (I) Diagrams of FL and mutant Reps1. (J and K) Representative immunoblots showing protein expression and the interactions of REPS1 with Ralbp1 and AP2 adaptor. The asterisk denotes a possible degradation product of Reps1 CTD. (L) Normalized initial exocytosis rates of GLUT-SPR. Error bars represent SD, n = 3. ***P < 0.001; not significant (n.s.), P > 0.05 [calculated using one-way analysis of variance (ANOVA)]. In addition, see fig. S5.
Fig. 6.
Fig. 6.. Reps1 and Ralbp1 maintain RalA in an active state.
(A) Illustration of GST pull-down assays measuring interactions of Ralbp1 with Reps1 and RalA. (B) Representative immunoblots detecting proteins pulled down from WT adipocytes using GST or GST-Ralbp1. (C) Representative immunoblots detecting proteins pulled down from WT or Reps1 KO adipocytes using GST or GST-Ralbp1. (D) Quantification of total and active RalA proteins in WT and Reps1 KO adipocytes. Ralbp1, which selectively binds active GTP-bound RalA, was used to pull down active RalA proteins from cell extracts. Intensities of proteins on immunoblots were quantified using ImageJ and normalized to those of α-tubulin. Data of Reps1 KO samples were normalized to those of WT cells. Error bars represent SD, n = 3. ***P < 0.001; n.s., P > 0.05 (calculated using Student’s t test). (E) Illustration of GST pull-down assays measuring interactions of Reps1 with Ralbp1 and RalA. (F) Representative immunoblots detecting proteins pulled down from WT or Reps1 KO adipocytes using GST or GST-Reps1. (G) Normalized initial exocytosis rates of GLUT-SPR in WT and Ralbp1 KO adipocytes. Error bars indicate SD, n = 3. ***P < 0.001 (calculated using one-way ANOVA). (H) Representative immunoblots showing the expression of the indicated proteins. (I) Normalized surface levels of GLUT-SPR in WT or Reps1 KO adipocytes stably expressing the constitutively active RalA Q72L mutant. The cells were cultured and labeled as in Fig. 2C. Error bars indicate SD, n = 3. *P < 0.05 and ***P < 0.001 (calculated using two-way ANOVA).
Fig. 7.
Fig. 7.. Reps1 is essential to neurite outgrowth in CAD neurons.
(A) Diagram illustrating the differentiation of CAD neurons. (B) Representative immunoblots showing the expression of the indicated proteins. (C) Staining of Map2 in the indicated CAD neurons. Scale bars, 100 μm. (D and E) Quantification of neurite number and total neurite length per CAD neuron. Neurites were traced on the basis of Map2 staining and processed using the NeuronJ plugin for Fiji. A total of 80 WT cells, 93 Reps1 KO cells, and 95 cells of Reps1 KO with a rescue gene were analyzed from nine fields each. Error bars indicate SD of different fields. ***P < 0.001 (calculated using one-way ANOVA). (F) Staining of SNAP-25 in the indicated CAD neurons. Scale bars, 100 μm. (G and H) Quantification of neurite number and total neurite length per cell in WT and Reps1 KO CAD neurons. Neurites were traced and analyzed on the basis of SNAP-25 staining. A total of 106 WT cells and 103 Reps1 KO cells were analyzed from nine fields each. Error bars indicate SD of different fields. ***P < 0.001 (calculated using Student’s t test). In addition, see fig. S6.
Fig. 8.
Fig. 8.. Reps1 is essential to neurite outgrowth in primary neurons.
(A) Schematic illustration of culturing primary rat hippocampal neurons. DIV: days in vitro. (B) Representative immunoblots showing the expression of the indicated proteins. (C) Representative images showing GFP-labeled WT and Reps1 KO rat hippocampal neurons. Cells were transiently transfected using a GFP-encoding plasmid. After 48 hours, cells were fixed and visualized using a 20× objective. Only a small number of neurons were GFP+ such that the morphologies of individual neurons were readily discerned. (D and E) Quantification of neurite number and total neurite length per cell in WT or Reps1 KO rat hippocampal neurons based on GFP labeling. A total of 23 WT neurons and 21 Reps1 KO primary neurons were analyzed from 20 fields each. Error bars indicate SD of different fields. ***P < 0.001 (calculated using Student’s t test). (F) Representative images showing reconstructed dendrites of rat hippocampal neurons. Z-stacking was performed at 1 μm per step. Scale bars, 5 μm. (G) Quantification of spine densities located at proximal or distal dendrites of WT and Reps1 KO primary neurons. Error bars indicate SD of different dendritic segments from 12 WT neurons from 12 fields and 11 Reps1 KO neurons from 11 fields. ***P < 0.001 (calculated using Student’s t test). (H) Model depicting the function of the Reps1-Ralbp1-RalA module in exocytosis. For simplicity, other effectors of RalA such as motor proteins are not shown (75).

Similar articles

Cited by

References

    1. J. S. Bonifacino, B. S. Glick, The mechanisms of vesicle budding and fusion. Cell 116, 153–166 (2004). - PubMed
    1. D. Bausch-Fluck, U. Goldmann, S. Müller, M. van Oostrum, M. Müller, O. T. Schubert, B. Wollscheid, The in silico human surfaceome. Proc. Natl. Acad. Sci. U.S.A. 115, E10988–E10997 (2018). - PMC - PubMed
    1. N. J. Bryant, R. Govers, D. E. James, Regulated transport of the glucose transporter GLUT4. Nat. Rev. Mol. Cell Biol. 3, 267–277 (2002). - PubMed
    1. S. Fukai, H. T. Matern, J. R. Jagath, R. H. Scheller, A. T. Brunger, Structural basis of the interaction between RalA and Sec5, a subunit of the sec6/8 complex. EMBO J. 22, 3267–3278 (2003). - PMC - PubMed
    1. K. Briant, L. Redlingshofer, F. M. Brodsky, Clathrin’s life beyond 40: Connecting biochemistry with physiology and disease. Curr. Opin. Cell Biol. 65, 141–149 (2020). - PubMed

MeSH terms