. 2023 Feb 22;9(8):eadd9280.
doi: 10.1126/sciadv.add9280. Epub 2023 Feb 22.

Mitoxantrone targets both host and bacteria to overcome vancomycin resistance in Enterococcus faecalis

Affiliations

Mitoxantrone targets both host and bacteria to overcome vancomycin resistance in Enterococcus faecalis

Ronni A G da Silva et al. Sci Adv. .

Abstract

Antibiotic resistance critically limits treatment options for infection caused by opportunistic pathogens such as enterococci. Here, we investigate the antibiotic and immunological activity of the anticancer agent mitoxantrone (MTX) in vitro and in vivo against vancomycin-resistant Enterococcus faecalis (VRE). We show that, in vitro, MTX is a potent antibiotic against Gram-positive bacteria through induction of reactive oxygen species and DNA damage. MTX also synergizes with vancomycin against VRE, rendering the resistant strains more permeable to MTX. In a murine wound infection model, single-dose MTX treatment effectively reduces VRE numbers, with further reduction when combined with vancomycin. Multiple MTX treatments accelerate wound closure. MTX also promotes macrophage recruitment and proinflammatory cytokine induction at the wound site and augments intracellular bacterial killing in macrophages by up-regulating the expression of lysosomal enzymes. These results show that MTX represents a promising bacterium- and host-targeted therapeutic for overcoming vancomycin resistance.


Figures

Fig. 1.
Fig. 1.. MTX exhibits potent antibiotic activity in vivo.
(A to C) Comparison of VRE (A), MRSA (B), and P. aeruginosa (C) CFU per infected wound treated with either PBS (black) or MTX (orange). Each symbol represents one mouse with the median indicated by the horizontal line. Data were from two independent experiments with four to five mice per experiment. Statistical analysis was performed using the nonparametric Mann-Whitney test to compare ranks; *P ≤ 0.05 and **P ≤ 0.01. (D) Representative images of VRE-, MRSA-, and P. aeruginosa–infected wounds treated with PBS or MTX.
Fig. 2.
Fig. 2.. MTX and vancomycin synergize to inhibit VRE in vitro and in vivo.
(A) Comparison of VRE growth in DMEM, in the presence of MTX (0.515 μg/ml), in the presence of decreasing concentrations (75 to 0.0625 μg/ml) of vancomycin, and with a combination of MTX and vancomycin. Arrows represent the breaking point where vancomycin concentration alone (18 μg/ml) starts to differ from vancomycin concentration in the presence of MTX. Data (mean ± SEM) were derived from three independent experiments. (B) Comparison of VRE CFU per wound after treatments. (C) Comparison of VRE CFU per wound after multiple treatments. Vancomycin treatment was performed only in the first day. The limit of detection (LOD) is shown. Data in (B) and (C) were from two independent experiments with three to four mice per experiment. Each symbol represents one mouse, with the median indicated by the horizontal line. Statistical analysis was performed using Kruskal-Wallis test with uncorrected Dunn’s posttest. (D) Wound area measured at 4 days post-infection (dpi) after five treatments. Vancomycin treatment was performed only in the first day, alone or in combination with MTX. Statistical analysis was performed in (A) and (D) using ordinary one-way ANOVA, followed by Tukey’s multiple comparison test. For all analyses, NS denotes not significant; *P ≤ 0.05, **P ≤ 0.01, and ****P ≤ 0.0001. (E) Representative images of wounds at the end of the multiple-treatment experiment. Scale bars, 5 mm. (F) Wounds were harvested at 4 dpi and subjected to H&E staining. The wound edges (black arrows), thickened epidermis (gray arrowhead), and normal margin (orange arrowhead) are shown. Scale bars, 400 μm.
Fig. 3.
Fig. 3.. MTX induces production of ROS and DNA damage in bacterial cells.
(A) Comparison of VRE growth (OD600) in oxic and anoxic conditions in the presence of decreasing concentrations of MTX. Data (mean ± SEM) are summary of three independent experiments. (B) Comparison of intracellular ROS levels, as measured by DHR123 fluorescence, in VRE cultures treated with MTX (0.515 μg/ml), vancomycin (4 μg/ml), or both. (C) Comparison of 8-OHdG levels, as measured by ELISA, in VRE cultures treated with MTX (0.515 μg/ml), vancomycin (4 μg/ml), or both. H2O2 (0.1 mM) was added into the VRE culture as a positive control. Data (mean ± SEM) in (C) and (D) are summary from three independent experiments each. Statistical analysis was performed using ordinary one-way ANOVA, followed by Tukey’s multiple comparison test; NS, P > 0.05; *P ≤ 0.05, **P ≤ 0.01, and ***P ≤ 0.001. (D) Comparison of VRE growth in DMEM (black), in the presence of MTX (0.515 μg/ml) (orange), in the presence of decreasing concentrations (75 to 0.0625 μg/ml) of vancomycin (blue), and with a combination of MTX and vancomycin (pink). MitoTEMPO was added into all cultures. Data (mean ± SEM) were derived from three independent experiments for each sample per experiment.
Fig. 4.
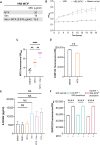
Fig. 4.. Vancomycin-treated VRE bacterial cells have increased permeability to MTX.
(A) MTX uptake by VRE after 6 hours of treatment with MTX (0.515 μg/ml) alone and in combination with vancomycin (4 μg/ml). Each dot represents one independent experiment. (B) Mass spectrometry quantification of intracellular MTX of VRE cultures treated with MTX (0.515 μg/ml) and in combination with vancomycin (4 μg/ml) for 1 hour. Data (mean ± SEM) are summary of five independent replicates. Statistical analysis was performed using unpaired t test with Welch’s corrections; **P ≤ 0.01. (C) Comparison of PI uptake by VRE after 6 hours of treatment with MTX (0.515 μg/ml) alone, vancomycin alone (4 μg/ml), or in combination. (D) Epifluorescence microscopy images of VRE stained with PI after 6 hours of treatment with MTX, vancomycin, or both. Scale bars, 5 μm. (A and C) Data (mean ± SEM) are summary of at least three independent experiments. Statistical analysis was performed using ordinary one-way ANOVA, followed by Tukey’s multiple comparison test; NS, P > 0.05; *P ≤ 0.05, **P ≤ 0.01, ***P ≤ 0.001, and ****P ≤ 0.0001.
Fig. 5.
Fig. 5.. VRE MTXR exhibits increased MTX uptake but not increased ROS production and DNA damage.
(A) Comparison of MIC for MTX alone, vancomycin alone, and vancomycin in the presence of MTX (0.515 mg/ml) between the parental VRE and VRE MTXR. Each dot represents one independent experiment. (B) Growth curve of VRE and VRE MTXR in DMEM. (C) MTX uptake by VRE MTXR after 6 hours of treatment with MTX (0.515 μg/ml) alone and in combination with vancomycin (4 μg/ml). (D) Analysis of ROS levels in VRE MTXR treated with MTX (0.515 μg/ml). (E) ELISA measurements of 8-OHdG levels in VRE MTXR treated with MTX (0.515 μg/ml) and vancomycin (4 μg/ml), separately and in combination, and the positive control H2O2 (0.1 mM). (F) Analysis of ROS levels in E. faecalis OG1RF and E. faecalis OG1RF constitutively expressing either a wild-type (VRE dead/deah) or the mutant DEAD/DEAH helicase (VRE MTXR dead/deah) treated with MTX (0.515 μg/ml). (C to F) Data (mean ± SEM) are summary of at least three independent experiments. Statistical analysis was performed using ordinary one-way ANOVA, followed by Tukey’s multiple comparison test; NS, P > 0.05; **P ≤ 0.01, and ****P ≤ 0.0001.
Fig. 6.
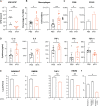
Fig. 6.. MTX treatment promotes macrophage recruitment and reprogramming to a proinflammatory phenotype.
VRE MTXR–infected wounds were treated for 24 hours with either PBS or a single dose of MTX [10 μl of MTX (0.515 μg/ml) per wound]. (A) Comparison of VRE MTXR CFU in wound lysates treated with either PBS or MTX for 24 hpi. Data (mean ± median) are a summary of two independent experiments with four to five mice per group. (B) Percentage and absolute numbers of macrophages recovered from infected wounds treated with PBS or MTX. Data (mean ± SEM) are summary of two independent experiments. Each dot represents one mouse. (C) Comparison of mean fluorescence intensity (MFI) of CD86 and CD163 staining gating on CD45+ CD11b+ F4/80+ macrophages from infected wounds treated with PBS or MTX. Data (mean ± SEM) are from five mice per group. (D) Levels of cytokines IL-1β, IL-6, TNF-α, IFN-γ, and TGF-β from the lysates of infected wound treated with PBS or MTX. Data (mean ± SEM) are summary of two independent experiments. Each dot represents one mouse. (E) Comparison of VRE CFU counts in RAW264.7, BMDM, THP-1, and HBDM (human blood-derived macrophage) in the presence or absence of MTX. Data (mean ± SEM) are summary of three independent experiments. (F) VRE CFU performed with MTX-pretreated RAW264.7 macrophage cells. Data (mean ± SEM) are summary of at least three independent experiments. Statistical analysis was performed using the nonparametric Mann-Whitney test to compare ranks (A), unpaired t test with Welch’s corrections (B to E), or ordinary one-way ANOVA followed by Tukey’s multiple comparison test (F). NS, P > 0.05; *P ≤ 0.05 and **P ≤ 0.01.
Fig. 7.
Fig. 7.. MTX enhances macrophage antimicrobial activity by stimulating lysosomal enzyme expression and activity.
(A) qRT-PCR analysis of Ctsd, Ctsh, and Hexb transcript levels (ΔCT) in RAW264.7 cells with or without DMSO or MTX treatment overnight. Each dot represents one biological replicate. (B and C) Western blotting analysis of whole-cell lysates with anti–cathepsin D antibody. RAW264.7 cells with (+) and without (−) VRE infection were treated with MTX (+) or left untreated (−). Whole-cell lysates were separated by SDS–polyacrylamide gel electrophoresis, transferred to membrane, and probed with anti–cathepsin D antibody or anti-GAPDH (control) (B). Relative band density of the CtsD heavy chain normalized to that of GAPDH (C). (D) RAW264.7 cells were infected with either VRE or VRE MTXR in the presence of MTX (0.515 μg/ml), pepstatin A (10 μg/ml), or both. Intracellular bacterial CFU was quantified. Data (mean ± SEM) are a summary of at least three independent experiments. Statistical analysis was performed using ordinary one-way ANOVA, followed by Tukey’s multiple comparison test; NS, P > 0.05; *P ≤ 0.05, **P ≤ 0.01, and ***P ≤ 0.001.

References

    1. C. J. Murray, K. S. Ikuta, F. Sharara, L. Swetschinski, G. Robles Aguilar, A. Gray, C. Han, C. Bisignano, P. Rao, E. Wool, S. C. Johnson, A. J. Browne, M. G. Chipeta, F. Fell, S. Hackett, G. Haines-Woodhouse, B. H. Kashef Hamadani, E. A. P. Kumaran, B. McManigal, R. Agarwal, S. Akech, S. Albertson, J. Amuasi, J. Andrews, A. Aravkin, E. Ashley, F. Bailey, S. Baker, B. Basnyat, A. Bekker, R. Bender, A. Bethou, J. Bielicki, S. Boonkasidecha, J. Bukosia, C. Carvalheiro, C. Castañeda-Orjuela, V. Chansamouth, S. Chaurasia, S. Chiurchiù, F. Chowdhury, A. J. Cook, B. Cooper, T. R. Cressey, E. Criollo-Mora, M. Cunningham, S. Darboe, N. P. J. Day, M. de Luca, K. Dokova, A. Dramowski, S. J. Dunachie, T. Eckmanns, D. Eibach, A. Emami, N. Feasey, N. Fisher-Pearson, K. Forrest, D. Garrett, P. Gastmeier, A. Z. Giref, R. C. Greer, V. Gupta, S. Haller, A. Haselbeck, S. I. Hay, M. Holm, S. Hopkins, K. C. Iregbu, J. Jacobs, D. Jarovsky, F. Javanmardi, M. Khorana, N. Kissoon, E. Kobeissi, T. Kostyanev, F. Krapp, R. Krumkamp, A. Kumar, H. H. Kyu, C. Lim, D. Limmathurotsakul, M. J. Loftus, M. Lunn, J. Ma, N. Mturi, T. Munera-Huertas, P. Musicha, M. M. Mussi-Pinhata, T. Nakamura, R. Nanavati, S. Nangia, P. Newton, C. Ngoun, A. Novotney, D. Nwakanma, C. W. Obiero, A. Olivas-Martinez, P. Olliaro, E. Ooko, E. Ortiz-Brizuela, A. Y. Peleg, C. Perrone, N. Plakkal, A. Ponce-de-Leon, M. Raad, T. Ramdin, A. Riddell, T. Roberts, J. V. Robotham, A. Roca, K. E. Rudd, N. Russell, J. Schnall, J. A. G. Scott, M. Shivamallappa, J. Sifuentes-Osornio, N. Steenkeste, A. J. Stewardson, T. Stoeva, N. Tasak, A. Thaiprakong, G. Thwaites, C. Turner, P. Turner, H. R. van Doorn, S. Velaphi, A. Vongpradith, H. Vu, T. Walsh, S. Waner, T. Wangrangsimakul, T. Wozniak, P. Zheng, B. Sartorius, A. D. Lopez, A. Stergachis, C. Moore, C. Dolecek, M. Naghavi, Global burden of bacterial antimicrobial resistance in 2019: A systematic analysis. Lancet 399, 629–655 (2022). - PMC - PubMed
    1. World Health Organization, New report calls for urgent action to avert antimicrobial resistance crisis; www.who.int/news/item/29-04-2019-new-report-calls-for-urgent-action-to-a...ink>.
    1. C. Y. Chiang, I. Uzoma, R. T. Moore, M. Gilbert, A. J. Duplantier, R. G. Panchal, Mitigating the impact of antibacterial drug resistance through host-directed therapies: Current progress, outlook, and challenges. mBio 9, e01932 (2018). - PMC - PubMed
    1. A. Giacometti, O. Cirioni, A. M. Schimizzi, M. S. del Prete, F. Barchiesi, M. M. D’Errico, E. Petrelli, G. Scalise, Epidemiology and microbiology of surgical wound infections. J. Clin. Microbiol. 38, 918–922 (2000). - PMC - PubMed
    1. P. G. Bowler, B. I. Duerden, D. G. Armstrong, Wound microbiology and associated approaches to wound management. Clin. Microbiol. Rev. 14, 244–269 (2001). - PMC - PubMed

MeSH terms