. 2023 Feb 22;9(8):eade8137.
doi: 10.1126/sciadv.ade8137. Epub 2023 Feb 22.

Reduced insulin signaling in neurons induces sex-specific health benefits

Affiliations

Reduced insulin signaling in neurons induces sex-specific health benefits

Maarouf Baghdadi et al. Sci Adv. .

Abstract

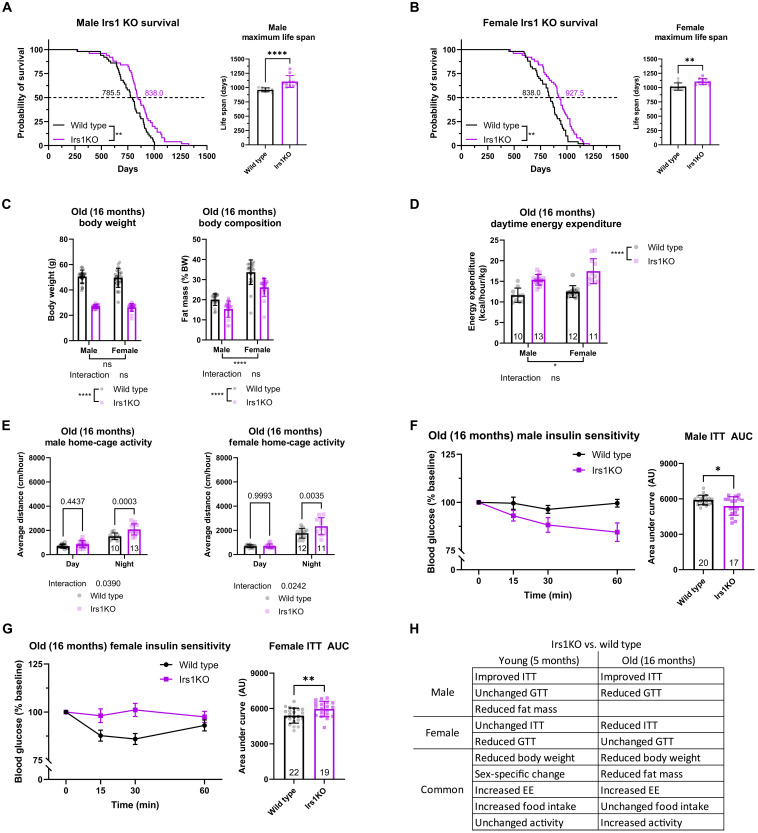
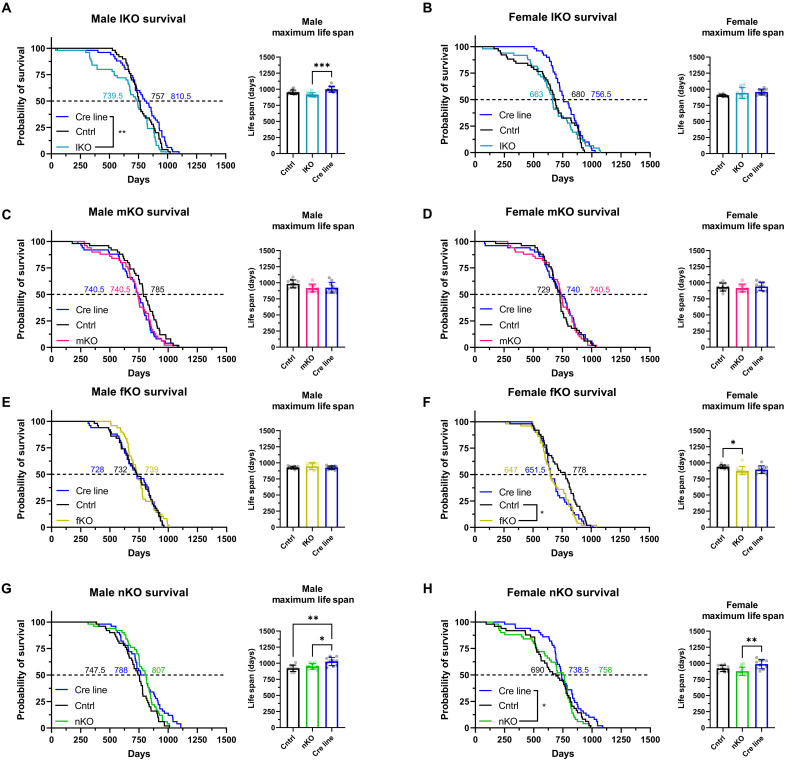
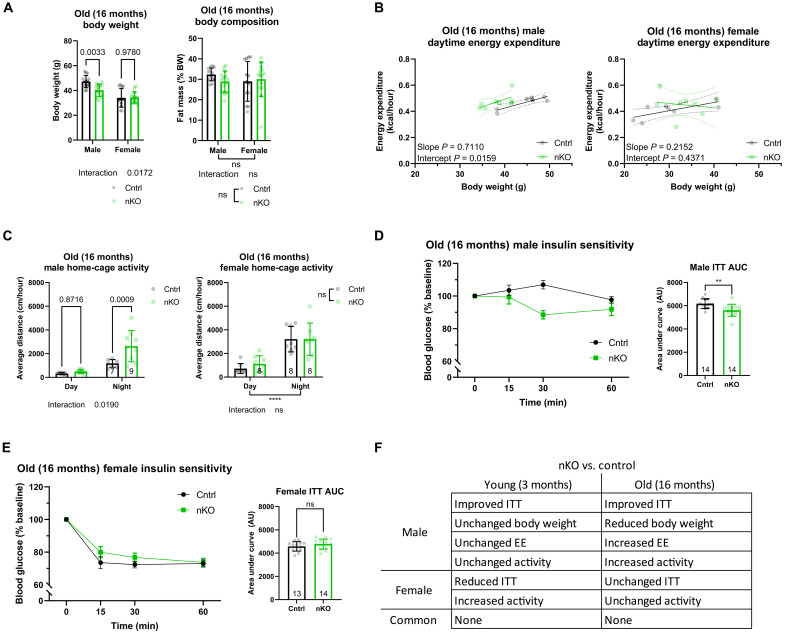
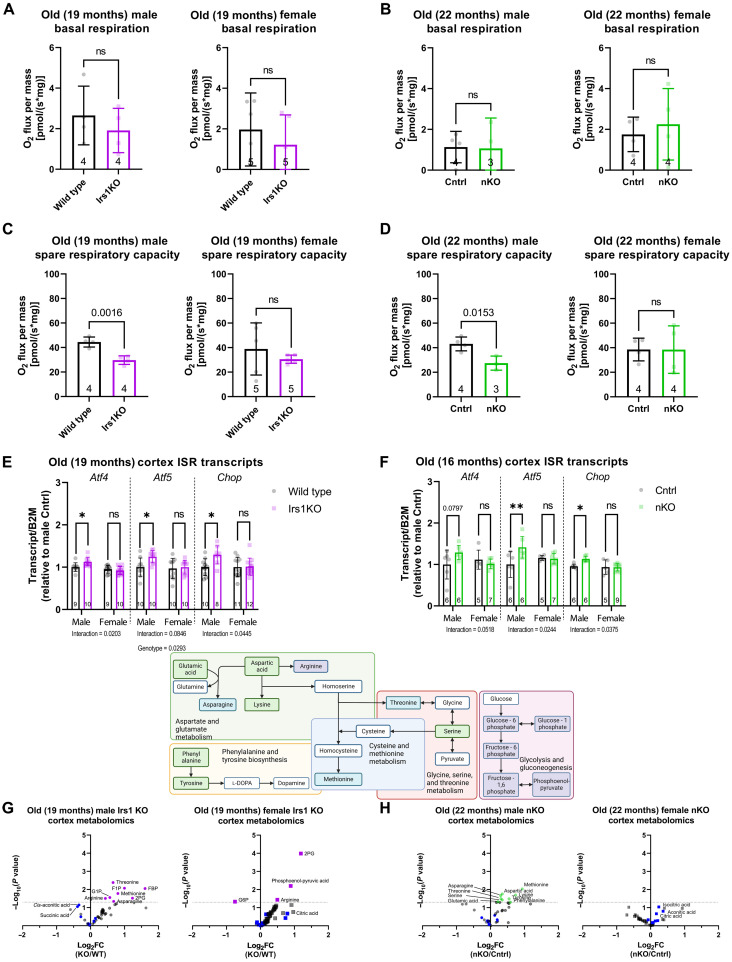
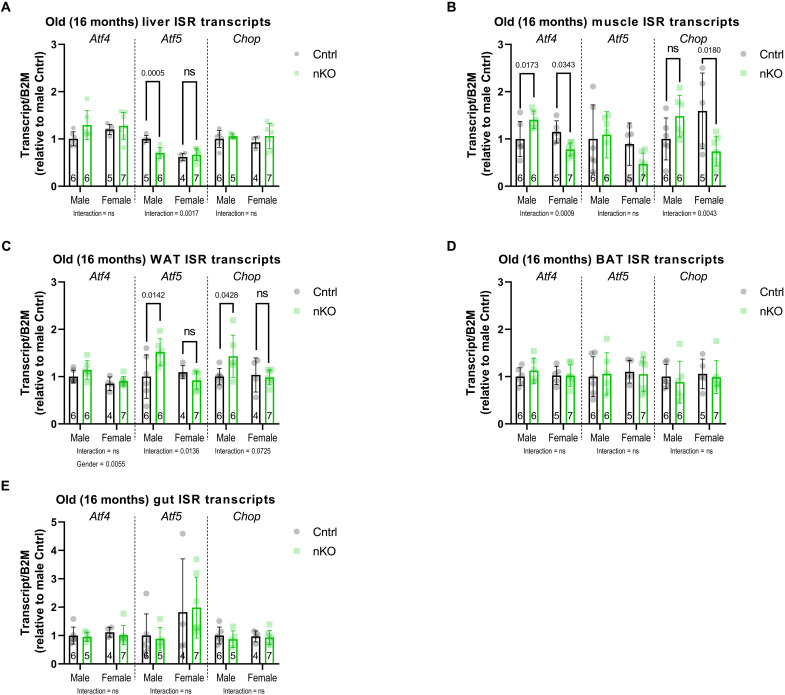
Reduced activity of insulin/insulin-like growth factor signaling (IIS) extends health and life span in mammals. Loss of the insulin receptor substrate 1 (Irs1) gene increases survival in mice and causes tissue-specific changes in gene expression. However, the tissues underlying IIS-mediated longevity are currently unknown. Here, we measured survival and health span in mice lacking IRS1 specifically in liver, muscle, fat, and brain. Tissue-specific loss of IRS1 did not increase survival, suggesting that lack of IRS1 in more than one tissue is required for life-span extension. Loss of IRS1 in liver, muscle, and fat did not improve health. In contrast, loss of neuronal IRS1 increased energy expenditure, locomotion, and insulin sensitivity, specifically in old males. Neuronal loss of IRS1 also caused male-specific mitochondrial dysfunction, activation of Atf4, and metabolic adaptations consistent with an activated integrated stress response at old age. Thus, we identified a male-specific brain signature of aging in response to reduced IIS associated with improved health at old age.


Figures

Fig. 1.
Fig. 1.. Increased life span and improved health parameters in Irs1KO mice.
Kaplan-Meier plots depicting the survival of (A) male and (B) female wild-type and whole-body Irs1KO mice (n = 50 biologically independent animals per sex and genotype). (C) Body weight (BW) and composition of Irs1KO mice were measured at old age (16 months) (wild-type males n = 20, Irs1KO males n = 17, wild-type females n = 21, and Irs1KO females n = 19). (D) Body weight–normalized EE of singly housed old Irs1KO mice during daytime. (E) Spontaneous activity of old Irs1KO single-housed mice during daytime (inactive phase) and nighttime (active phase) (wild-type males n = 10, Irs1KO males n = 13, wild-type females n = 12, and Irs1KO females n = 11). ITT performed on male (F) and female (G) Irs1KO mice at old age with respective AUC analysis revealed significantly higher insulin sensitivity in male Irs1KO mice but significantly lower insulin sensitivity in female Irs1KO mice. (H) Table summarizing the phenotypes unique to and shared between male and female mutant mice. All error bars correspond to SD except for longitudinal insulin sensitivity where SEM is reported. The number of animals is reported at the bottom of the bars or in the figure legends. Detailed statistical values are found in table S1. GTT, glucose tolerance test; ns, not significant.
Fig. 2.
Fig. 2.. Tissue-specific deletion of IRS1 is not sufficient for life-span extension.
Kaplan-Meier plots depicting the survival of male and female mice. Cox proportional hazard tests were used to compare survival (median life span labeled on 50% survival probability line in days) and Kruskal-Wallis tests were used to compare maximum the life span (inset shows the top 20% longest-lived mice) of all mutant mice. (A) Male and (B) female control (Cntrl), liver-specific Irs1 KO (lKO), and AlfpCre (Cre line) mice (n = 50 biologically independent animals for all groups). (C) Male and (D) female control (Cntrl), muscle-specific Irs1 KO (mKO), and CkmmCre (Cre line) mice (n = 50 biologically independent animals for all groups). (E) Male and (F) female control (Cntrl), fat-specific Irs1 KO (fKO), and AdipoqCre (Cre line) mice (n = 50 biologically independent animals for all groups and n = 49 for male fKO mice). (G) Male and (H) female control (Cntrl), neuron-specific Irs1 KO (nKO), and Syn1Cre (Cre line) mice (n = 50 biologically independent animals for all groups and n = 49 for female control). Detailed statistical values are found in table S1. Raw life-span data are found in table S4.
Fig. 3.
Fig. 3.. nKO mice show male-specific improvement in metabolic health.
(A) Body weight and composition of nKO mice were assessed at old age (16 months) (n = 14 biologically independent animals for all groups). (B) Daytime EE of male (control n = 7 and nKO n = 8) and female (n = 8 female control and nKO) mice was analyzed by linear regression of EE by body weight (ANCOVA). (C) Plotted spontaneous home-cage activity of old male (control n = 7 and nKO n = 9) and female (control n = 7 and nKO n = 9) single-housed nKO mice showed a nighttime-specific increase in activity of male nKO mice. (D) Analysis of ITT curves and AUC values of old male nKO showed a significant improvement in insulin sensitivity in nKO mice compared to controls. (E) Analysis of ITT curves and AUC values of old female nKO did not reveal any significant difference compared to controls. (F) Table summarizing the phenotypes unique to and shared between male and female mutant mice, highlighting the enrichment of male-specific phenotypes in nKO mice. All error bars correspond to SD except for longitudinal insulin sensitivity where SEM is reported. For ANCOVA analysis, the 95% confidence interval is plotted. The number of animals is reported at the bottom of the bars or in the figure legends. Detailed statistical values are found in table S1.
Fig. 4.
Fig. 4.. Investigation of mitochondrial function implicated the ISR.
(A) Measurement of basal oxygen consumption in brain tissue from old (19-month-old) Irs1KO mice detected no differences. (B) Measurement of basal oxygen consumption of brain tissue from old (22-month-old) nKO mice did not detect any differences. (C) Spare mitochondrial capacity in the brain tissue of old Irs1KO mice was measured, revealing a significant reduction in male but not female Irs1KO brains. (D) Spare mitochondrial capacity in the brain tissue of old nKO mice also revealed a significant reduction in male but not female nKO brains. (E) qRT-PCR performed to measure ISR markers on the brain tissue of old Irs1KO mice and their wild-type (WT) littermates found a significant sex-specific up-regulation of ISR in male Irs1KO mice. (F) Transcripts of ISR markers that were measured in the brain tissue of old (16-month-old) nKO mice and their control littermates found a significant sex-specific up-regulation of ISR in male nKO mice. (G) Semitargeted metabolomics revealed up-regulation of some metabolites in old brain tissue of Irs1KO mice compared to littermate wild types (male wild type n = 5 and Irs1KO n = 6, and female wild type and Irs1KO n = 6). Steady-state TCA cycle intermediates are labeled in blue, and the most affected are labeled. (H) Metabolomic analysis in old nKO mice also revealed up-regulated metabolites but exclusively in male brain tissue (male control and nKO n = 6 and female control and nKO n = 5). Steady-state TCA cycle intermediates are labeled in blue, and the most affected are labeled. Included above the volcano plots is a schematic of the metabolic pathways affected by reduced IIS in the brain, highlighting metabolites up-regulated in old Irs1KO only (purple squares), old nKO males only (green squares), and old Irs1KO and nKO males (blue squares). All error bars correspond to SD. Detailed statistical values are found in table S1.
Fig. 5.
Fig. 5.. Sex-specific mitochondrial ISR can be activated in nonaffected tissues.
qRT-PCR performed on the cortex of nKO mice in old (16-month-old) mice targeting various ISR markers. (A) Liver ISR transcripts in nKO mice and their control littermates revealed a sex-specific down-regulation in hepatic Atf5 levels of male nKO mice. (B) Muscle Atf4 and Chop transcripts were significantly up-regulated in nKO males but significantly down-regulated in females, while Atf5 levels were unchanged. (C) WAT Atf5 transcripts were significantly up-regulated in nKO males in a sex-specific manner, while Chop levels showed a trend that did not reach significance. BAT (D) and gut (E) ISR transcripts were not affected in nKO mice. Detailed statistical values are found in table S1.

Similar articles

Cited by

References

    1. L. Partridge, J. Deelen, P. E. Slagboom, Facing up to the global challenges of ageing. Nature 561, 45–56 (2018). - PubMed
    1. S. N. Austad, K. E. Fischer, Sex differences in lifespan. Cell Metab. 23, 1022–1033 (2016). - PMC - PubMed
    1. L. Fontana, L. Partridge, Promoting health and longevity through diet: From model organisms to humans. Cell 161, 106–118 (2015). - PMC - PubMed
    1. C. J. Kenyon, The genetics of ageing. Nature 464, 504–512 (2010). - PubMed
    1. M. D. W. Piper, L. Partridge, Drosophila as a model for ageing. Biochim. Biophys. Acta Mol. Basis Dis. 1864, 2707–2717 (2018). - PubMed