. 2023 Feb 22;15(684):eade1857.
doi: 10.1126/scitranslmed.ade1857. Epub 2023 Feb 22.

Obesity promotes breast epithelium DNA damage in women carrying a germline mutation in BRCA1 or BRCA2

Affiliations

Obesity promotes breast epithelium DNA damage in women carrying a germline mutation in BRCA1 or BRCA2

Priya Bhardwaj et al. Sci Transl Med. .

Abstract

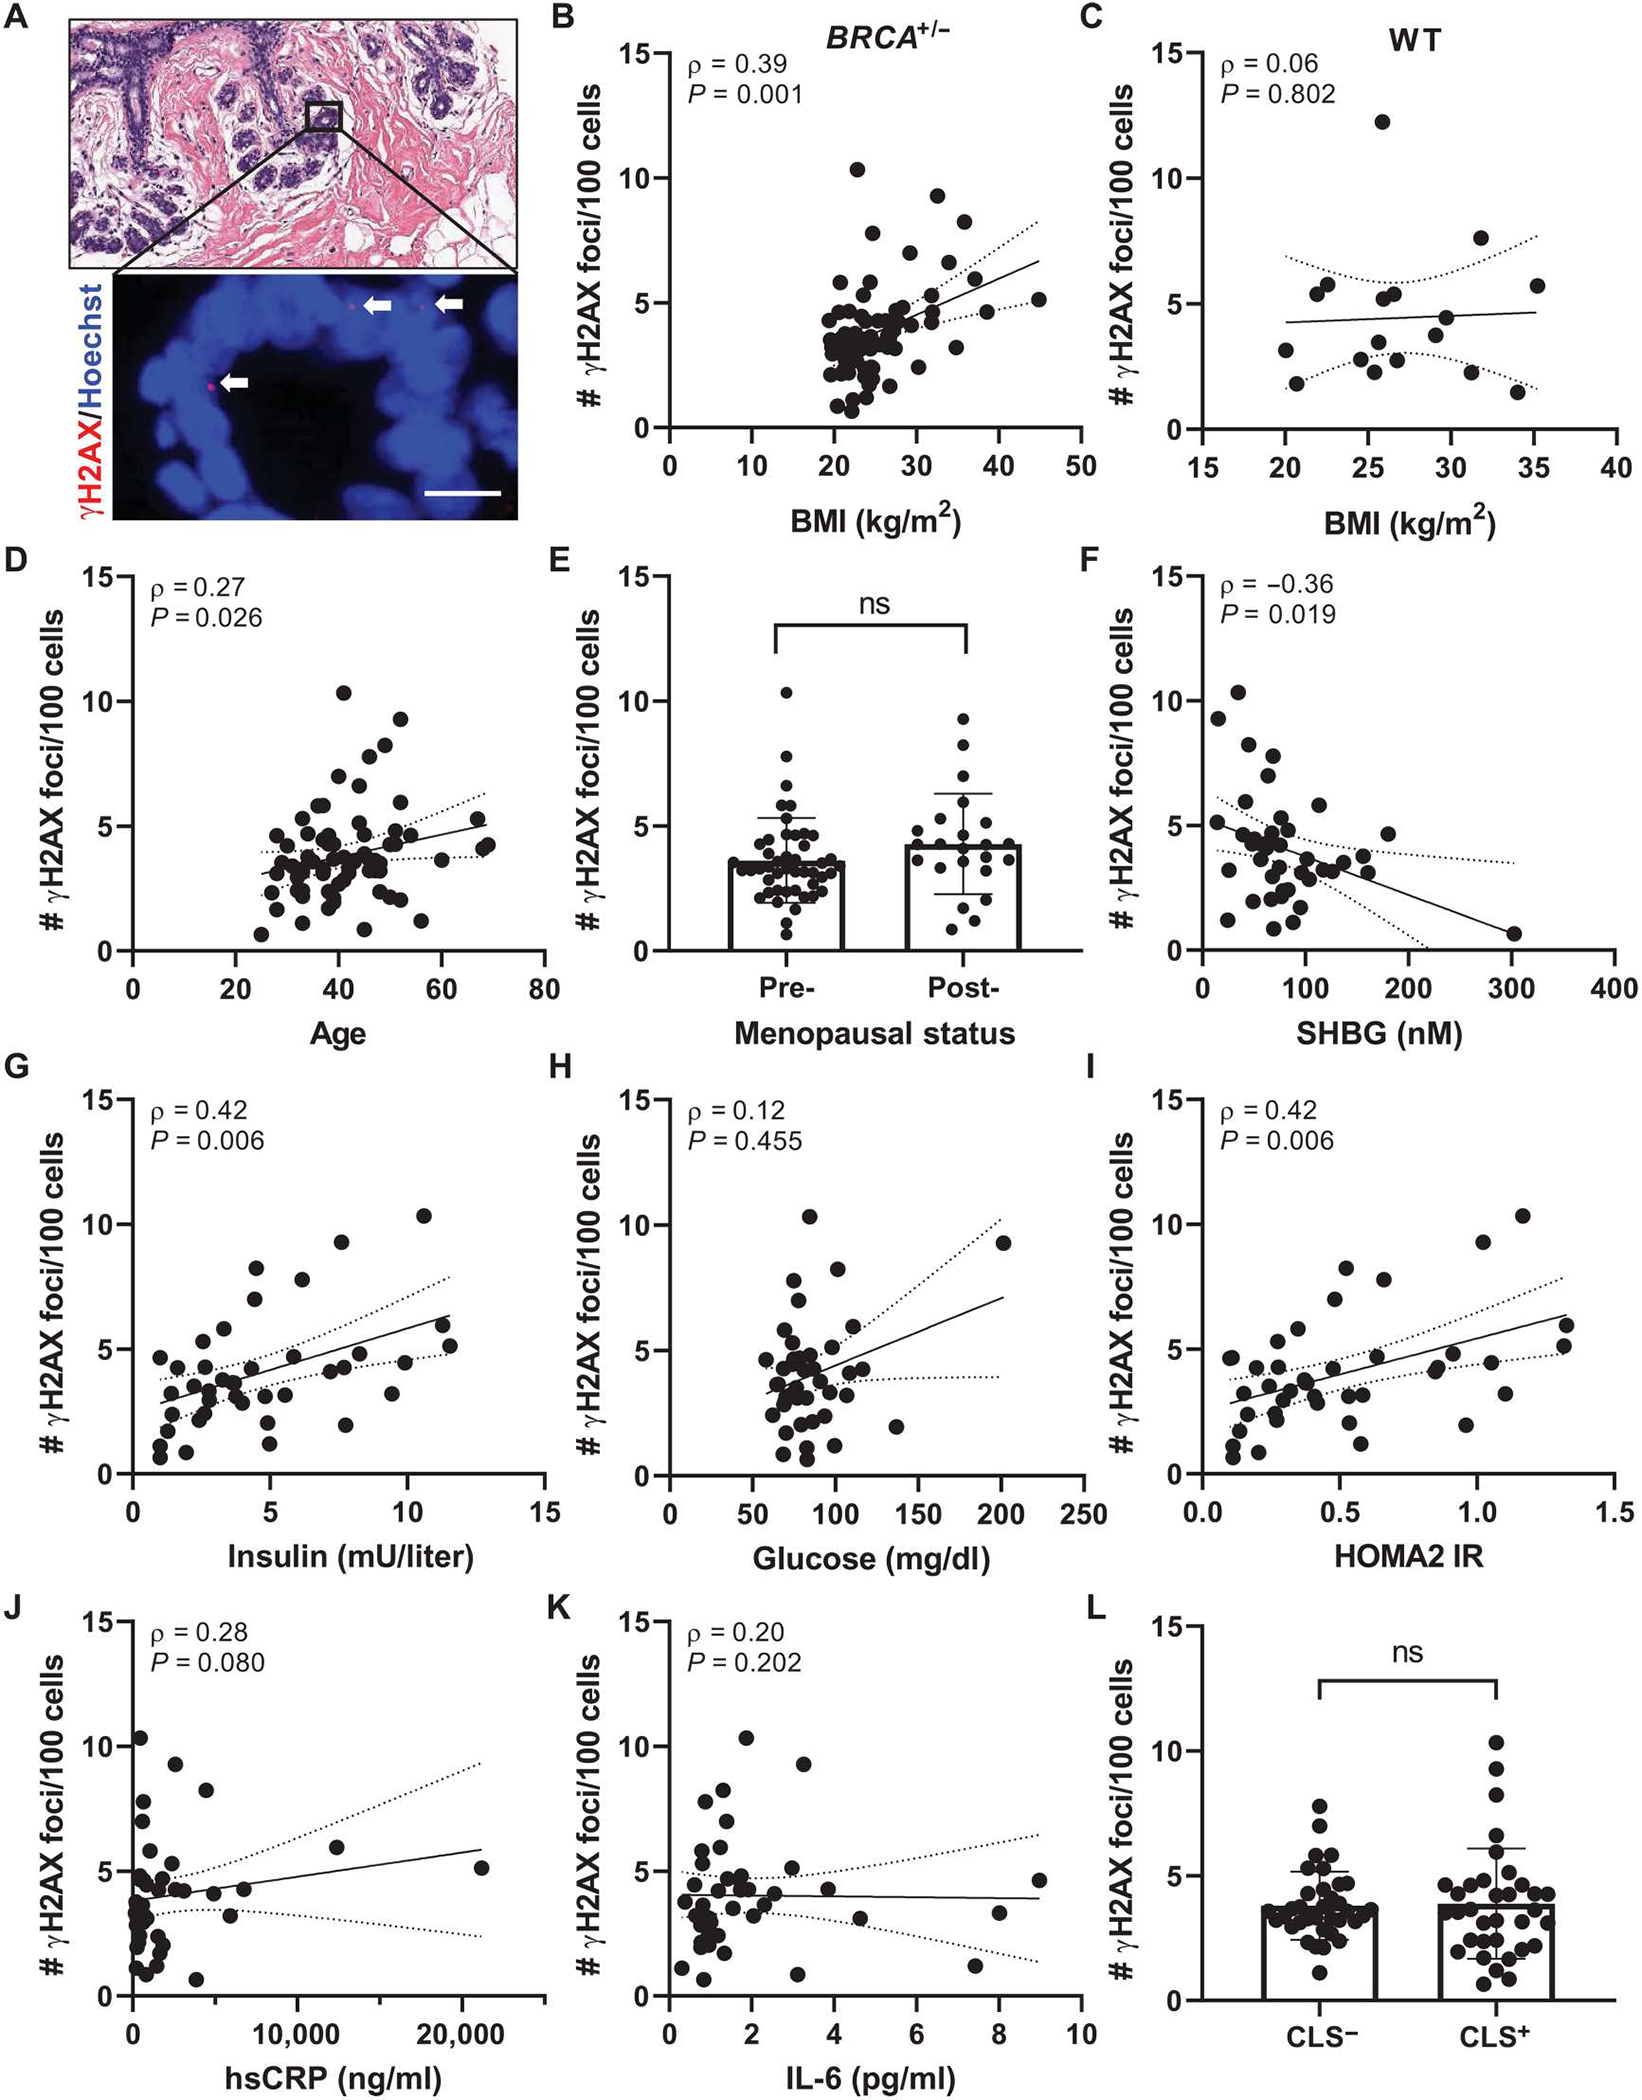
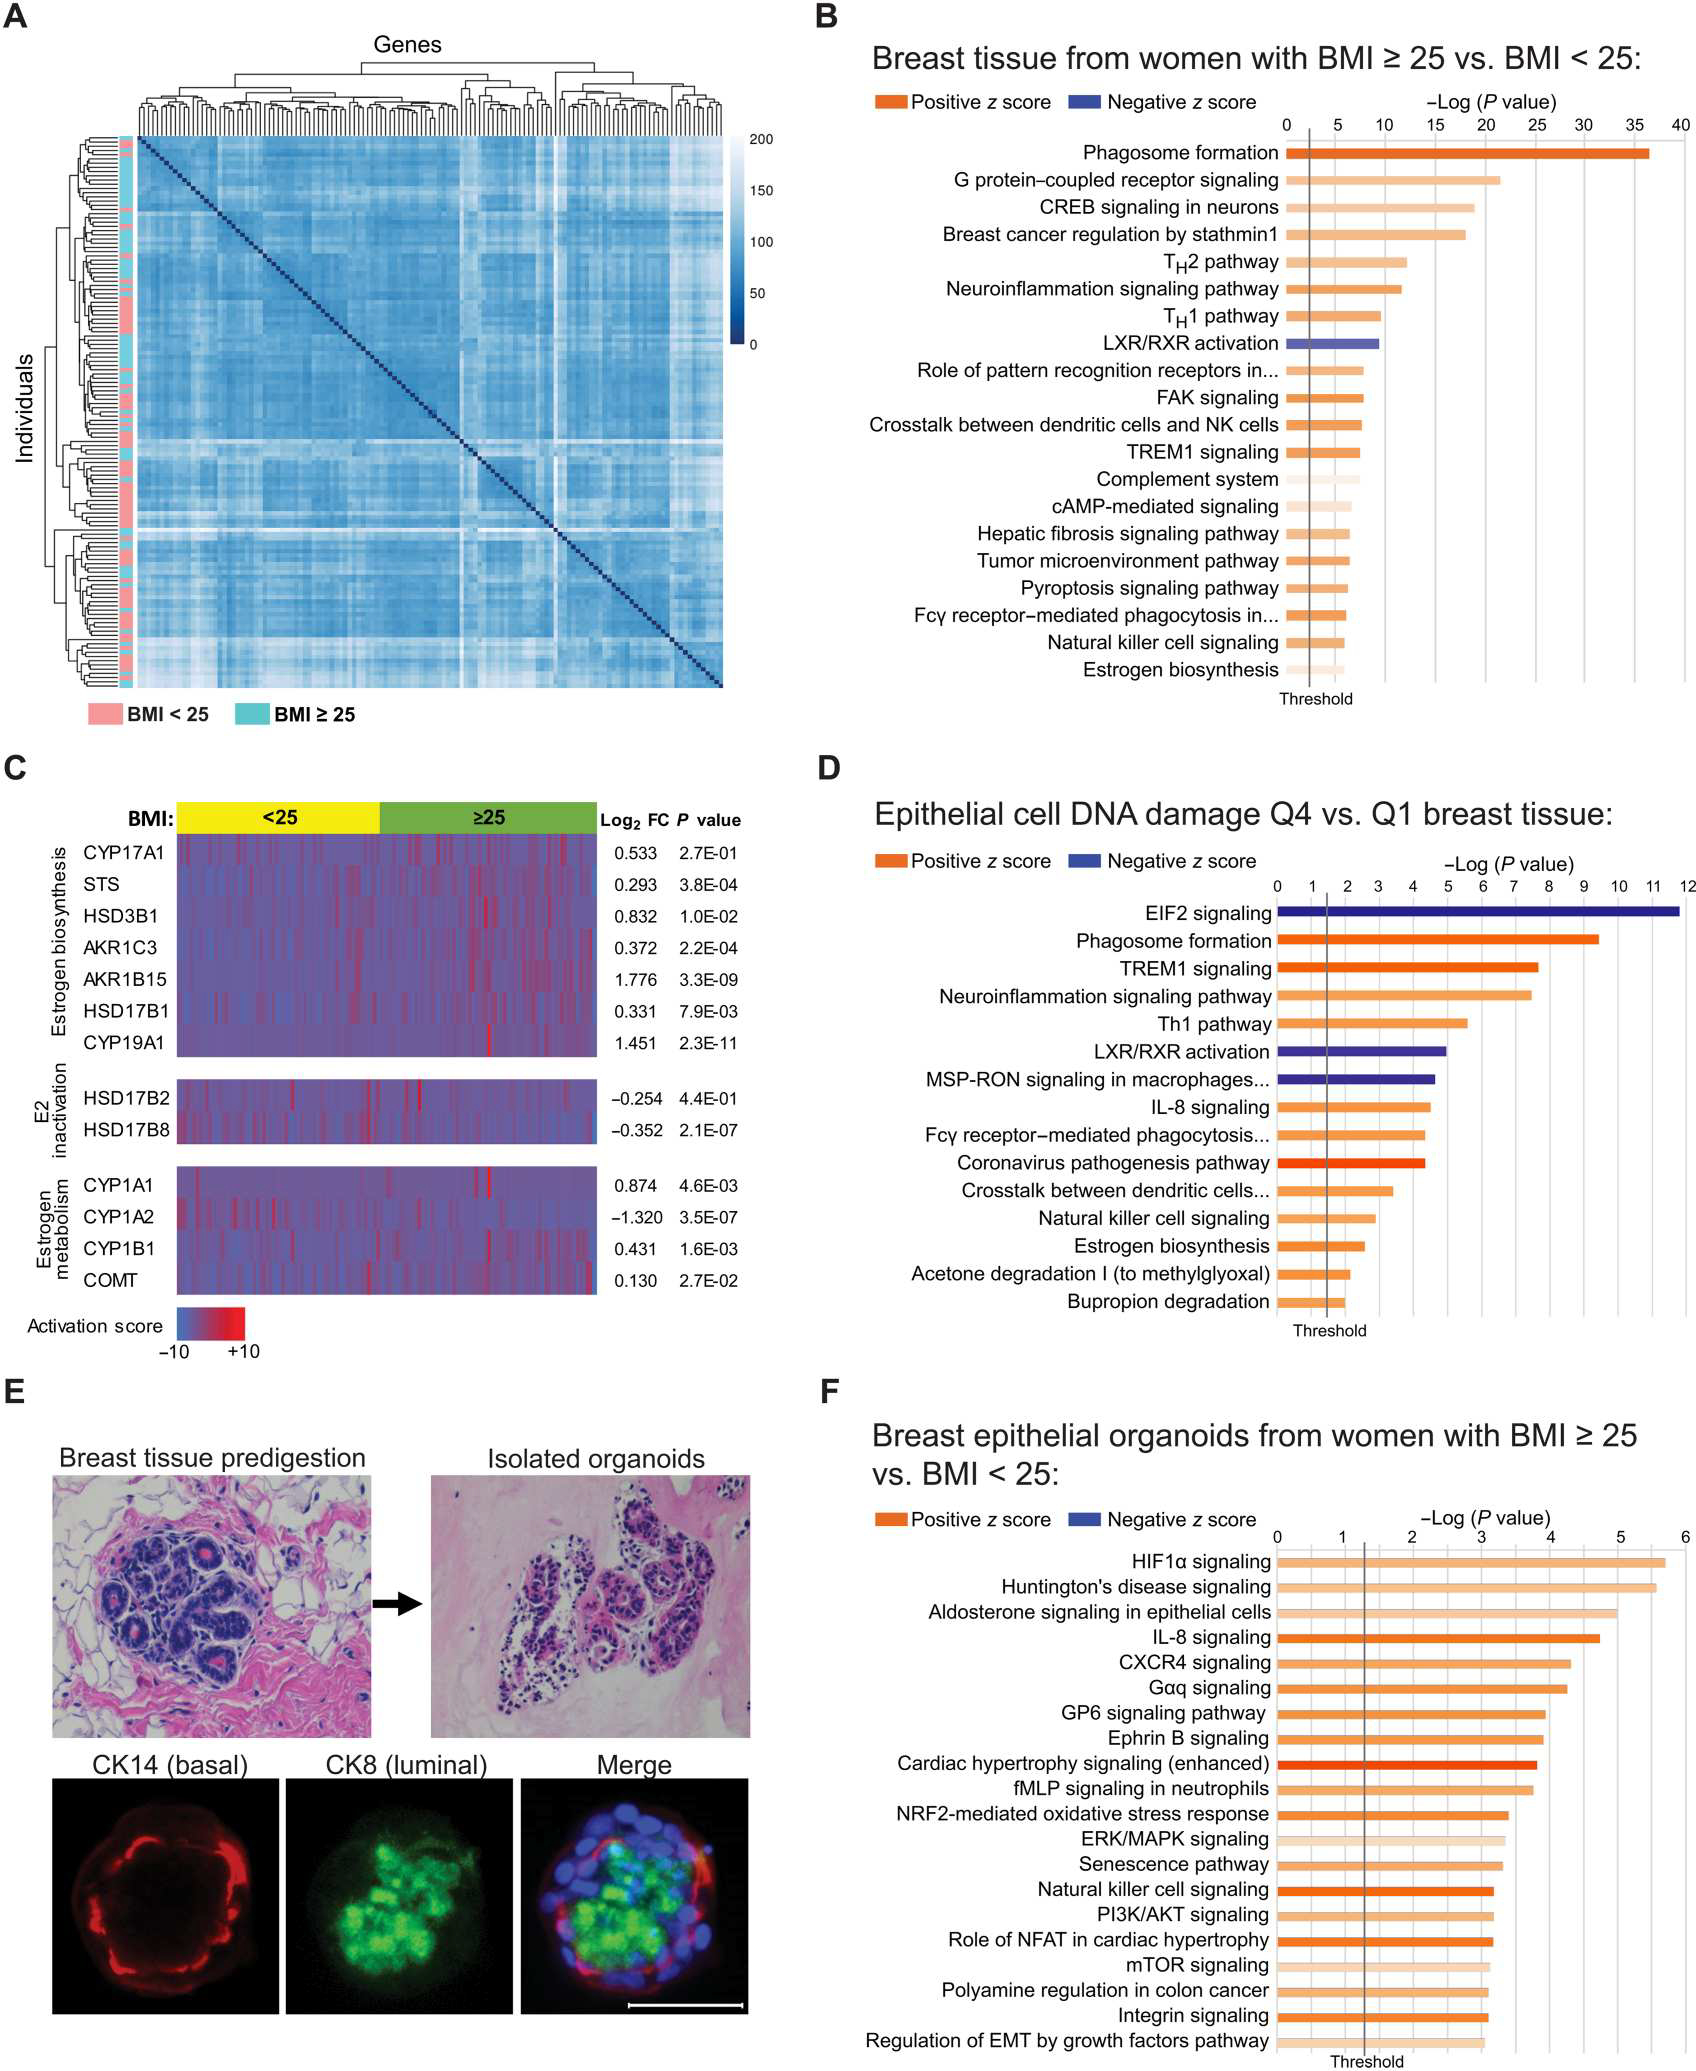
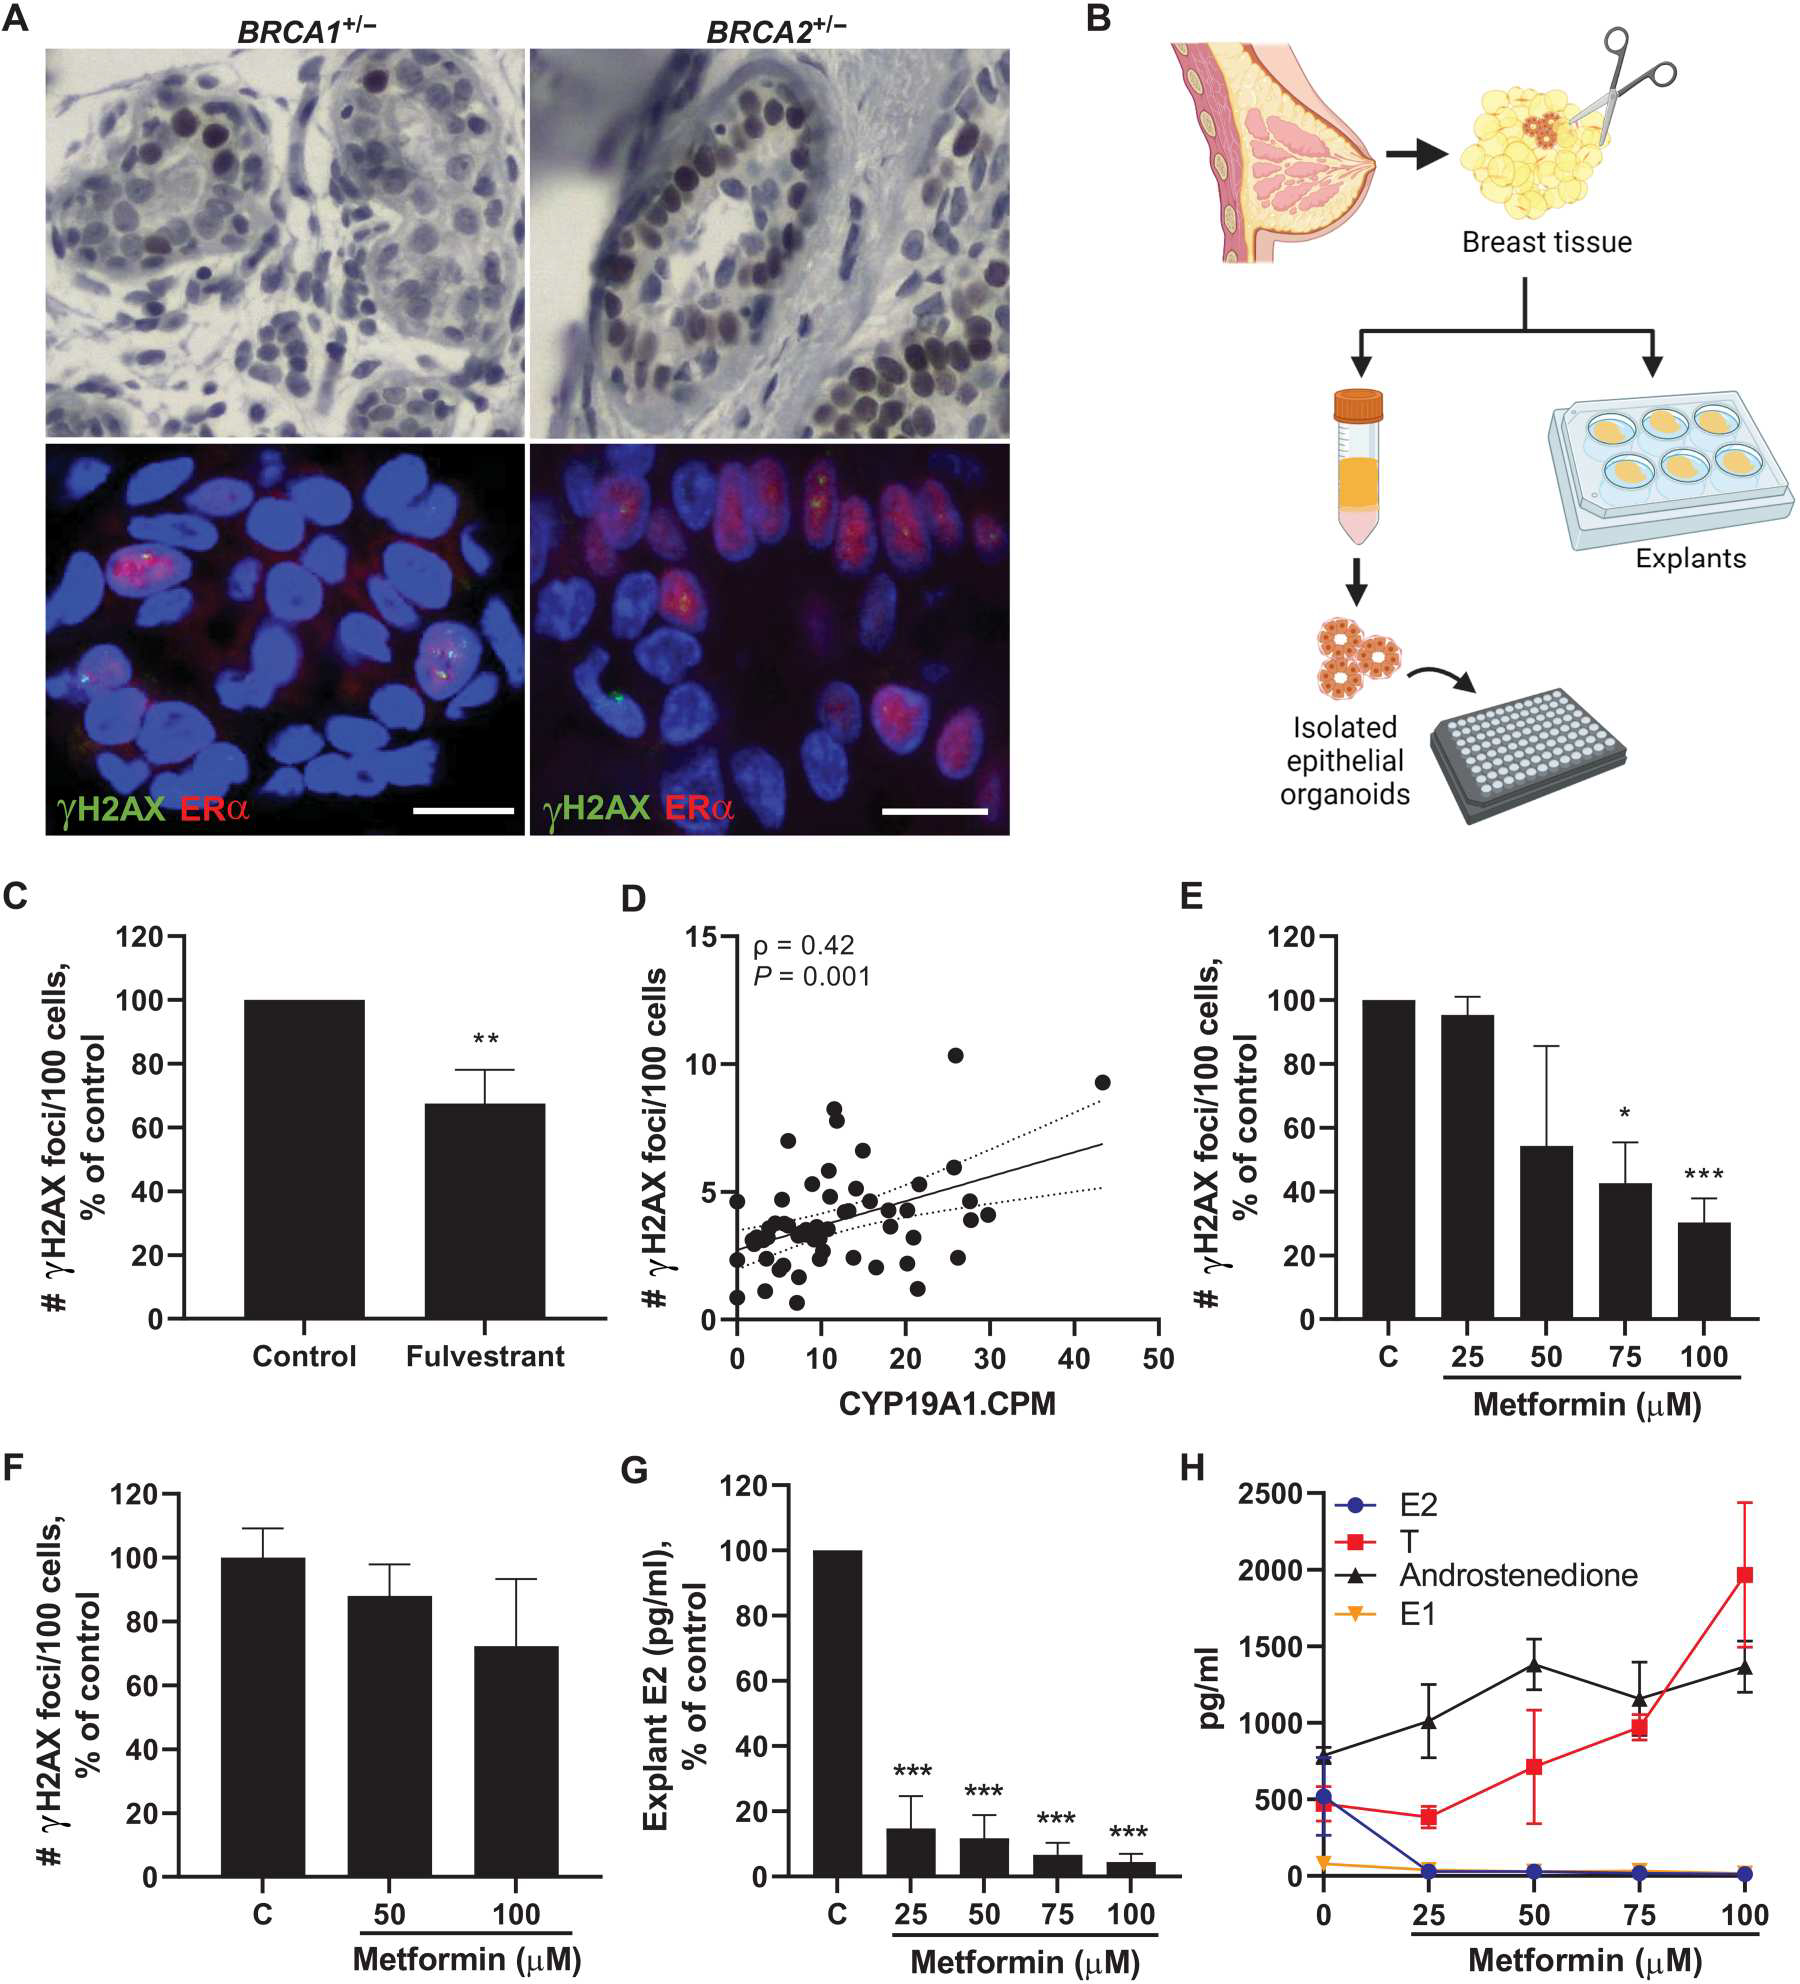
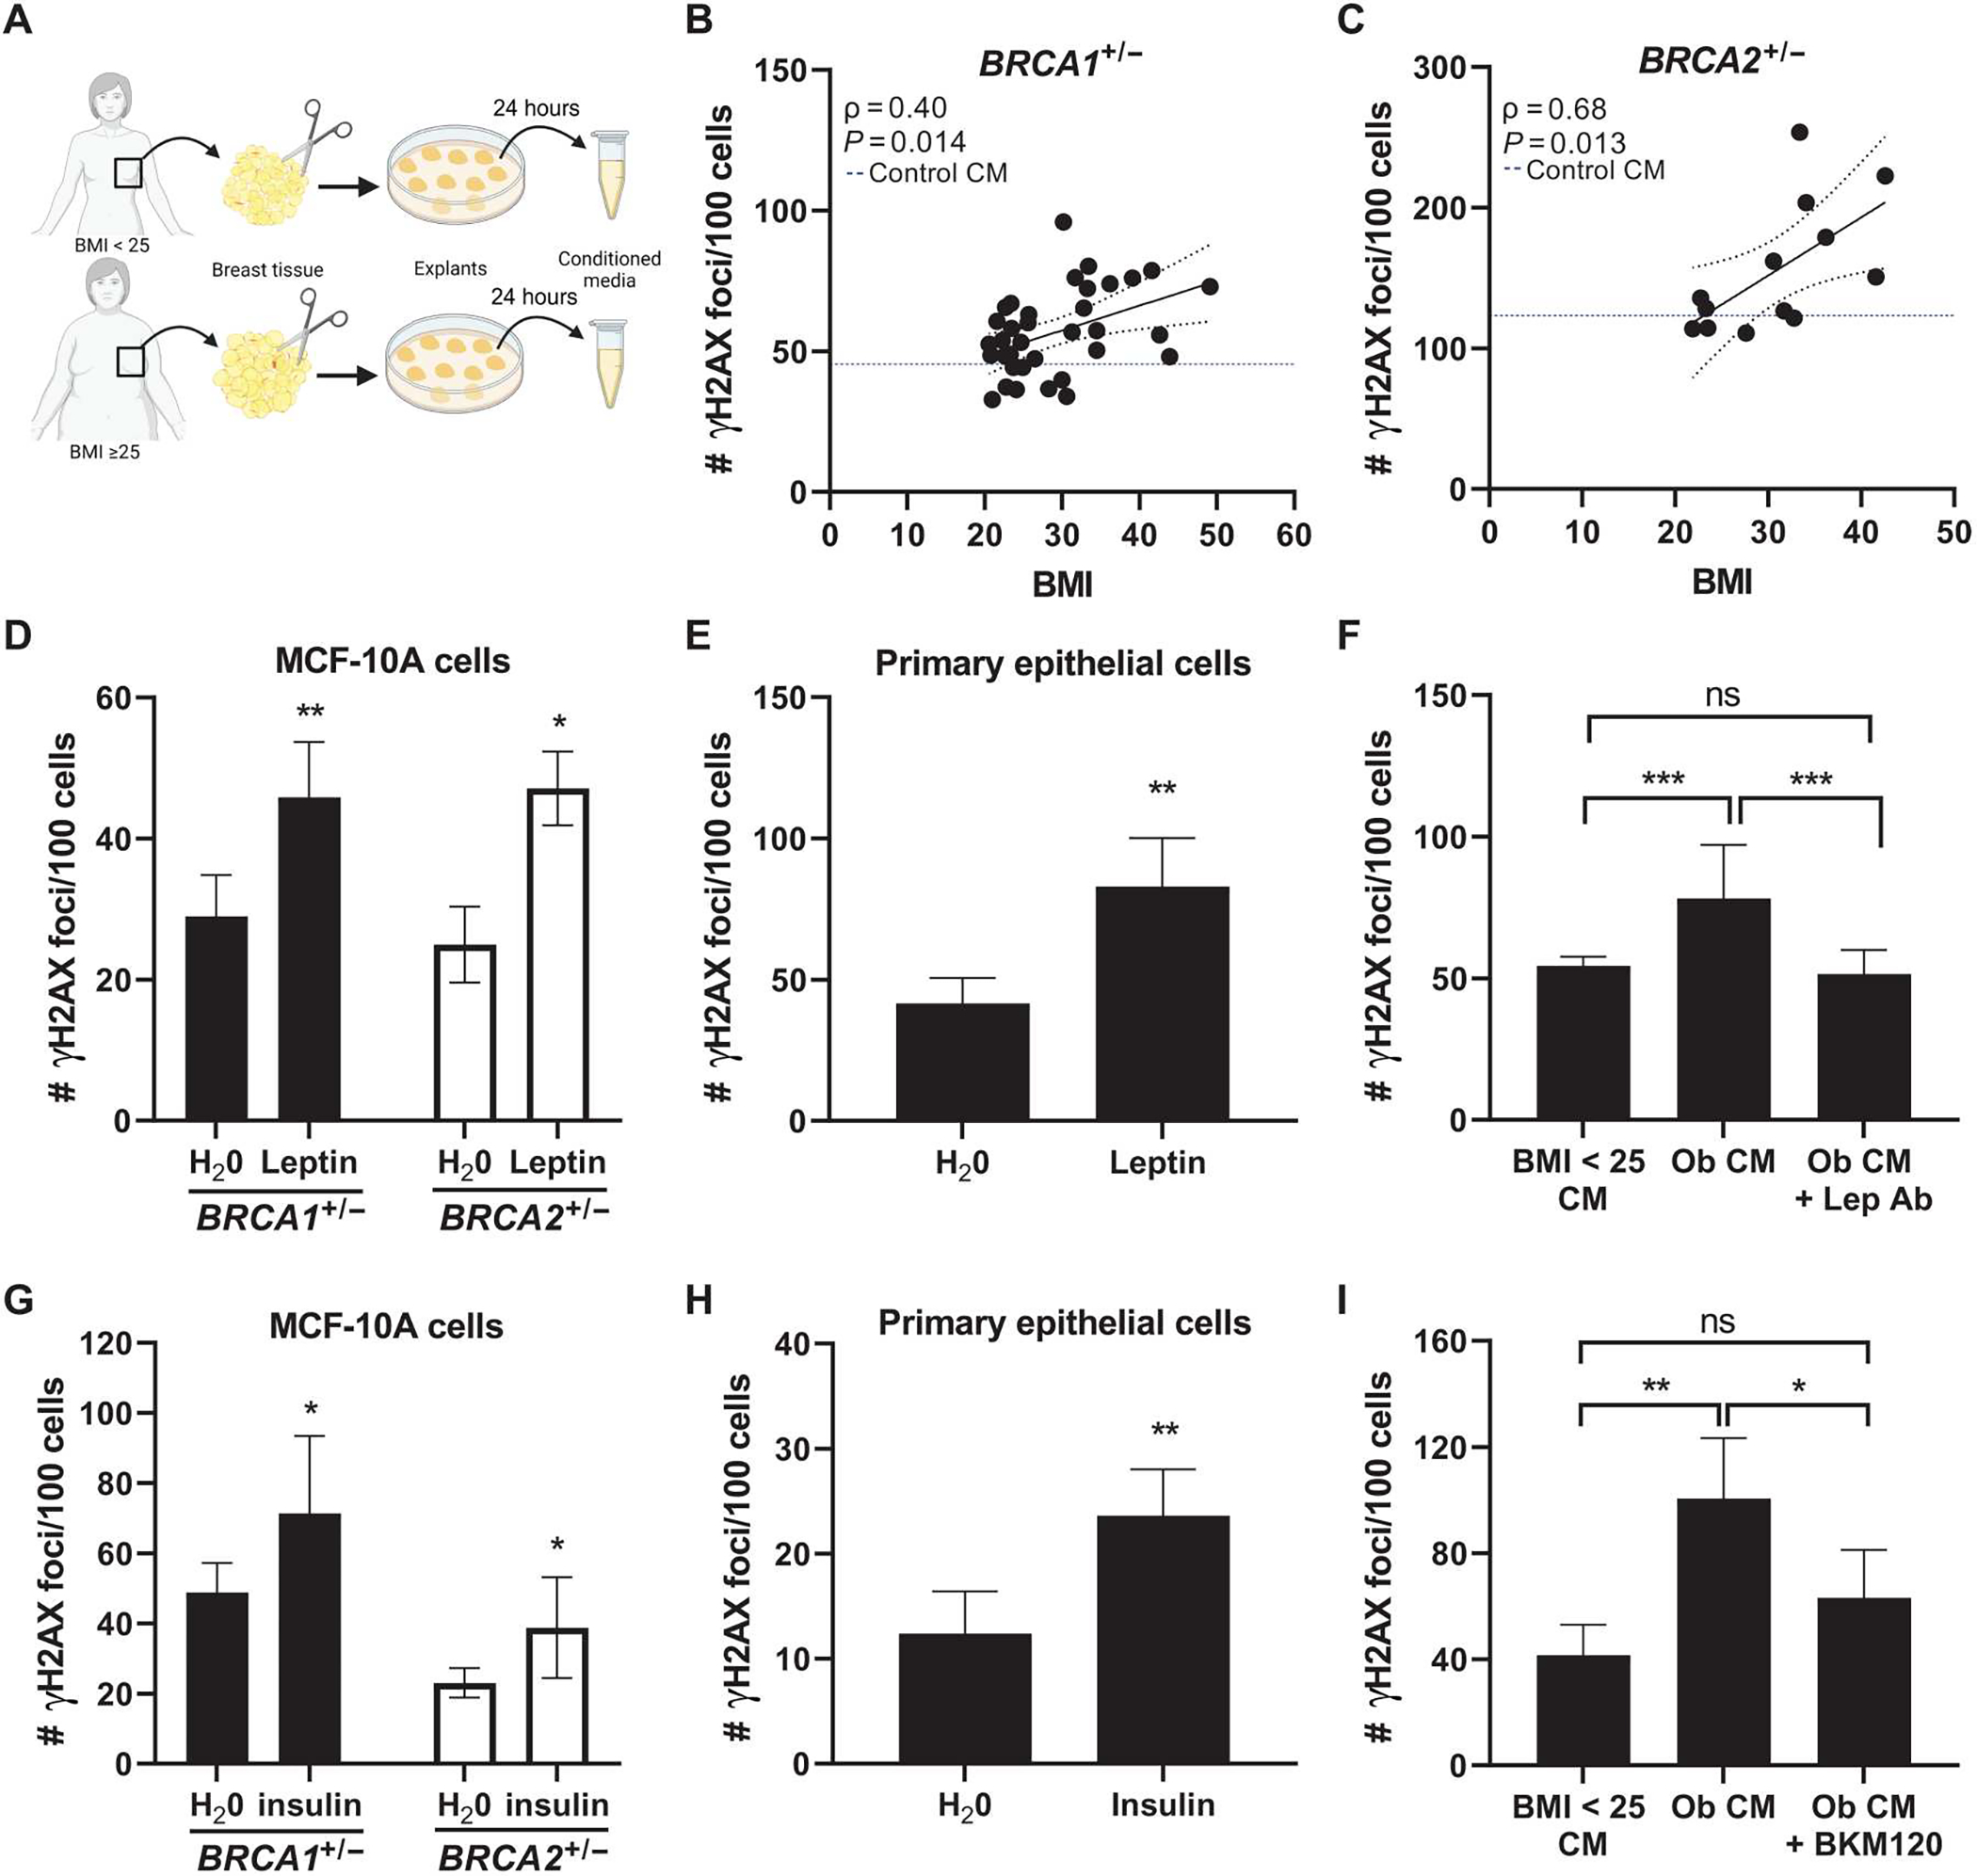
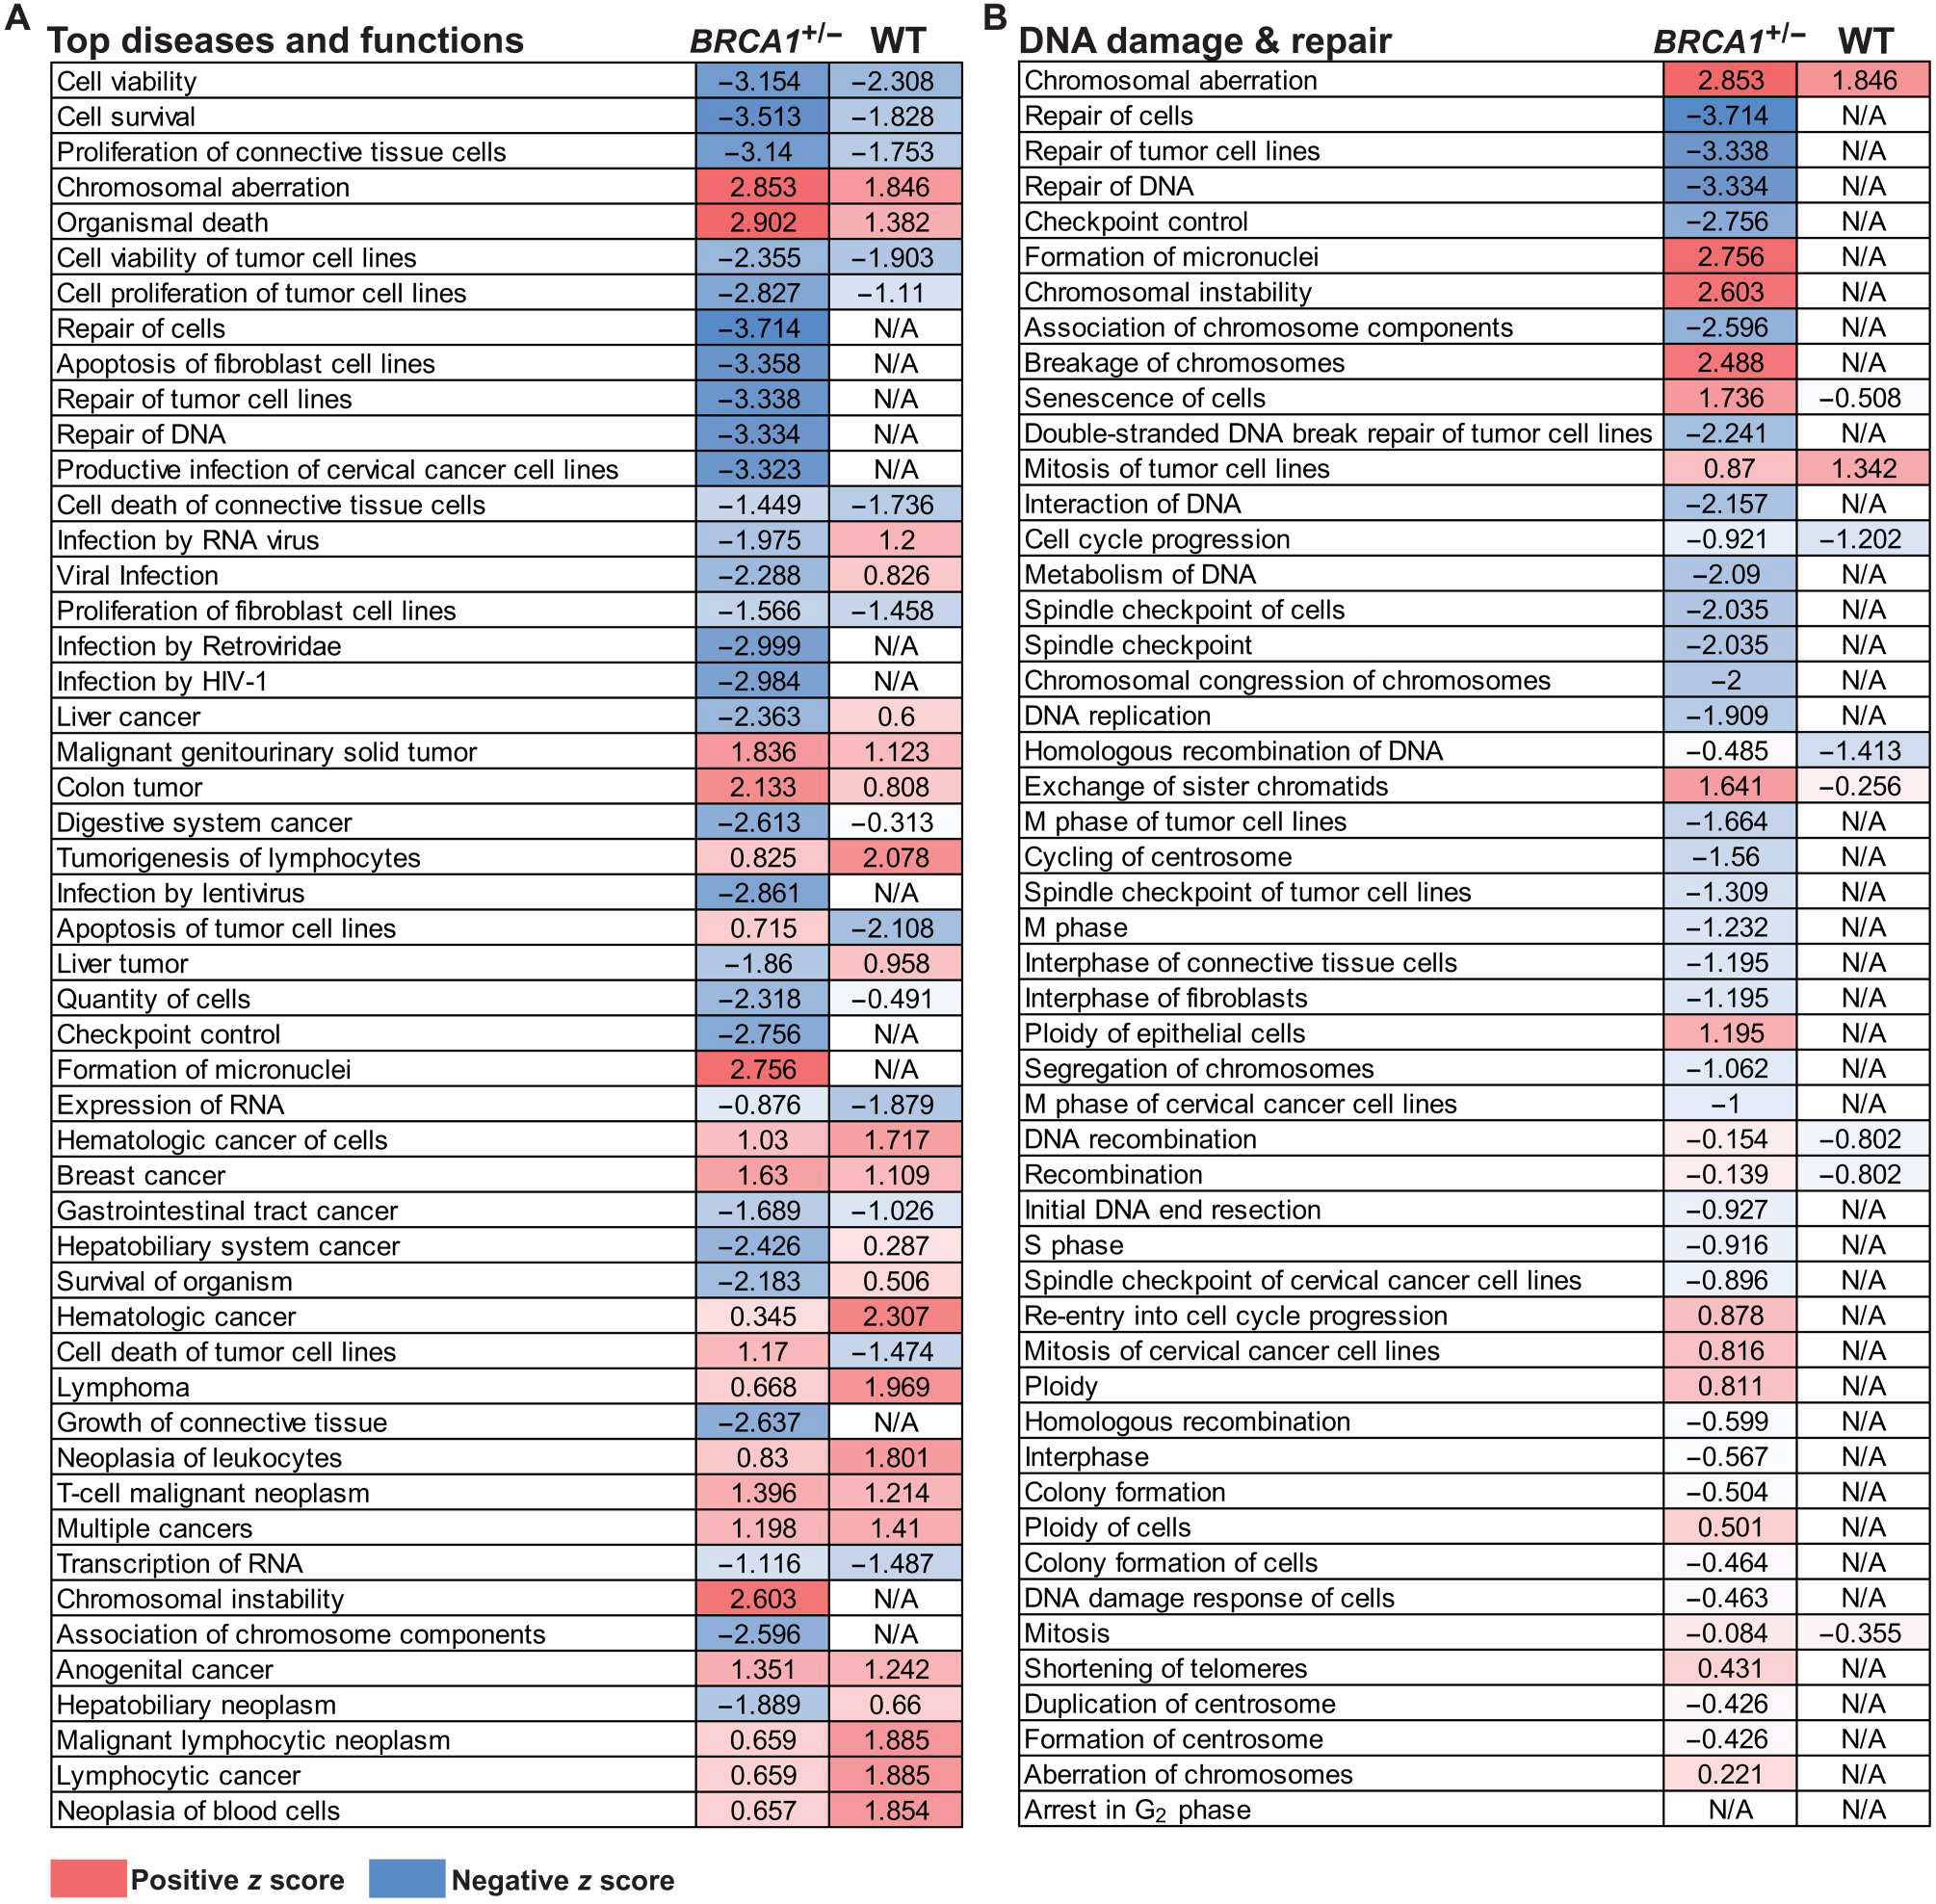
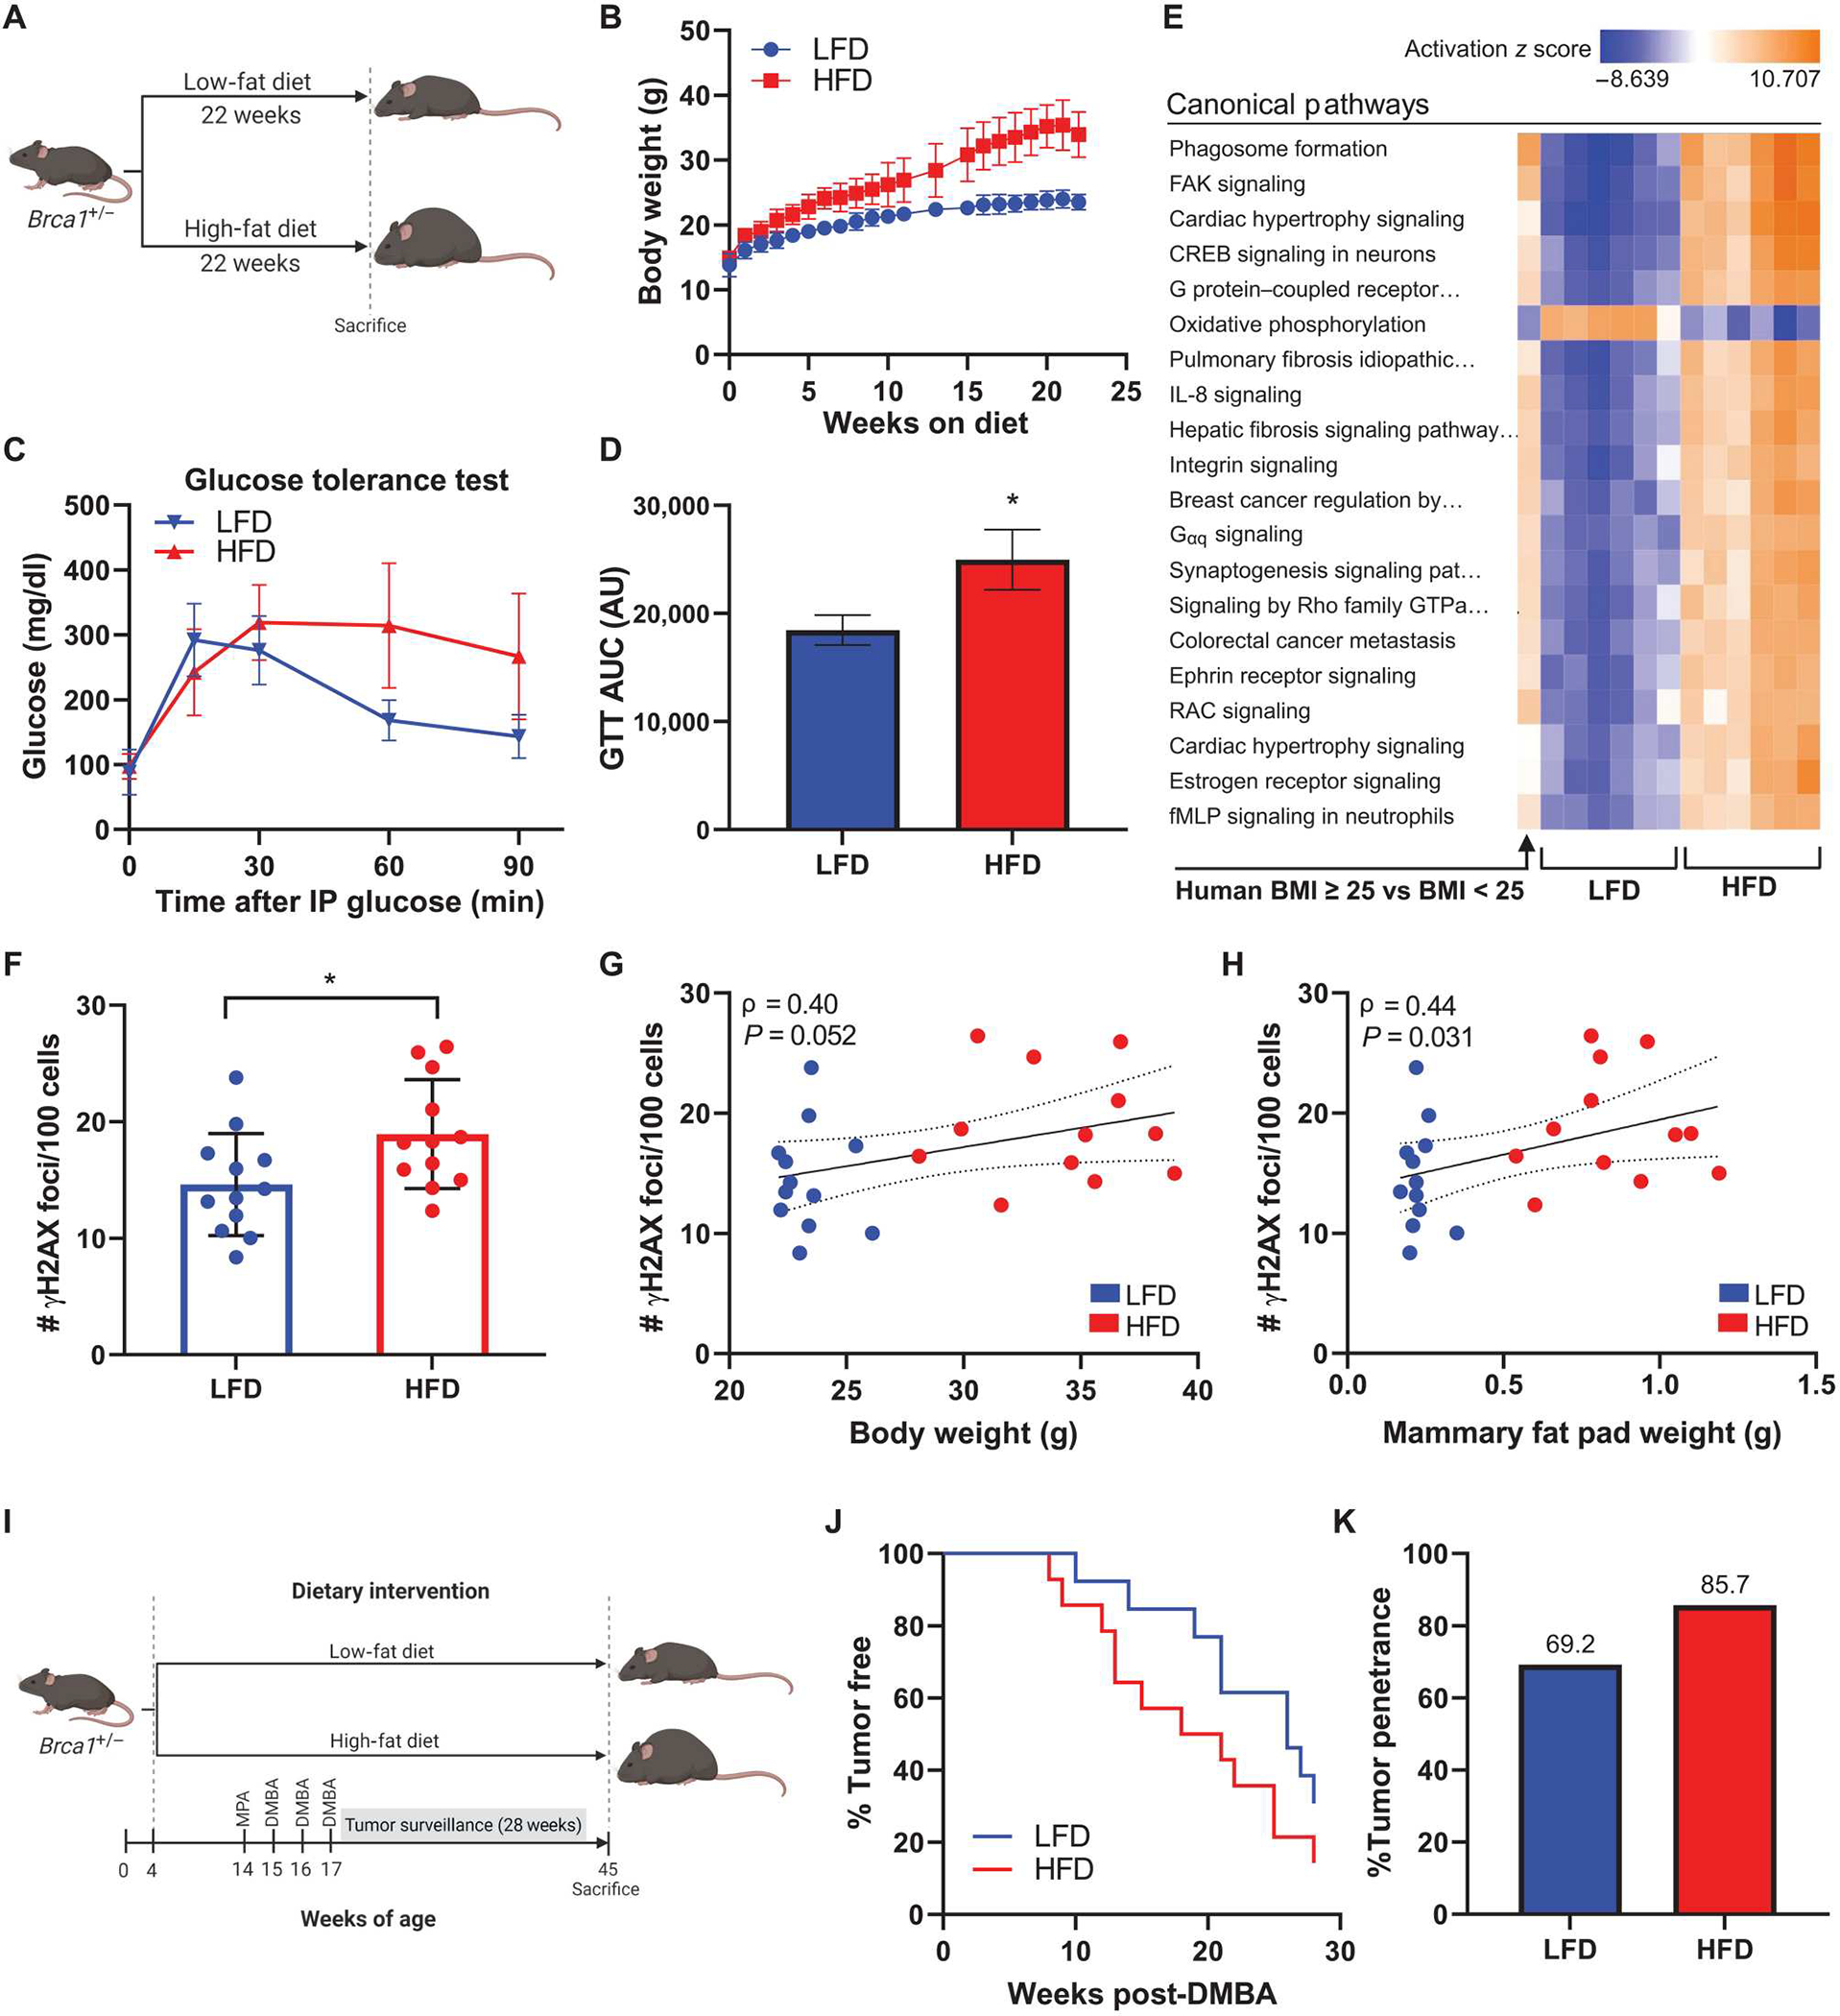
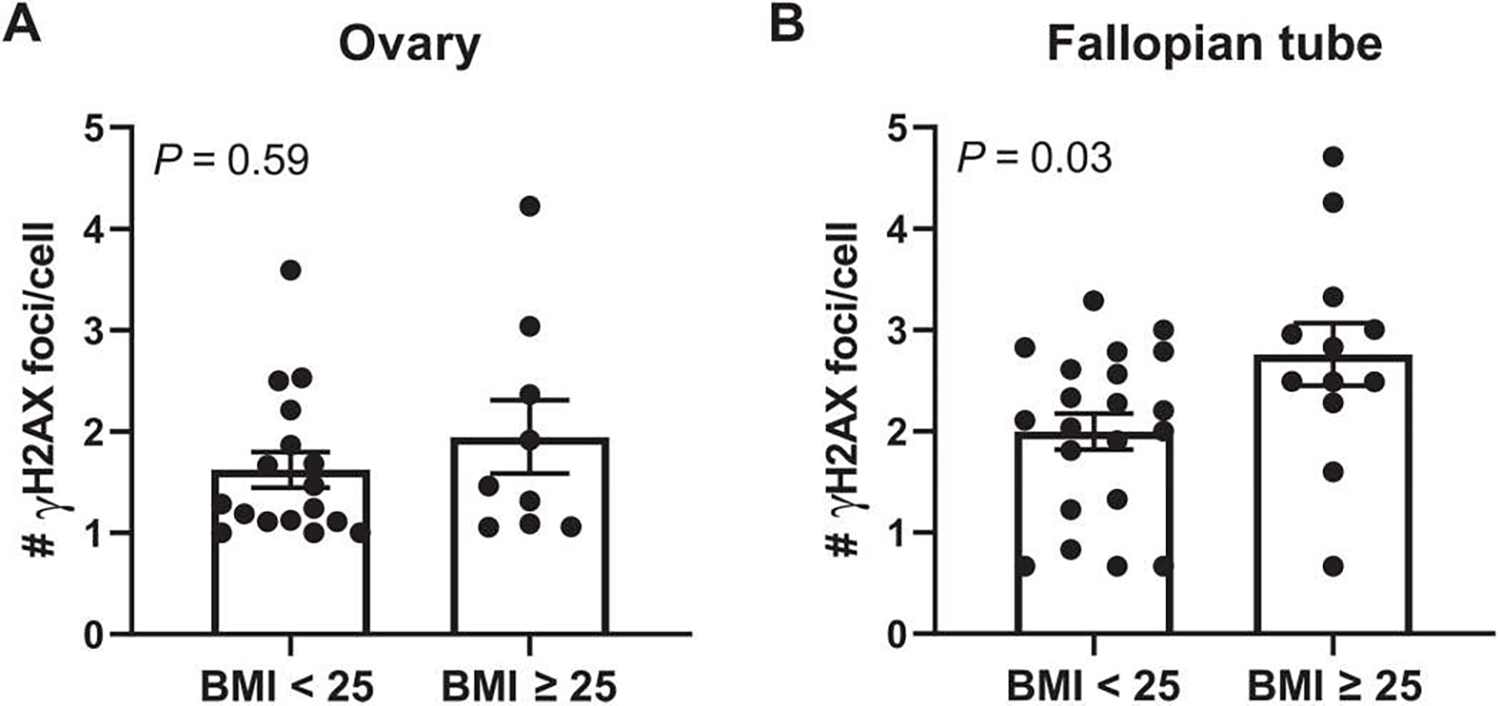
Obesity, defined as a body mass index (BMI) ≥ 30, is an established risk factor for breast cancer among women in the general population after menopause. Whether elevated BMI is a risk factor for women with a germline mutation in BRCA1 or BRCA2 is less clear because of inconsistent findings from epidemiological studies and a lack of mechanistic studies in this population. Here, we show that DNA damage in normal breast epithelia of women carrying a BRCA mutation is positively correlated with BMI and with biomarkers of metabolic dysfunction. In addition, RNA sequencing showed obesity-associated alterations to the breast adipose microenvironment of BRCA mutation carriers, including activation of estrogen biosynthesis, which affected neighboring breast epithelial cells. In breast tissue explants cultured from women carrying a BRCA mutation, we found that blockade of estrogen biosynthesis or estrogen receptor activity decreased DNA damage. Additional obesity-associated factors, including leptin and insulin, increased DNA damage in human BRCA heterozygous epithelial cells, and inhibiting the signaling of these factors with a leptin-neutralizing antibody or PI3K inhibitor, respectively, decreased DNA damage. Furthermore, we show that increased adiposity was associated with mammary gland DNA damage and increased penetrance of mammary tumors in Brca1+/- mice. Overall, our results provide mechanistic evidence in support of a link between elevated BMI and breast cancer development in BRCA mutation carriers. This suggests that maintaining a lower body weight or pharmacologically targeting estrogen or metabolic dysfunction may reduce the risk of breast cancer in this population.


Figures

Fig. 1.
Fig. 1.. BMI and additional clinical characteristics are positively correlated with DNA damage in breast epithelia of women carrying a BRCA mutation.
(A) Representative image of tissue microarray section of normal breast epithelium shown by hematoxylin and eosin (H&E) stain (top) and by IF staining (bottom) for γH2AX (red, arrows) colocalizing with Hoechst (blue). Scale bar, 10 μm. (B) Correlation between epithelial cell DNA damage as measured by number of γH2AX foci/100 cells with BMI in BRCA mutation carriers and in (C) age-matched women WT for BRCA (n = 17). # = number. (D) Correlation between epithelial cell DNA damage and age. (E) Average DNA damage in the study population grouped by menopausal status: premenopausal, n = 46, and postmenopausal, n = 23. Epithelial cell DNA damage correlated with circulating serum biomarkers including (F) sex hormone–binding globulin (SHBG), (G) insulin, (H) glucose, (I) Homeostasis Model Assessment 2 of Insulin Resistance (HOMA2 IR), (J) high-sensitivity C-reactive protein (hsCRP), and (K) interleukin-6 (IL-6) in a subset of the study population with available fasting serum at the time of surgery (n = 41). (L) Average DNA damage in the study population when grouped by those exhibiting histological breast adipose tissue inflammation defined as presence of crown-like structures (CLS) versus those with no CLS present (CLS versus CLS+). Two-tailed Mann-Whitney test was used to determine significant differences in grouped comparisons, and data are presented as means ± SD. Correlation between variables was assessed by Spearman’s rank correlation coefficient (ρ). Associated P value and ρ are shown for continuous variables with 95% confidence intervals. ns, not significant; n = 69 unless otherwise stated.
Fig. 2.
Fig. 2.. Elevated BMI is associated with significant changes in gene expression in breast adipose tissue and in breast epithelial cells of BRCA mutation carriers.
(A) Unsupervised heatmap of whole breast tissue gene expression by RNA-seq in BRCA mutation carriers identified by BMI category of <25 (n = 64, blue) or ≥25 (n = 67, pink). Rows represent individual patients, and columns represent genes. (B) IPA analysis of RNA-seq data showing activation (z score) of the top 20 canonical pathways regulated in breast tissue from BRCA mutation carriers with BMI ≥ 25 compared with carriers with BMI < 25 with an absolute value z score of >0.5. (C) Heatmap of RNA-seq gene expression data generated from breast tissue of BRCA mutation carriers grouped by BMI category of <25 (yellow) or ≥25 (green) showing selected genes associated with estrogen biosynthesis, estradiol (E2) inactivation, and estrogen metabolism. Corresponding gene expression (log2FC) and P values are shown in tissue from women with BMI ≥ 25 relative to BMI < 25. Columns represent individual patients. (D) DNA damage in breast epithelial cells was quantified in tissue sections from n = 61 patients from whom corresponding whole breast tissue RNA-seq data were also available. The cases were stratified by quartile of DNA damage, and the breast tissue gene expression from cases with the highest amount of DNA damage [quartile 4 (Q4)] was compared with that from cases with the lowest amount [quartile 1 (Q1)] of DNA damage. Top 15 canonical pathways regulated in Q4 versus Q1 with an absolute value z score of >2.0 are shown. (E) Representative H&E-stained images of a breast tissue section before digestion and epithelial organoids after isolation. Organoids stained positively for luminal marker cytokeratin 8 (CK8; green) and basal marker cytokeratin 14 (CK14; red) as shown by IF staining merged with Hoechst (blue). Scale bar, 50 μm. (F) IPA analysis of RNA-seq gene expression data showing activation of the top 20 canonical pathways regulated in primary breast epithelial organoids from BRCA mutation carriers with BMI ≥ 25 (n = 9) relative to carriers with BMI < 25 (n = 10) with an absolute value z score of >1.0. The lengths of the bars on all canonical pathway graphs are determined by the Fisher’s exact test. P value with entities that have a −log (P value) > 1.3 is shown.
Fig. 3.
Fig. 3.. Targeting estrogen signaling or production in breast tissue decreases epithelial cell DNA damage in women carrying a mutation in BRCA1 or BRCA2.
(A) Representative IHC staining of ERα expression in breast epithelia from carriers of a BRCA1 or BRCA2 mutation (top). Representative IF staining showing colocalization of number of γH2AX foci (green) with ERα-positive cells (red) (bottom). Scale bar, 10 μm. (B) Experimental schematic showing collection of breast tissue and plating of explants or isolation of primary breast epithelial organoids for treatment studies. (C) Breast epithelial cell DNA damage assessed by IF (number of γH2AX foci/100 cells) in ex vivo breast adipose tissue explants from BRCA mutation carriers treated with fulvestrant (100 nM) for 24 hours (pooled average of n = 7 patients). (D) Aromatase (CYP19A1) expression in breast tissue from BRCA mutation carriers [RNA-seq counts per million (CPM)] correlated with amount of breast epithelial cell DNA damage in corresponding tissue sections (n = 58). Spearman’s rank correlation coefficient (ρ) and associated P value are shown with 95% confidence intervals. (E) Breast epithelial cell DNA damage in ex vivo breast adipose tissue explants from BRCA mutation carriers treated with metformin (0 to 100 μM) for 24 hours (pooled average of n = 3 patients). (F) DNA damage in isolated primary breast epithelial cells from BRCA mutation carriers treated with metformin (0 to 100 μM) for 24 hours (representative of n = 2 experiments). (G) Average E2 concentrations and (H) overlay of E2, testosterone (T), androstenedione, and estrone (E1) concentrations in ex vivo breast adipose explants after 24-hour treatment with metformin (pooled average of n = 3 patients). Student’s t test was used to determine significant differences from control unless otherwise stated. Data are presented as means ± SEM. *P < 0.05, **P < 0.01, ***P < 0.001.
Fig. 4.
Fig. 4.. Obesity-induced changes to the local breast adipose microenvironment promote DNA damage in BRCA1 and BRCA2 heterozygous breast epithelial cells.
(A) Experimental schematic showing the collection of breast adipose tissue conditioned medium (CM) from women with BMI < 25 and with BMI ≥ 25. (B) MCF-10A cells were treated with CM for 24 hours. DNA damage assessed by IF (number of γH2AX foci/100 cells) is shown correlated with BMI in BRCA1+/− (n = 36 CM cases) and (C) BRCA2+/− (n = 13 CM cases) MCF-10A cells. Blue dotted line represents amount of DNA damage induced by control CM (medium not conditioned by adipose explants). Spearman’s rank correlation coefficient (ρ) and associated P value are shown along with 95% confidence intervals. (D) DNA damage in BRCA1+/− and BRCA2+/− MCF-10A cells and in (E) primary BRCA1+/− breast epithelial cells treated with leptin (400 ng/μl) for 24 hours. (F) DNA damage in BRCA1+/− MCF-10A cells after 24-hour treatment with CM derived from a woman with BMI < 25 (“BMI < 25 CM”), with obesity (“Ob CM”), or with Ob CM in the presence of a leptin-neutralizing antibody (“Lep Ab”). (G) DNA damage in BRCA1+/− and BRCA2+/− MCF-10A cells and in (H) primary BRCA2+/− breast epithelial cells treated with insulin (100 nM) for 24 hours. (I) DNA damage in BRCA1+/− MCF-10A cells after 24-hour treatment with BMI < 25 CM, Ob CM, or Ob CM in the presence of PI3K inhibitor BKM120 (1 μM). Student’s t test was used to determine significant differences in (D) to (I). All experiments in MCF-10A cells were conducted a minimum of two times, with representative results from one experiment shown. Data in primary cells were generated from cells treated in triplicate. Data are presented as means ± SD. *P < 0.05, **P < 0.01, ***P < 0.001.
Fig. 5.
Fig. 5.. Breast adipose CM from women with obesity regulates gene expression and pathways associated with DNA damage and repair more robustly in BRCA1+/− MCF-10A cells compared with WT MCF-10A cells.
(A) MCF-10A cells carrying a heterozygous BRCA1 mutation (BRCA1+/−) or WT for BRCA were treated with breast adipose CM from women with BMI ≥ 30 (n = 3) or BMI < 25 (n = 3) for 24 hours. RNA-seq was conducted followed by IPA analysis of differentially expressed genes in BMI ≥ 30 relative to BMI < 25 CM-treated cells. Top 50 regulated “Diseases and Functions” are shown with corresponding activation z score in BRCA1+/− versus WT cells. (B) Diseases and functions were filtered to show pathways involved in DNA damage and DNA repair. Activation z scores are color-coded as heatmaps, with gradations of red representing a positive z score and gradations of blue representing a negative z score. Significantly regulated pathways as defined by −log (P value) > 1.3 are shown. Pathways with cells showing no color and a not applicable (“N/A”) z score were not significantly regulated.
Fig. 6.
Fig. 6.. HFD feeding leads to elevated mammary gland DNA damage in association with increased mammary tumor penetrance and decreased tumor latency in Brca1+/− mice.
(A) Experimental schematic of diet-induced obesity in C57BL6/J female Brca1+/− mice (n = 12 per group). (B) Average body weight of mice fed LFD or HFD over 22 weeks. (C) Glucose tolerance test conducted 1 week before euthanasia and (D) area under curve (AUC) calculation for each group (means ± SEM). AU, arbitrary units. (E) RNA-seq was conducted on whole mammary fat pad tissue from HFD and LFD mice (n = 6 per group). Activation of top 20 canonical pathways regulated in mammary fat pads from HFD mice compared with LFD mice is shown adjacent to corresponding pathway regulation in breast tissue from BRCA mutation carriers with BMI ≥ 25 versus carriers with BMI < 25 (n = 64 to 67 per group). (F) DNA damage assessed by IF (number of γH2AX foci/100 cells) in mammary glands at the time of euthanasia. (G) Correlation between mammary gland DNA damage and mouse body weight and (H) mammary fat pad weight among all mice. Spearman’s rank correlation coefficient (ρ) and associated P values are shown along with 95% confidence intervals. (I) Experimental schematic of medroxyprogesterone acetate/7,12-dimethylbenz[a]anthracene (MPA/DMBA)–induced tumorigenesis model in female Brca1+/− mice randomized to LFD or HFD groups (n = 13 or 14 per group). (J) Mammary tumor development in LFD and HFD mice shown as percentage of mice tumor-free over the 28-week surveillance period. (K) Overall mammary tumor penetrance at the end of the surveillance period shown as percentage of mice in each group that developed a mammary tumor. Student’s t test was used to determine significance unless otherwise stated. Data are presented as means ± SD unless otherwise stated. *P < 0.05.
Fig. 7.
Fig. 7.. BMI is associated with DNA damage in the fallopian tube but not the ovary in women carrying a BRCA mutation.
(A) DNA damage assessed by IF (number of γH2AX foci/cell) in epithelial cells of the ovary and in (B) epithelial cells of fallopian tube fimbriae in BRCA mutation carriers grouped by BMI < 25 (n = 17 to 21 per group) or BMI ≥ 25 (n = 9 to 12). Two-tailed Mann-Whitney test was used to determine significant differences (P value) between groups. Data are presented as means ± SEM.

Comment in

References

    1. Kuchenbaecker KB, Hopper JL, Barnes DR, Phillips K-A, Mooij TM, Roos-Blom M-J, Jervis S, Van Leeuwen FE, Milne RL, Andrieu N, Goldgar DE, Terry MB, Rookus MA, Easton DF, Antoniou AC, Mcguffog L, Evans DG, Barrowdale D, Frost D, Adlard J, Ong KR, Izatt L, Tischkowitz M, Eeles R, Davidson R, Hodgson S, Ellis S, Nogues C, Lasset C, Stoppa-Lyonnet D, Fricker J-P, Faivre L, Berthet P, Hooning MJ, Van Der Kolk LE, Kets CM, Adank MA, John EM, Chung WK, Andrulis IL, Southey M, Daly MB, Buys SS, Osorio A, Engel C, Kast K, Schmutzler RK, Caldes T, Jakubowska A, Simard J, Friedlander ML, Mclachlan S-A, Machackova E, Foretova L, Tan YY, Singer CF, Olah E, Gerdes A-M, Arver B, Olsson H, Risks of breast, ovarian, and contralateral breast cancer for BRCA1 and BRCA2 mutation carriers. JAMA 317, 2402–2416 (2017). - PubMed
    1. Chen S, Parmigiani G, Meta-analysis of BRCA1 and BRCA2 penetrance. J. Clin. Oncol. 25, 1329–1333 (2007). - PMC - PubMed
    1. Lauby-Secretan B, Scoccianti C, Loomis D, Grosse Y, Bianchini F, Straif K, Body fatness and cancer—Viewpoint of the IARC Working Group. N. Engl. J. Med. 375, 794–798 (2016). - PMC - PubMed
    1. King MC, Marks JH, Mandell JB, New G, Breast and ovarian cancer risks due to inherited mutations in BRCA1 and BRCA2. Science 302, 643–646 (2003). - PubMed
    1. Kotsopoulos J, Olopade OI, Ghadirian P, Lubinski J, Lynch HT, Isaacs C, Weber B, Kim-Sing C, Ainsworth P, Foulkes WD, Eisen A, Sun P, Narod SA, Changes in body weight and the risk of breast cancer in BRCA1 and BRCA2 mutation carriers. Breast Cancer Res. 7, R833–R843 (2005). - PMC - PubMed

Publication types