

Real-time, spatial decision support to optimize malaria vector control: The case of indoor residual spraying on Bioko Island, Equatorial Guinea
- PMID: 36812503
- PMCID: PMC9931250
- DOI: 10.1371/journal.pdig.0000025
Real-time, spatial decision support to optimize malaria vector control: The case of indoor residual spraying on Bioko Island, Equatorial Guinea
Abstract
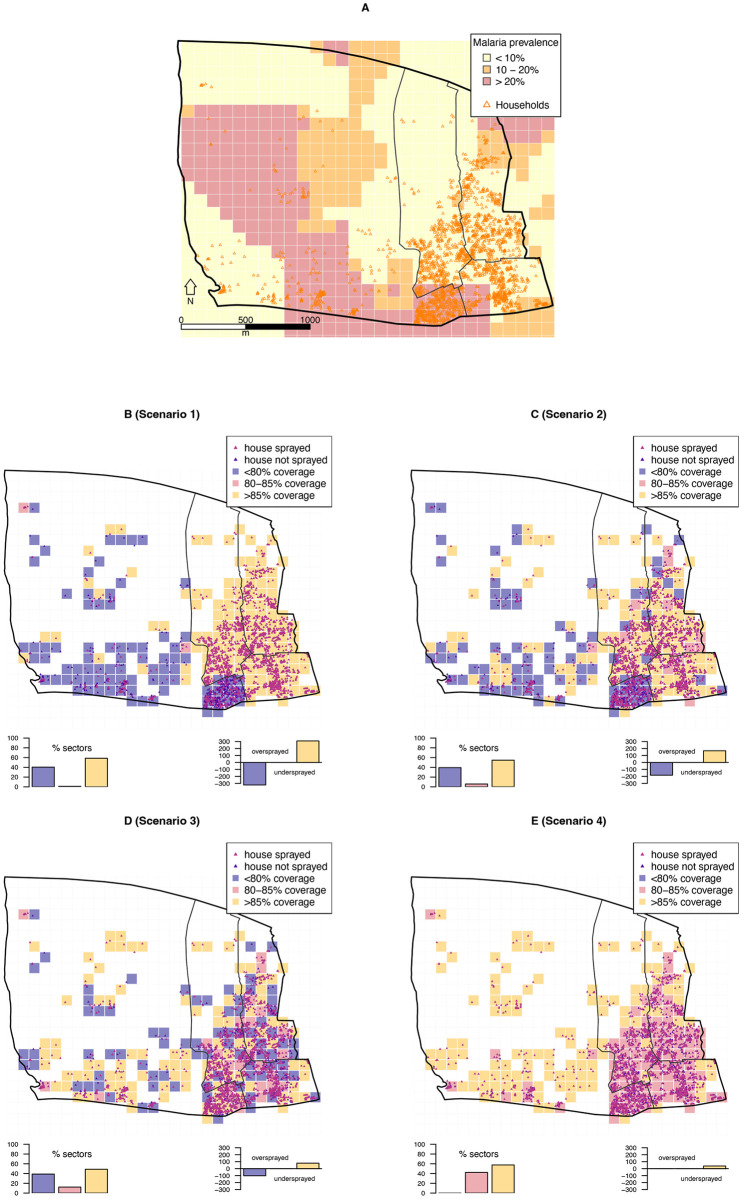
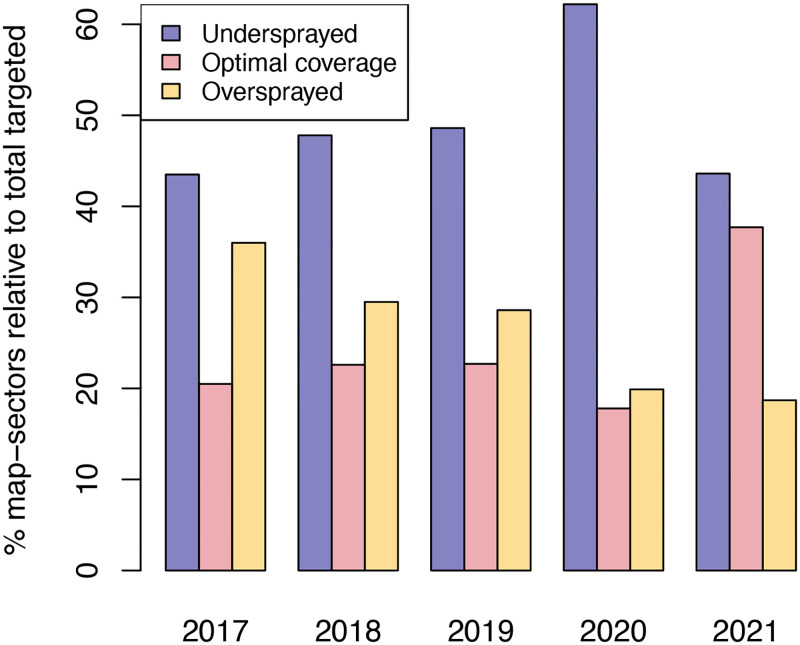
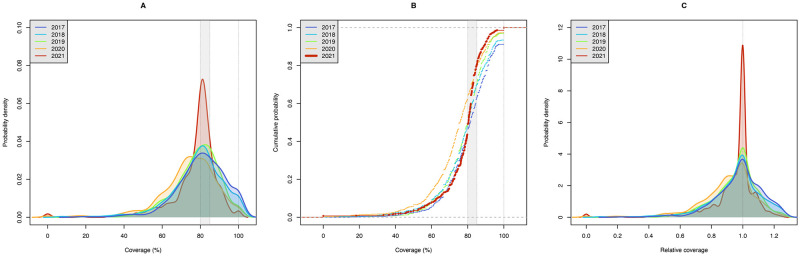
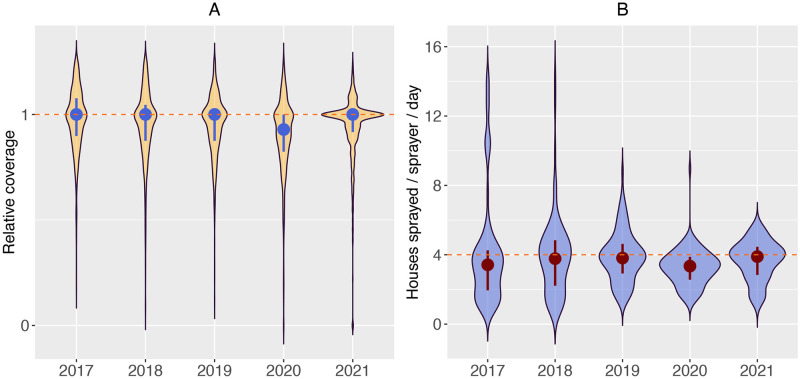
Public health interventions require evidence-based decision-making to maximize impact. Spatial decision support systems (SDSS) are designed to collect, store, process and analyze data to generate knowledge and inform decisions. This paper discusses how the use of a SDSS, the Campaign Information Management System (CIMS), to support malaria control operations on Bioko Island has impacted key process indicators of indoor residual spraying (IRS): coverage, operational efficiency and productivity. We used data from the last five annual IRS rounds (2017 to 2021) to estimate these indicators. IRS coverage was calculated as the percentage of houses sprayed per unit area, represented by 100x100 m map-sectors. Optimal coverage was defined as between 80% and 85%, and under and overspraying as coverage below 80% and above 85%, respectively. Operational efficiency was defined as the fraction of map-sectors that achieved optimal coverage. Daily productivity was expressed as the number of houses sprayed per sprayer per day (h/s/d). These indicators were compared across the five rounds. Overall IRS coverage (i.e. percent of total houses sprayed against the overall denominator by round) was highest in 2017 (80.2%), yet this round showed the largest proportion of oversprayed map-sectors (36.0%). Conversely, despite producing a lower overall coverage (77.5%), the 2021 round showed the highest operational efficiency (37.7%) and the lowest proportion of oversprayed map-sectors (18.7%). In 2021, higher operational efficiency was also accompanied by marginally higher productivity. Productivity ranged from 3.3 h/s/d in 2020 to 3.9 h/s/d in 2021 (median 3.6 h/s/d). Our findings showed that the novel approach to data collection and processing proposed by the CIMS has significantly improved the operational efficiency of IRS on Bioko. High spatial granularity during planning and deployment together with closer follow-up of field teams using real-time data supported more homogeneous delivery of optimal coverage while sustaining high productivity.
Copyright: © 2022 García et al. This is an open access article distributed under the terms of the Creative Commons Attribution License, which permits unrestricted use, distribution, and reproduction in any medium, provided the original author and source are credited.
Conflict of interest statement
The authors have declared that no competing interests exist.
Figures
Similar articles
-
Assessing IRS performance in a gender-integrated vector control programme on Bioko Island, Equatorial Guinea, 2010-2021.Malar J. 2023 Oct 25;22(1):323. doi: 10.1186/s12936-023-04755-4. Malar J. 2023. PMID: 37880774 Free PMC article.
-
Reconsidering indoor residual spraying coverage targets: A retrospective analysis of high-resolution programmatic malaria control data.Proc Natl Acad Sci U S A. 2025 Apr 22;122(16):e2421531122. doi: 10.1073/pnas.2421531122. Epub 2025 Apr 14. Proc Natl Acad Sci U S A. 2025. PMID: 40228135 Free PMC article.
-
Improving the performance of spray operators through monitoring and evaluation of insecticide concentrations of pirimiphos-methyl during indoor residual spraying for malaria control on Bioko Island.Malar J. 2020 Jan 21;19(1):35. doi: 10.1186/s12936-020-3118-y. Malar J. 2020. PMID: 31964374 Free PMC article.
-
Malaria transmission after five years of vector control on Bioko Island, Equatorial Guinea.Parasit Vectors. 2012 Nov 12;5:253. doi: 10.1186/1756-3305-5-253. Parasit Vectors. 2012. PMID: 23146423 Free PMC article.
-
A spatial decision support system for guiding focal indoor residual interventions in a malaria elimination zone.Geospat Health. 2011 Nov;6(1):21-31. doi: 10.4081/gh.2011.154. Geospat Health. 2011. PMID: 22109860
Cited by
-
Assessing IRS performance in a gender-integrated vector control programme on Bioko Island, Equatorial Guinea, 2010-2021.Malar J. 2023 Oct 25;22(1):323. doi: 10.1186/s12936-023-04755-4. Malar J. 2023. PMID: 37880774 Free PMC article.
-
Impact of six-month COVID-19 travel moratorium on Plasmodium falciparum prevalence on Bioko Island, Equatorial Guinea.Nat Commun. 2024 Sep 27;15(1):8285. doi: 10.1038/s41467-024-52638-2. Nat Commun. 2024. PMID: 39333562 Free PMC article.
-
Mosquito control by abatement programmes in the United States: perspectives and lessons for countries in sub-Saharan Africa.Malar J. 2024 Jan 4;23(1):8. doi: 10.1186/s12936-023-04829-3. Malar J. 2024. PMID: 38178145 Free PMC article. Review.
-
Testing indoor residual spraying coverage targets for malaria control, Bioko, Equatorial Guinea.Bull World Health Organ. 2025 Jun 1;103(6):392-402. doi: 10.2471/BLT.24.292505. Epub 2025 May 3. Bull World Health Organ. 2025. PMID: 40511394 Free PMC article.
-
Identifying individual, household and environmental risk factors for malaria infection on Bioko Island to inform interventions.Malar J. 2023 Mar 1;22(1):72. doi: 10.1186/s12936-023-04504-7. Malar J. 2023. PMID: 36859263 Free PMC article.
References
-
- Dowell SF, Blazes D, Desmond-Hellmann S. Four steps to precision public health. Nature. 2016;540(7632):189–191. doi: 10.1038/540189a - DOI
-
- Dixon BE, Kharrazi H, Papagari Sangareddy SR. In: Magnuson JA, Dixon BE, editors. Public Health Decision Support Systems. Cham: Springer International Publishing; 2020. p. 349–365. Available from: 10.1007/978-3-030-41215-9_20. - DOI
Grants and funding
LinkOut - more resources
Full Text Sources