

Generalizability challenges of mortality risk prediction models: A retrospective analysis on a multi-center database
- PMID: 36812510
- PMCID: PMC9931319
- DOI: 10.1371/journal.pdig.0000023
Generalizability challenges of mortality risk prediction models: A retrospective analysis on a multi-center database
Abstract
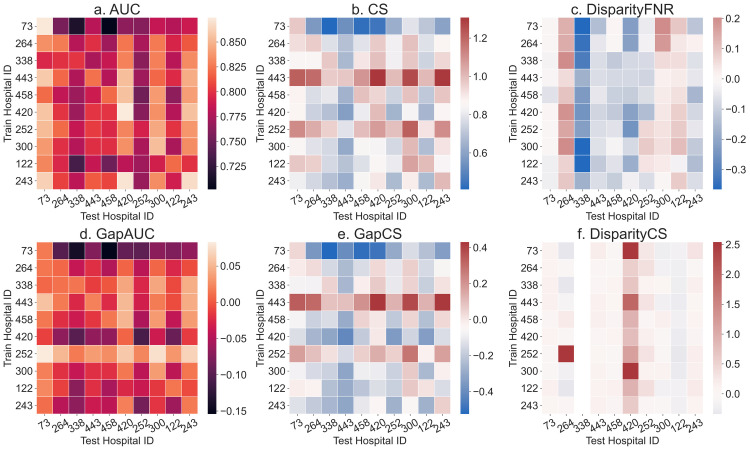
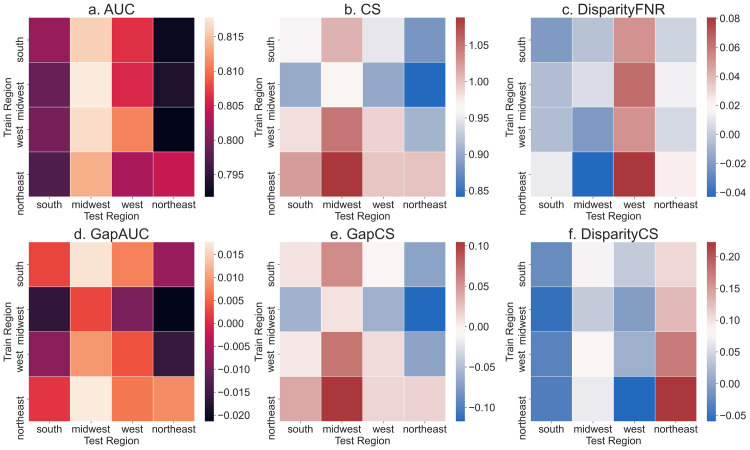
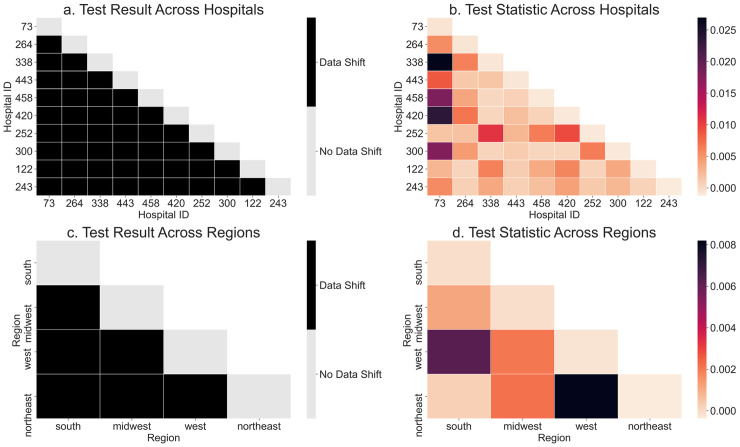
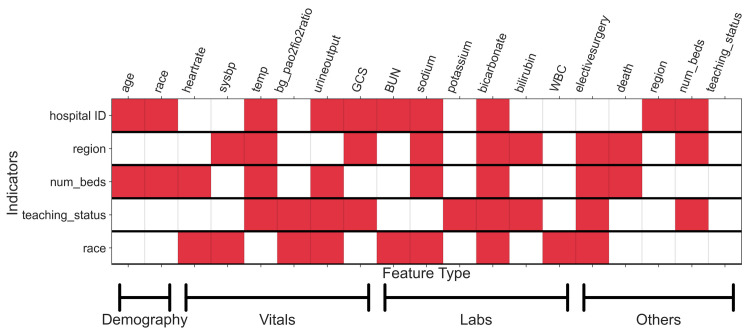
Modern predictive models require large amounts of data for training and evaluation, absence of which may result in models that are specific to certain locations, populations in them and clinical practices. Yet, best practices for clinical risk prediction models have not yet considered such challenges to generalizability. Here we ask whether population- and group-level performance of mortality prediction models vary significantly when applied to hospitals or geographies different from the ones in which they are developed. Further, what characteristics of the datasets explain the performance variation? In this multi-center cross-sectional study, we analyzed electronic health records from 179 hospitals across the US with 70,126 hospitalizations from 2014 to 2015. Generalization gap, defined as difference between model performance metrics across hospitals, is computed for area under the receiver operating characteristic curve (AUC) and calibration slope. To assess model performance by the race variable, we report differences in false negative rates across groups. Data were also analyzed using a causal discovery algorithm "Fast Causal Inference" that infers paths of causal influence while identifying potential influences associated with unmeasured variables. When transferring models across hospitals, AUC at the test hospital ranged from 0.777 to 0.832 (1st-3rd quartile or IQR; median 0.801); calibration slope from 0.725 to 0.983 (IQR; median 0.853); and disparity in false negative rates from 0.046 to 0.168 (IQR; median 0.092). Distribution of all variable types (demography, vitals, and labs) differed significantly across hospitals and regions. The race variable also mediated differences in the relationship between clinical variables and mortality, by hospital/region. In conclusion, group-level performance should be assessed during generalizability checks to identify potential harms to the groups. Moreover, for developing methods to improve model performance in new environments, a better understanding and documentation of provenance of data and health processes are needed to identify and mitigate sources of variation.
Copyright: © 2022 Singh et al. This is an open access article distributed under the terms of the Creative Commons Attribution License, which permits unrestricted use, distribution, and reproduction in any medium, provided the original author and source are credited.
Conflict of interest statement
The authors have declared that no competing interests exist.
Figures
Similar articles
-
Establishment and evaluation of a multicenter collaborative prediction model construction framework supporting model generalization and continuous improvement: A pilot study.Int J Med Inform. 2020 Sep;141:104173. doi: 10.1016/j.ijmedinf.2020.104173. Epub 2020 May 30. Int J Med Inform. 2020. PMID: 32531725
-
How Does the Skeletal Oncology Research Group Algorithm's Prediction of 5-year Survival in Patients with Chondrosarcoma Perform on International Validation?Clin Orthop Relat Res. 2020 Oct;478(10):2300-2308. doi: 10.1097/CORR.0000000000001305. Clin Orthop Relat Res. 2020. PMID: 32433107 Free PMC article.
-
Variable generalization performance of a deep learning model to detect pneumonia in chest radiographs: A cross-sectional study.PLoS Med. 2018 Nov 6;15(11):e1002683. doi: 10.1371/journal.pmed.1002683. eCollection 2018 Nov. PLoS Med. 2018. PMID: 30399157 Free PMC article.
-
External validation: a simulation study to compare cross-validation versus holdout or external testing to assess the performance of clinical prediction models using PET data from DLBCL patients.EJNMMI Res. 2022 Sep 11;12(1):58. doi: 10.1186/s13550-022-00931-w. EJNMMI Res. 2022. PMID: 36089634 Free PMC article.
-
Prediction of myopia development among Chinese school-aged children using refraction data from electronic medical records: A retrospective, multicentre machine learning study.PLoS Med. 2018 Nov 6;15(11):e1002674. doi: 10.1371/journal.pmed.1002674. eCollection 2018 Nov. PLoS Med. 2018. PMID: 30399150 Free PMC article.
Cited by
-
External validation of AI models in health should be replaced with recurring local validation.Nat Med. 2023 Nov;29(11):2686-2687. doi: 10.1038/s41591-023-02540-z. Nat Med. 2023. PMID: 37853136 No abstract available.
-
Predicting Mortality in Trauma Research: Evaluating the Performance of Trauma Scoring Tools in a South African Population.Cureus. 2024 Oct 10;16(10):e71225. doi: 10.7759/cureus.71225. eCollection 2024 Oct. Cureus. 2024. PMID: 39399278 Free PMC article.
-
Impact of localized fine tuning in the performance of segmentation and classification of lung nodules from computed tomography scans using deep learning.Front Oncol. 2023 Mar 28;13:1140635. doi: 10.3389/fonc.2023.1140635. eCollection 2023. Front Oncol. 2023. PMID: 37056345 Free PMC article.
-
Statistical Inference for Maximin Effects: Identifying Stable Associations across Multiple Studies.J Am Stat Assoc. 2024;119(547):1968-1984. doi: 10.1080/01621459.2023.2233162. Epub 2023 Aug 4. J Am Stat Assoc. 2024. PMID: 39651449 Free PMC article.
-
Performance Drift in a Nationally Deployed Population Health Risk Algorithm in the US Veterans Health Administration.JAMA Health Forum. 2025 Aug 1;6(8):e252717. doi: 10.1001/jamahealthforum.2025.2717. JAMA Health Forum. 2025. PMID: 40815520 Free PMC article.
References
-
- Chen IY, Szolovits P, Ghassemi M. Can AI Help Reduce Disparities in General Medical and Mental Health Care? AMA J ethics. 2019;21(2):167–79. - PubMed
LinkOut - more resources
Full Text Sources
Miscellaneous