

Applied machine learning for the risk-stratification and clinical decision support of hospitalised patients with dengue in Vietnam
- PMID: 36812518
- PMCID: PMC9931311
- DOI: 10.1371/journal.pdig.0000005
Applied machine learning for the risk-stratification and clinical decision support of hospitalised patients with dengue in Vietnam
Abstract
Background: Identifying patients at risk of dengue shock syndrome (DSS) is vital for effective healthcare delivery. This can be challenging in endemic settings because of high caseloads and limited resources. Machine learning models trained using clinical data could support decision-making in this context.
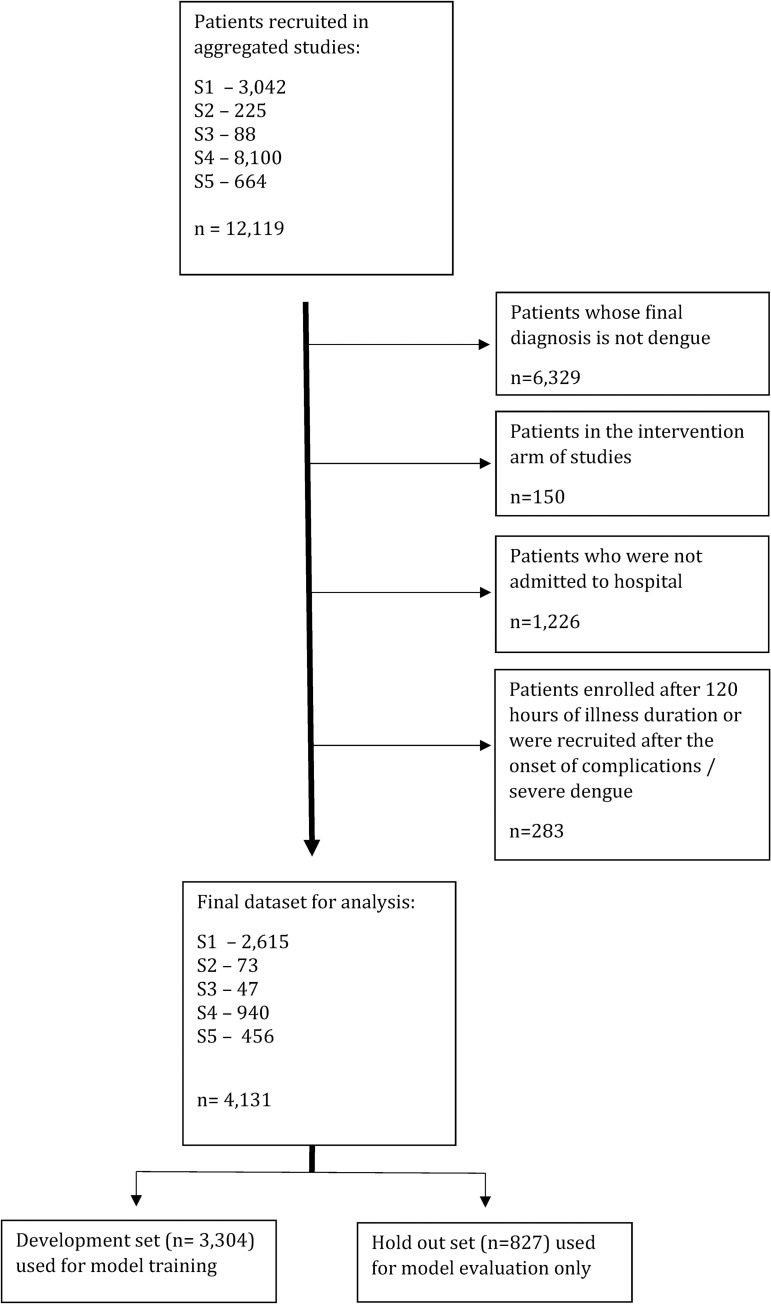
Methods: We developed supervised machine learning prediction models using pooled data from adult and paediatric patients hospitalised with dengue. Individuals from 5 prospective clinical studies in Ho Chi Minh City, Vietnam conducted between 12th April 2001 and 30th January 2018 were included. The outcome was onset of dengue shock syndrome during hospitalisation. Data underwent random stratified splitting at 80:20 ratio with the former used only for model development. Ten-fold cross-validation was used for hyperparameter optimisation and confidence intervals derived from percentile bootstrapping. Optimised models were evaluated against the hold-out set.
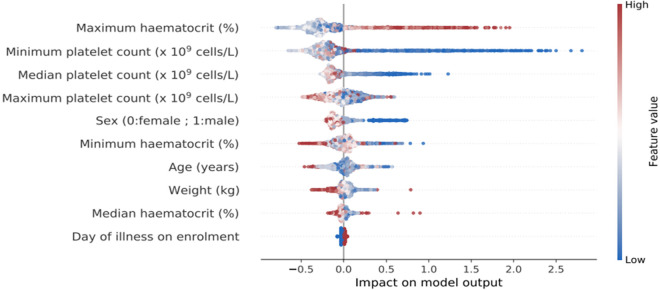
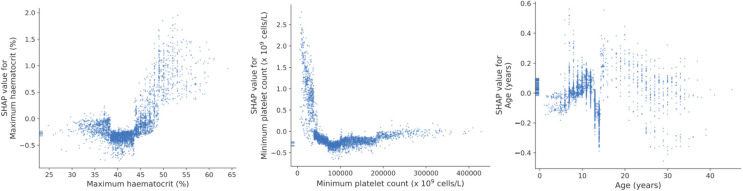
Findings: The final dataset included 4,131 patients (477 adults and 3,654 children). DSS was experienced by 222 (5.4%) of individuals. Predictors were age, sex, weight, day of illness at hospitalisation, indices of haematocrit and platelets over first 48 hours of admission and before the onset of DSS. An artificial neural network model (ANN) model had best performance with an area under receiver operator curve (AUROC) of 0.83 (95% confidence interval [CI], 0.76-0.85) in predicting DSS. When evaluated against the independent hold-out set this calibrated model exhibited an AUROC of 0.82, specificity of 0.84, sensitivity of 0.66, positive predictive value of 0.18 and negative predictive value of 0.98.
Interpretation: The study demonstrates additional insights can be obtained from basic healthcare data, when applied through a machine learning framework. The high negative predictive value could support interventions such as early discharge or ambulatory patient management in this population. Work is underway to incorporate these findings into an electronic clinical decision support system to guide individual patient management.
Copyright: © 2022 Ming et al. This is an open access article distributed under the terms of the Creative Commons Attribution License, which permits unrestricted use, distribution, and reproduction in any medium, provided the original author and source are credited.
Conflict of interest statement
The authors have declared that no competing interests exist
Figures
References
Grants and funding
LinkOut - more resources
Full Text Sources
Miscellaneous