. 2023 Jan 5;2(1):e0000162.
doi: 10.1371/journal.pdig.0000162. eCollection 2023 Jan.

Informing antimicrobial stewardship with explainable AI

Affiliations

Informing antimicrobial stewardship with explainable AI

Massimo Cavallaro et al. PLOS Digit Health. .

Abstract

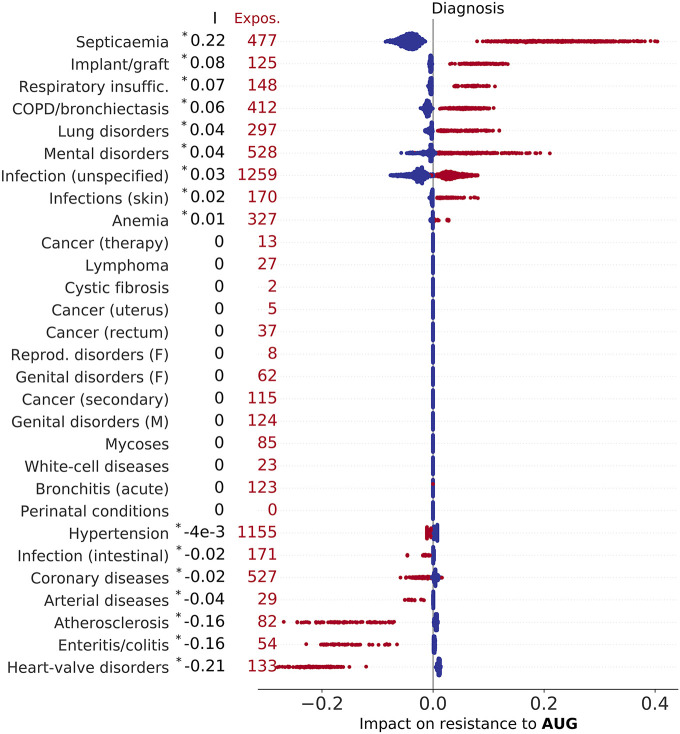
The accuracy and flexibility of artificial intelligence (AI) systems often comes at the cost of a decreased ability to offer an intuitive explanation of their predictions. This hinders trust and discourage adoption of AI in healthcare, exacerbated by concerns over liabilities and risks to patients' health in case of misdiagnosis. Providing an explanation for a model's prediction is possible due to recent advances in the field of interpretable machine learning. We considered a data set of hospital admissions linked to records of antibiotic prescriptions and susceptibilities of bacterial isolates. An appropriately trained gradient boosted decision tree algorithm, supplemented by a Shapley explanation model, predicts the likely antimicrobial drug resistance, with the odds of resistance informed by characteristics of the patient, admission data, and historical drug treatments and culture test results. Applying this AI-based system, we found that it substantially reduces the risk of mismatched treatment compared with the observed prescriptions. The Shapley values provide an intuitive association between observations/data and outcomes; the associations identified are broadly consistent with expectations based on prior knowledge from health specialists. The results, and the ability to attribute confidence and explanations, support the wider adoption of AI in healthcare.


Conflict of interest statement

The authors have declared that no competing interests exist.

Figures

Fig 1
Fig 1. Prediction accuracy vs prediction impurity.
Impurity frequency not to scale.
Fig 2
Fig 2. Impact of present use of antibiotics on resistance to AUG, CIP, MEM, and TAZ treatment (A,B,C, and D panels, respectively).
Each marker represents an admission event, with colour red indicating exposure to the treatment and total number of treated episodes reported on the left for each drug. The corresponding Shapley values are represented as horizontal coordinates. Values of the slope index I are reported as measures of the direction and strength of association of the factor with AMR outcome (see also Table E in S1 Text, asterisk (*) indicates statistical significance, P < 0.01).
Fig 3
Fig 3. Impact of past use of antibiotics (i.e., antibiotics prescribed in a previous admission) on resistance to AUG, CIP, MEM, and TAZ treatment (A,B,C, and D panels, respectively).
Each marker represents an admission event, with colour red indicating past exposure to drug treatment. The total number of episodes that were exposed to drug treatment in previous admissions are reported on the left for each drug. Keys as in Fig 2.
Fig 4
Fig 4. Impact of past resistance reports (obtained by cultures tested during past admission) on resistance to AUG, CIP, MEM, and TAZ treatment (A,B,C, and D panels, respectively).
Blue marker color indicates no resistance previously found, while light orange to dark red colors correspond to increasing number N of times an isolate was found resistant in past admissions (inset colormaps). As in Fig 2, each marker represents an admission event and the corresponding Shapley values are represented as horizontal coordinates. Values of the slope index I are reported as measures of the direction and strength of association of the factor with AMR outcome (see also Table E in S1 Text, asterisk (*) indicates statistical significance, P < 0.01).
Fig 5
Fig 5. Impact of morbidities (including cystic fibrosis and other diseases classified according to Summary Hospital-level Mortality Indicator (SHMI) codes) on resistance to AUG.
Factors are ranked by index I (top to bottom, values of I reported on the left), which measures the direction and strength of a factor’s association with outcome (see also Table E in S1 Text, asterisk (*) indicates statistical significance, P < 0.01). Each marker represents an admission event, horizontal coordinates representing Shapley values, with colour red indicating presence of morbidity, and total number of diagnosed inpatients reported on the left for each disease (Expos.). The impact of diseases on resistance to CIP, MEM, and TAZ are illustrated in S3, S4 and S5 Figs, respectively.

References

    1. Wiens J, Shenoy ES. Machine Learning for Healthcare: On the Verge of a Major Shift in Healthcare Epidemiology. Clinical Infectious Diseases. 2018;66(1):149–153. doi: 10.1093/cid/cix731 - DOI - PMC - PubMed
    1. Malik A, Patel P, Ehsan L, Guleria S, Hartka T, Adewole S, et al.. Ten simple rules for engaging with artificial intelligence in biomedicine. PLoS Computational Biology. 2021;17(2):e1008531. doi: 10.1371/journal.pcbi.1008531 - DOI - PMC - PubMed
    1. Nicholson Price II W. Risks and remedies for artificial intelligence in health care. 2019. Available from: https://www.brookings.edu/research/risks-and-remedies-for-artificial-int... (Accessed 1/12/2022).
    1. Understanding healthcare workers’ confidence in AI. 2022. Available from: https://digital-transformation.hee.nhs.uk/building-a-digital-workforce/d... (Accessed 1/12/2022).
    1. Adadi A, Berrada M. Peeking Inside the Black-Box: A Survey on Explainable Artificial Intelligence (XAI). IEEE Access. 2018;6:52138–52160. doi: 10.1109/ACCESS.2018.2870052 - DOI

LinkOut - more resources