

Longitudinally tracking personal physiomes for precision management of childhood epilepsy
- PMID: 36812648
- PMCID: PMC9931296
- DOI: 10.1371/journal.pdig.0000161
Longitudinally tracking personal physiomes for precision management of childhood epilepsy
Abstract
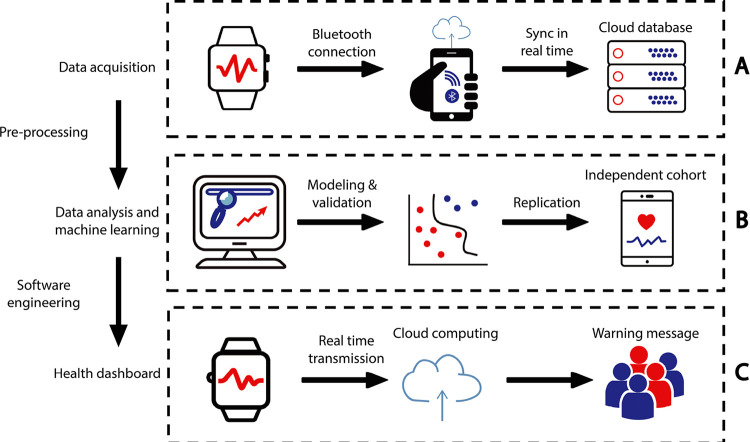
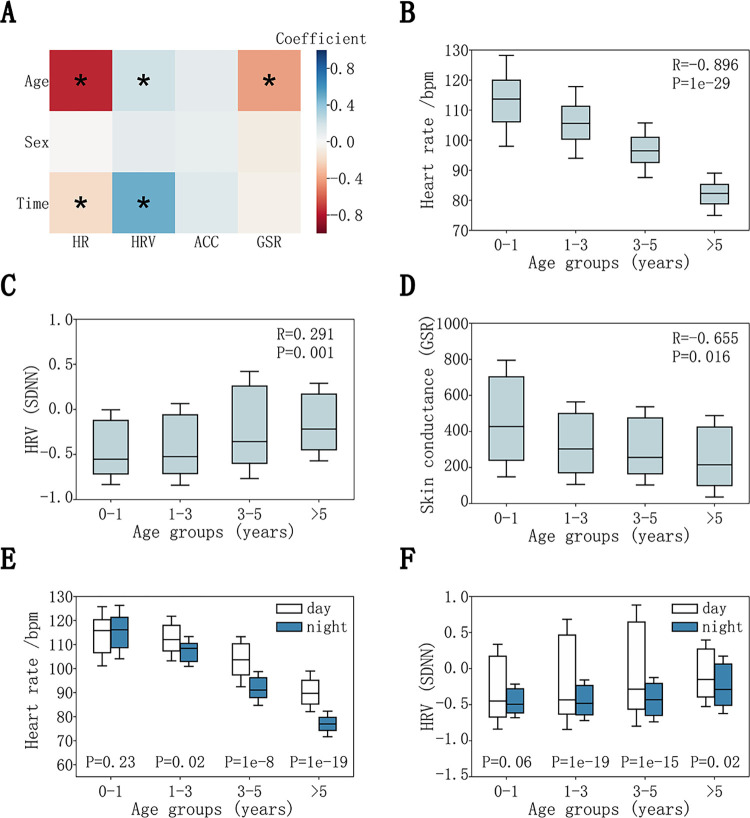
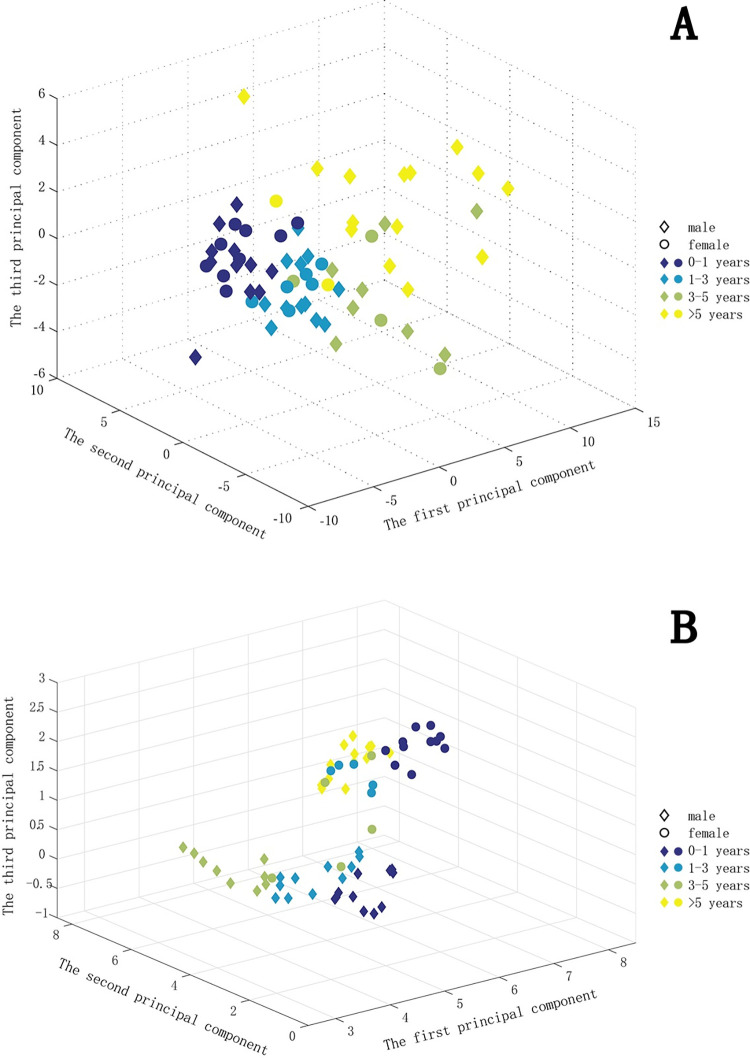
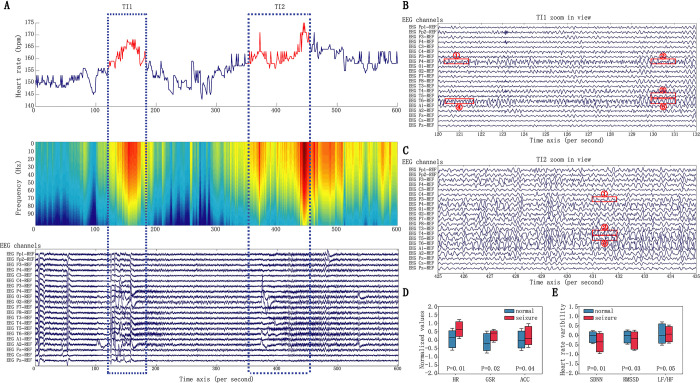
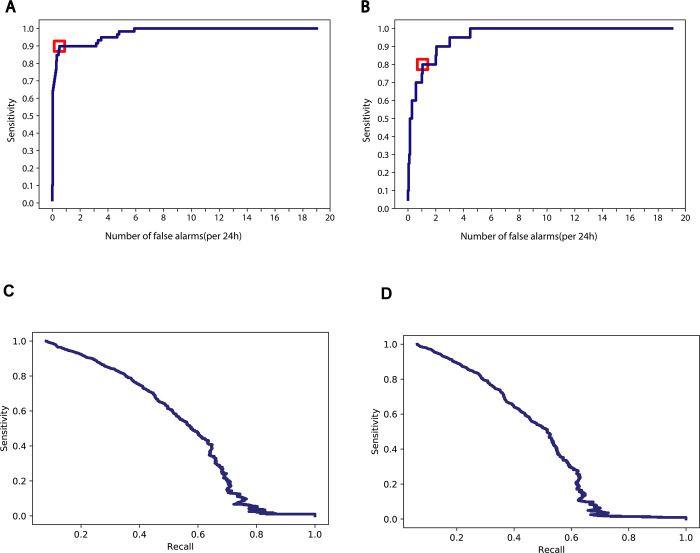
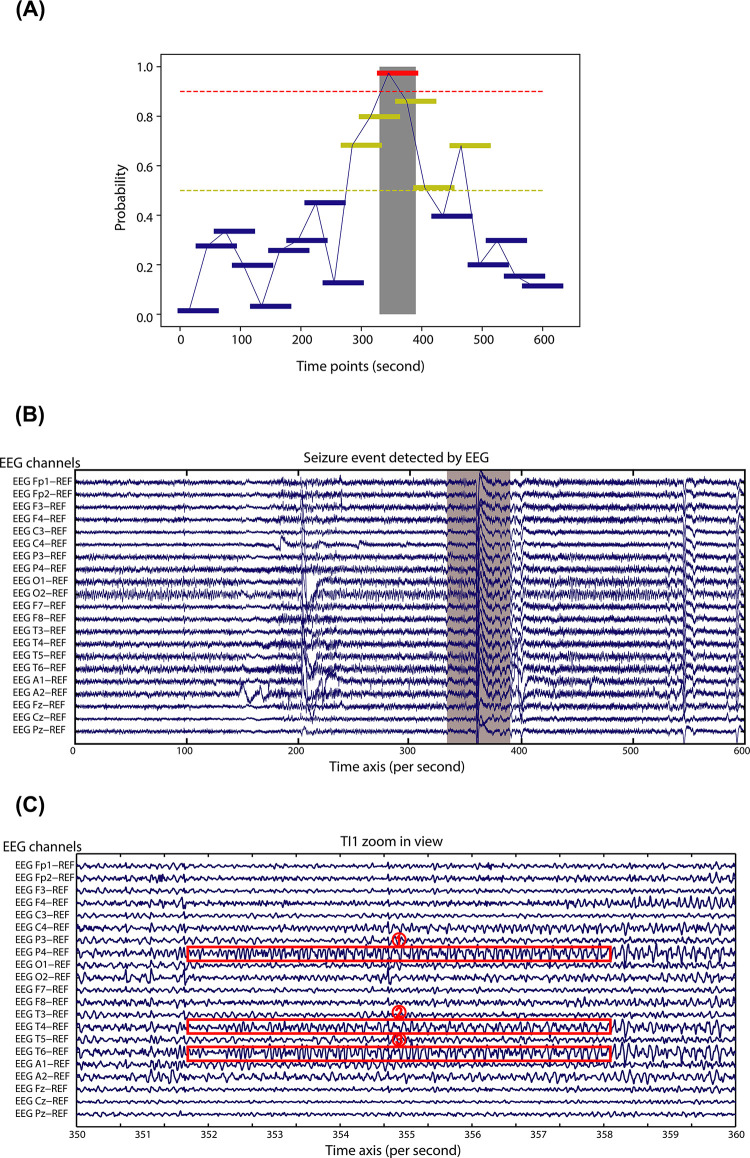
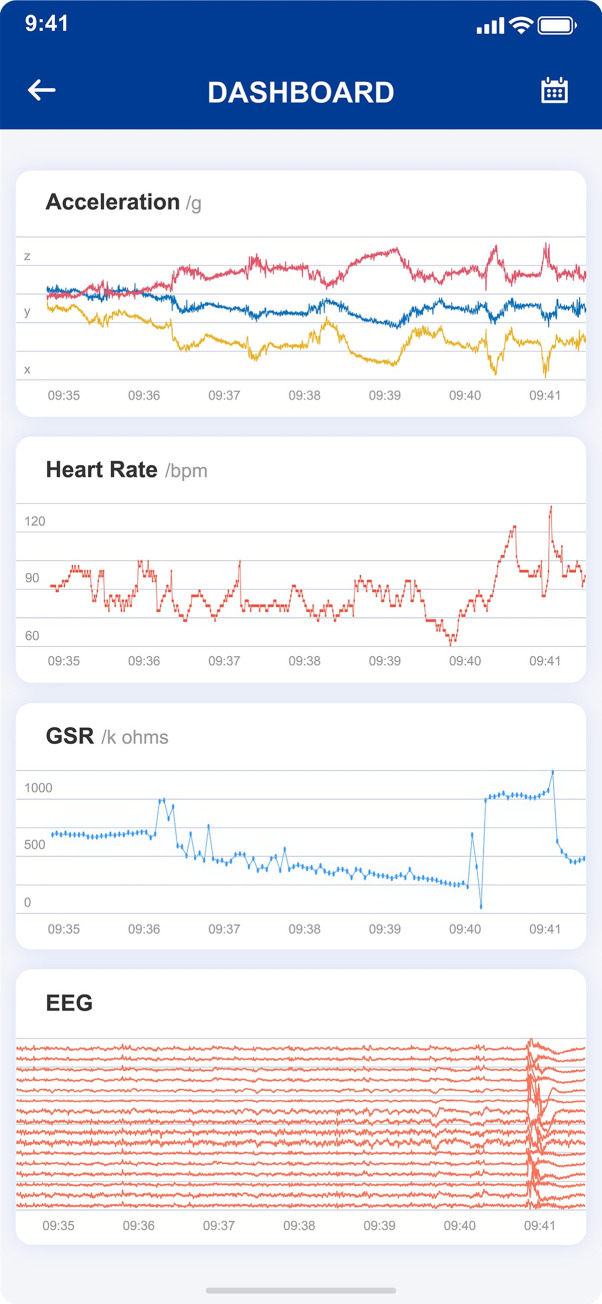
Our current understanding of human physiology and activities is largely derived from sparse and discrete individual clinical measurements. To achieve precise, proactive, and effective health management of an individual, longitudinal, and dense tracking of personal physiomes and activities is required, which is only feasible by utilizing wearable biosensors. As a pilot study, we implemented a cloud computing infrastructure to integrate wearable sensors, mobile computing, digital signal processing, and machine learning to improve early detection of seizure onsets in children. We recruited 99 children diagnosed with epilepsy and longitudinally tracked them at single-second resolution using a wearable wristband, and prospectively acquired more than one billion data points. This unique dataset offered us an opportunity to quantify physiological dynamics (e.g., heart rate, stress response) across age groups and to identify physiological irregularities upon epilepsy onset. The high-dimensional personal physiome and activity profiles displayed a clustering pattern anchored by patient age groups. These signatory patterns included strong age and sex-specific effects on varying circadian rhythms and stress responses across major childhood developmental stages. For each patient, we further compared the physiological and activity profiles associated with seizure onsets with the personal baseline and developed a machine learning framework to accurately capture these onset moments. The performance of this framework was further replicated in another independent patient cohort. We next referenced our predictions with the electroencephalogram (EEG) signals on selected patients and demonstrated that our approach could detect subtle seizures not recognized by humans and could detect seizures prior to clinical onset. Our work demonstrated the feasibility of a real-time mobile infrastructure in a clinical setting, which has the potential to be valuable in caring for epileptic patients. Extension of such a system has the potential to be leveraged as a health management device or longitudinal phenotyping tool in clinical cohort studies.
Copyright: © 2022 Jiang et al. This is an open access article distributed under the terms of the Creative Commons Attribution License, which permits unrestricted use, distribution, and reproduction in any medium, provided the original author and source are credited.
Conflict of interest statement
JZ, JL, ZZ and MPS are cofounders of SensOmics. MPS is also a cofounder and a member of the Scientific Advisory Board of Personalis, Qbio, January, Protos, Mirvie, Oralome; he is on the Scientific Advisory Board of Danaher, Genapsys, and Jupiter.
Figures
Similar articles
-
Seizure detection using wearable sensors and machine learning: Setting a benchmark.Epilepsia. 2021 Aug;62(8):1807-1819. doi: 10.1111/epi.16967. Epub 2021 Jul 15. Epilepsia. 2021. PMID: 34268728 Free PMC article.
-
Recording human electrocorticographic (ECoG) signals for neuroscientific research and real-time functional cortical mapping.J Vis Exp. 2012 Jun 26;(64):3993. doi: 10.3791/3993. J Vis Exp. 2012. PMID: 22782131 Free PMC article.
-
A channel independent generalized seizure detection method for pediatric epileptic seizures.Comput Methods Programs Biomed. 2021 Sep;209:106335. doi: 10.1016/j.cmpb.2021.106335. Epub 2021 Aug 5. Comput Methods Programs Biomed. 2021. PMID: 34390934
-
Seizure Diaries and Forecasting With Wearables: Epilepsy Monitoring Outside the Clinic.Front Neurol. 2021 Jul 13;12:690404. doi: 10.3389/fneur.2021.690404. eCollection 2021. Front Neurol. 2021. PMID: 34326807 Free PMC article. Review.
-
Seizure forecasting and cyclic control of seizures.Epilepsia. 2021 Feb;62 Suppl 1:S2-S14. doi: 10.1111/epi.16541. Epub 2020 Jul 26. Epilepsia. 2021. PMID: 32712968 Review.
References
LinkOut - more resources
Full Text Sources
Research Materials