. 2023 Feb 21;4(2):100941.
doi: 10.1016/j.xcrm.2023.100941.

An adverse tumor-protective effect of IDO1 inhibition

Affiliations

An adverse tumor-protective effect of IDO1 inhibition

Juliana C N Kenski et al. Cell Rep Med. .

Abstract

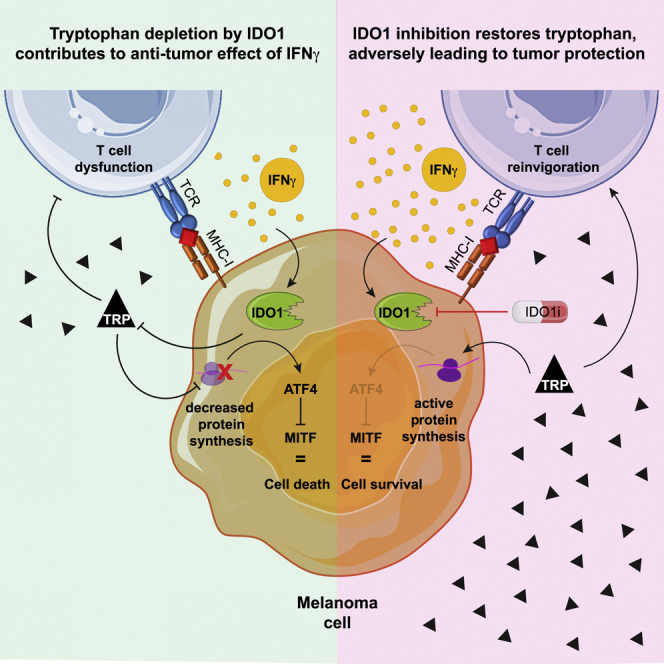
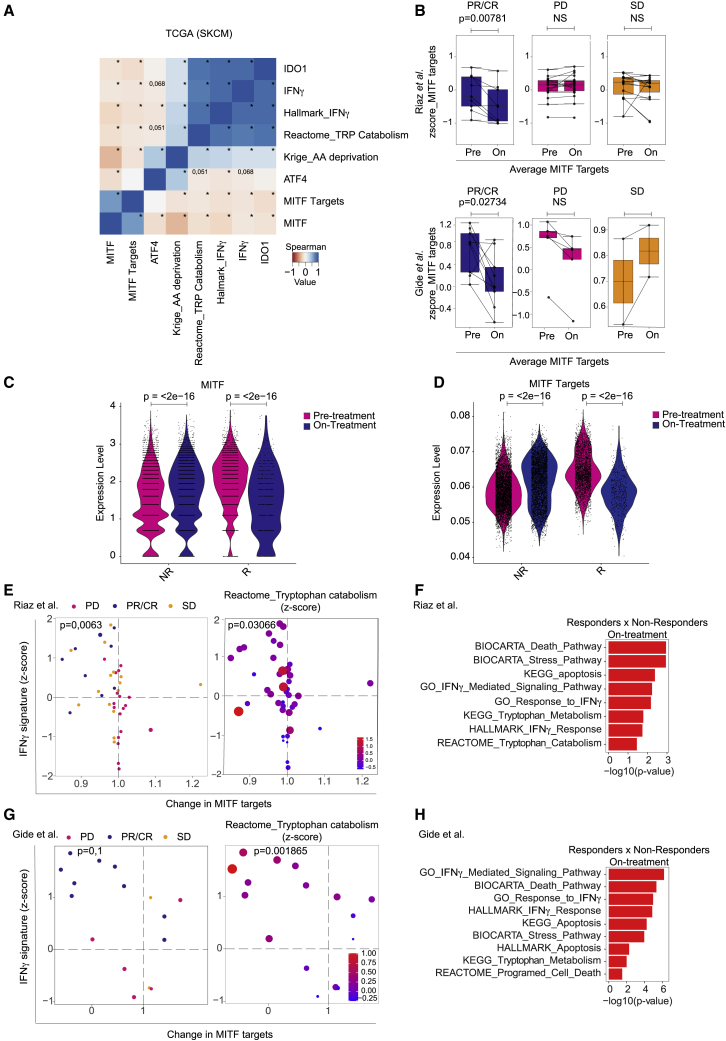
By restoring tryptophan, indoleamine 2,3-dioxygenase 1 (IDO1) inhibitors aim to reactivate anti-tumor T cells. However, a phase III trial assessing their clinical benefit failed, prompting us to revisit the role of IDO1 in tumor cells under T cell attack. We show here that IDO1 inhibition leads to an adverse protection of melanoma cells to T cell-derived interferon-gamma (IFNγ). RNA sequencing and ribosome profiling shows that IFNγ shuts down general protein translation, which is reversed by IDO1 inhibition. Impaired translation is accompanied by an amino acid deprivation-dependent stress response driving activating transcription factor-4 (ATF4)high/microphtalmia-associated transcription factor (MITF)low transcriptomic signatures, also in patient melanomas. Single-cell sequencing analysis reveals that MITF downregulation upon immune checkpoint blockade treatment predicts improved patient outcome. Conversely, MITF restoration in cultured melanoma cells causes T cell resistance. These results highlight the critical role of tryptophan and MITF in the melanoma response to T cell-derived IFNγ and uncover an unexpected negative consequence of IDO1 inhibition.

Keywords: IDO1; IDO1 inhibition; IFNgamma; MITF; T cells; clinical trial; immunotherapy; melanoma; translation.


Conflict of interest statement

Declaration of interests D.S.P. is co-founder, shareholder, and advisor of Immagene, which is unrelated to this study.

Figures

None
Graphical abstract
Figure 1
Figure 1
Tryptophan restoration by IDO1 inhibition protects tumor cells to T cell-mediated killing Melanoma cells were co-cultured with MART-1 T cells (or no T cells as a control) at 1:5 and 1:10 T cell:tumor cell ratios for 24 h. (A) After co-culture, cells were harvested and immunoblotted for IDO1 (short exposure and long exposure), all in parallel; HSP90 served as loading control. (B) The same melanoma cell line panel was exposed to MART-1 T cells at indicated T cell:tumor cell ratios or no T cells as a control and stained with crystal violet after 6 days, and the percentage of surviving melanoma cells was quantified. Color coding indicates sensitivity to T cells: blue, relatively T cell-sensitive; orange, intermediate phenotype; pink, relatively resistant. Color coding was done arbitrarily for better visualization. The grouping of cell lines was not used for further analysis, and cell lines were always analyzed individually. (C) Spearman correlation between relative (to control) tryptophan drop upon T cell exposure and percentage of surviving cells after T cell challenge, both at a 1:10 (T cell:tumor cell) ratio from the experiment shown in (B). Tryptophan (TRP) levels were measured from supernatant of melanoma and MART-1 T cell co-cultures by a fluorometric assay after 24 h of the experiment shown in (B). (D) TRP concentrations from supernatants in (E) were measured by a fluorometric assay after 72 h of treatment. Statistical significance shown for the IFNγ-only group was tested comparing the IFNγ group against its control, whereas in the epacadostat-treated groups, it was compared with the corresponding IFNγ dose. The y axis shows normalized TRP levels compared with control. (E) Cell lines were treated with IFNγ (2.5, 5, or 10 ng/mL) and/or epacadostat (2 μM), fixed and stained with crystal violet after 6 days. Quantification in Figure S1B. (F) NSG mice received A375-MelanA cells subcutaneously into the flank, and after 3 days, 5 million MART-1-specific or control (untransduced) CD8+ T cells were injected intravenously, and the mice were treated daily with epacadostat (100 mg/kg) orally. n = 6 mice for T cell control group and n = 10 mice for MART-1 T cell-treated group. Tumor sizes at endpoint are shown. (G) TRP levels measured in supernatants of experiment shown in (H) after 72 h of treatment. Statistical testing of IFNγ and MART-1 T cell-only group was performed against their own control. (H) D10, M026X1.CL, and 99.08 cells were treated with IFNγ (5 ng/mL), TRP (100 μg/mL), or MART-1 T cells (1:20 effector-to-target [E:T] ratio), fixed and stained after 6 days. Quantification in Figure S1G. (I) Cell lines were co-cultured with MART-1 T cells at a 1:20 ratio in the presence or absence of IFNγ- blocking antibody. TRP levels were measured at the 72 h time point. (J) Cells from experiment in (I) were fixed and stained with crystal violet after 6 days. (G)–(J) belong to the same experiment and were separated for representation purposes. In vitro experiments were performed in two independent biological replicates, each in three technical replicates (available in Mendeley data [https://doi.org/10.17632/hd4h8fxdm9.1]). Bars represent ±SD for in vitro and ±SEM for in vivo. Statistical testing was done in the three technical replicates by one-way ANOVA with Tukey’s post-hoc test. ∗p ≤ 0.05; ∗∗p ≤ 0.01; ∗∗∗p ≤ 0.001; ∗∗∗∗p ≤ 0.0001 and one-way ANOVA with Šidák’s post-hoc for (F). See also Figure S1.
Figure 2
Figure 2
IFNγ-induced TRP depletion triggers general translation stalling associated with an ATF4 stress response (A) A panel of patient-derived melanoma xenograft (PDX) cell lines was treated with 10 ng/mL IFNγ. Confluence was measured after 96 h by Incucyte live-cell imaging. Experiment was done with four technical replicates. Color coding was done arbitrarily for better visualization. Bars represent +/- SD. (B) The same panel of PDX cell lines shown in (A) was analyzed by RNA sequencing (two biological replicates) after 24 h of IFNγ treatment (10 ng/mL). REVIGO analysis was performed on significantly different Gene Ontology terms between IFNγ-treated and control samples. (C) Heatmap shows Spearman correlation values between significantly different gene sets (IFNγ versus control) and survival (from A). Gene sets shown are the following (from left to right after survival): (1) GO_Negative_regulation_of_translation; (2) GO_Translational_initiation; (3) KEGG_Tryptophan_metabolism; (4) REACTOME_Tryptophan_catabolism, belonging to protein synthesis cluster; (5) HALLMARK_Apoptosis; (6) KEGG_Apoptosis; (7) BIOCARTA_Death_pathway, part of cell death cluster; (8) GO_Interferon_gamma_mediated_signaling; (9) HALLMARK_ Interferon_gamma_response; and (10) GO_Response_to_interferon_gamma, part of response to cytokine cluster. (D) Gene set enrichment analysis was performed on the differentially expressed genes between control and IFNγ treatment in the IFNγ-sensitive (top 25% quartile) and IFNγ-resistant (top 25% quartile) cell lines from (A). All pathways shown have p <0.05. (E) Fluorometric TRP measurement in D10 and 888Mel cells used for ribosome profiling. (F and G) Analysis of ribosome profiling performed after 20 h of IFNγ treatment (5 ng/mL) alone or in combination with epacadostat (2 μM). Control cells were left untreated. (F) Ribosome accumulation at specific codons (dashed boxes). Ribosome accumulation at the start methionine codon in D10 cells after IFNγ treatment is a statistically significantly outlier when compared with ribosome occupancy of other codons. (G) Panels representing differential ribosome occupancy determined by Diricore analysis at the codons in proximity to the start site (initiator ATG; left panels) or other ATG codons (right panels) in control cells versus IFNγ-treated cells (red line) and IFNγ-treated cells versus cells treated with IFNγ in combination with epacadostat (blue line). (H) Gene set enrichment analysis was performed in IFNγ-treated PDX cell lines comparing the IFNγ-sensitive (top 25% quartile) and IFNγ-resistant (top 25% quartile) cell lines.
Figure 3
Figure 3
MITF contributes to melanoma T cell sensitivity (A) Melanoma cell lines were co-cultured with T cells in 1:10 and 1:5 ratios for 24 h. Protein lysates were immunoblotted for MITF and phospho-STAT1 (Tyr701). Vinculin served as a loading control. Figure 1A and (A) belong to the same biological experiment, and western blotting was performed in parallel. (B) Correlation between percentage of surviving cells after T cell challenge at a 1:10 (T cell:tumor cell) ratio and normalized (to loading control) change in MITF expression at the same ratio from immunoblot quantification data. Spearman correlation is plotted. (C) Spearman correlation between relative survival upon IFNγ treatment in the PDX cell line panel from Figure 2A, plotted against MITF targets downregulation from RNA profiles after 24 h of IFNγ treatment. For (B) and (C), color coding as in Figure 1B. (D) Indicated cell lines were treated with IFNγ (2.5, 5, 10, and 20 ng/mL) or with epacadostat (2 μM) + 5 or 20 ng/mL IFNγ for 72 h and harvested for immunoblotting with the indicated antibodies, all in parallel. Vinculin served as a loading control. (E and F) D10 cells carrying either single guide control (sgControl) or a sgRNA targeting IFNγR1 were co-cultured with T cells at 1:20/1:10/1:5 E:T ratios. Cells were harvested after 24 h for immunoblotting (E) or fixed and stained with crystal violet after 6 days, for which quantification is shown (F). (G–J) D10 and M026.X1.CL cell lines were infected with lentivirus encoding GFP (as control) or MITF and were subsequently treated with IFNγ at 1, 5, or 10 ng/mL. Cells were either harvested after 72 h for immunoblotting (G and I) or fixed and stained with crystal violet after 6 days, for which quantification is shown (H and J). Experiments were performed in at least two independent biological replicates, each in three technical replicates (available in Mendeley data [https://doi.org/10.17632/hd4h8fxdm9.1]). Statistical testing comparing either IFNγ treatment or T cell treatment against controls was done with one-way ANOVA and Dunnet’s post-hoc. Comparisons between sgControl versus sgIFNγR1 or GFP versus MITF were done by unpaired Student’s t test (two-tailed). Bars represent +/-SD. ∗p ≤ 0.05; ∗∗p ≤ 0.01; ∗∗∗p ≤ 0.001; ∗∗∗∗p ≤ 0.0001. See also Figure S2.
Figure 4
Figure 4
On-treatment MITF downregulation predicts clinical outcome of immune checkpoint blockade (A) Heatmap showing Spearman correlations between IDO1, MITF, and IFNγ gene expression, average MITF targets, mean of amino acid deprivation signature, and average of Hallmark IFNγ and Reactome TRP catabolism signatures from SKCM melanoma cohort from TCGA. ∗p ≤ 0.05. (B) Average change in gene expression of MITF target genes comparing pre-treatment and on-treatment samples for partial responders (PRs), complete responders (CRs), stable disease (SD), and progressive disease (PD) patients for anti-PD-1 treatment, for two clinical cohorts., Box plots represent the median and 1.5 interquartile range (IQR) of the upper quartile/lower quartile. Bars represent +/- SD. (C and D) Single-cell RNA sequencing data from pre- and on-immune checkpoint blockade-treated patients were analyzed for MITF and MITF targets changes. Each dot represents a cell. p values calculated by Wilcoxon signed-rank test. (E and G) The average expression level of the IFNγ signature on treatment was plotted against the change in MITF target gene expression (ratio between normalized counts on versus pre-treatment). Left panels show clinical response data (color code at the top). Statistical analysis was performed by χ-squared test comparing top left quadrants with the remainder quadrants. Right panels show expression of the gene set (Reactome) TRP catabolism. Size and color of the circles indicate effect size of pathway enrichment. Enrichment values in the top quadrants (MITF target gene downregulation/IFNγ signature high) were significantly different from the other three quadrants (Mann-Whitney U ranked, p value indicated). (F and H) Gene set enrichment analysis (GSEA) performed on on-treatment samples comparing responders (PRs/CRs) and non-responders (PD/SD). All pathways shown have p <0.05. (B, top panel, E, and F) Riaz clinical cohort. (B, bottom panel, G, and H) Gide clinical cohort. See also Figure S3.

References

    1. Sharma P., Hu-Lieskovan S., Wargo J.A., Ribas A. Primary, adaptive, and acquired resistance to cancer immunotherapy. Cell. 2017;168:707–723. doi: 10.1016/j.cell.2017.01.017. - DOI - PMC - PubMed
    1. Yoshida R., Imanishi J., Oku T., Kishida T., Hayaishi O. Induction of pulmonary indoleamine 2,3-dioxygenase by interferon. Proc. Natl. Acad. Sci. USA. 1981;78:129–132. doi: 10.1073/pnas.78.1.129. - DOI - PMC - PubMed
    1. Kotake Y., Masayama I. Studien über den intermediären Stoffwechsel des Tryptophans XVIII—XXIV. Hoppe-Seyler's. Zeitschrift für. physiologische Chemie. 1936;243:237–265. doi: 10.1515/bchm2.1936.243.6.237. - DOI
    1. Uyttenhove C., Pilotte L., Théate I., Stroobant V., Colau D., Parmentier N., Boon T., van den Eynde B.J. Evidence for a tumoral immune resistance mechanism based on tryptophan degradation by indoleamine 2,3-dioxygenase. Nat. Med. 2003;9:1269–1274. doi: 10.1038/nm934. - DOI - PubMed
    1. Meireson A., Devos M., Brochez L. Ido expression in cancer: different compartment, different functionality? Front. Immunol. 2020;11:531491. doi: 10.3389/fimmu.2020.531491. - DOI - PMC - PubMed

Publication types