. 2023 Mar 2;186(5):957-974.e28.
doi: 10.1016/j.cell.2023.01.011. Epub 2023 Feb 21.

Bat pluripotent stem cells reveal unusual entanglement between host and viruses

Affiliations

Bat pluripotent stem cells reveal unusual entanglement between host and viruses

Marion Déjosez et al. Cell. .

Abstract

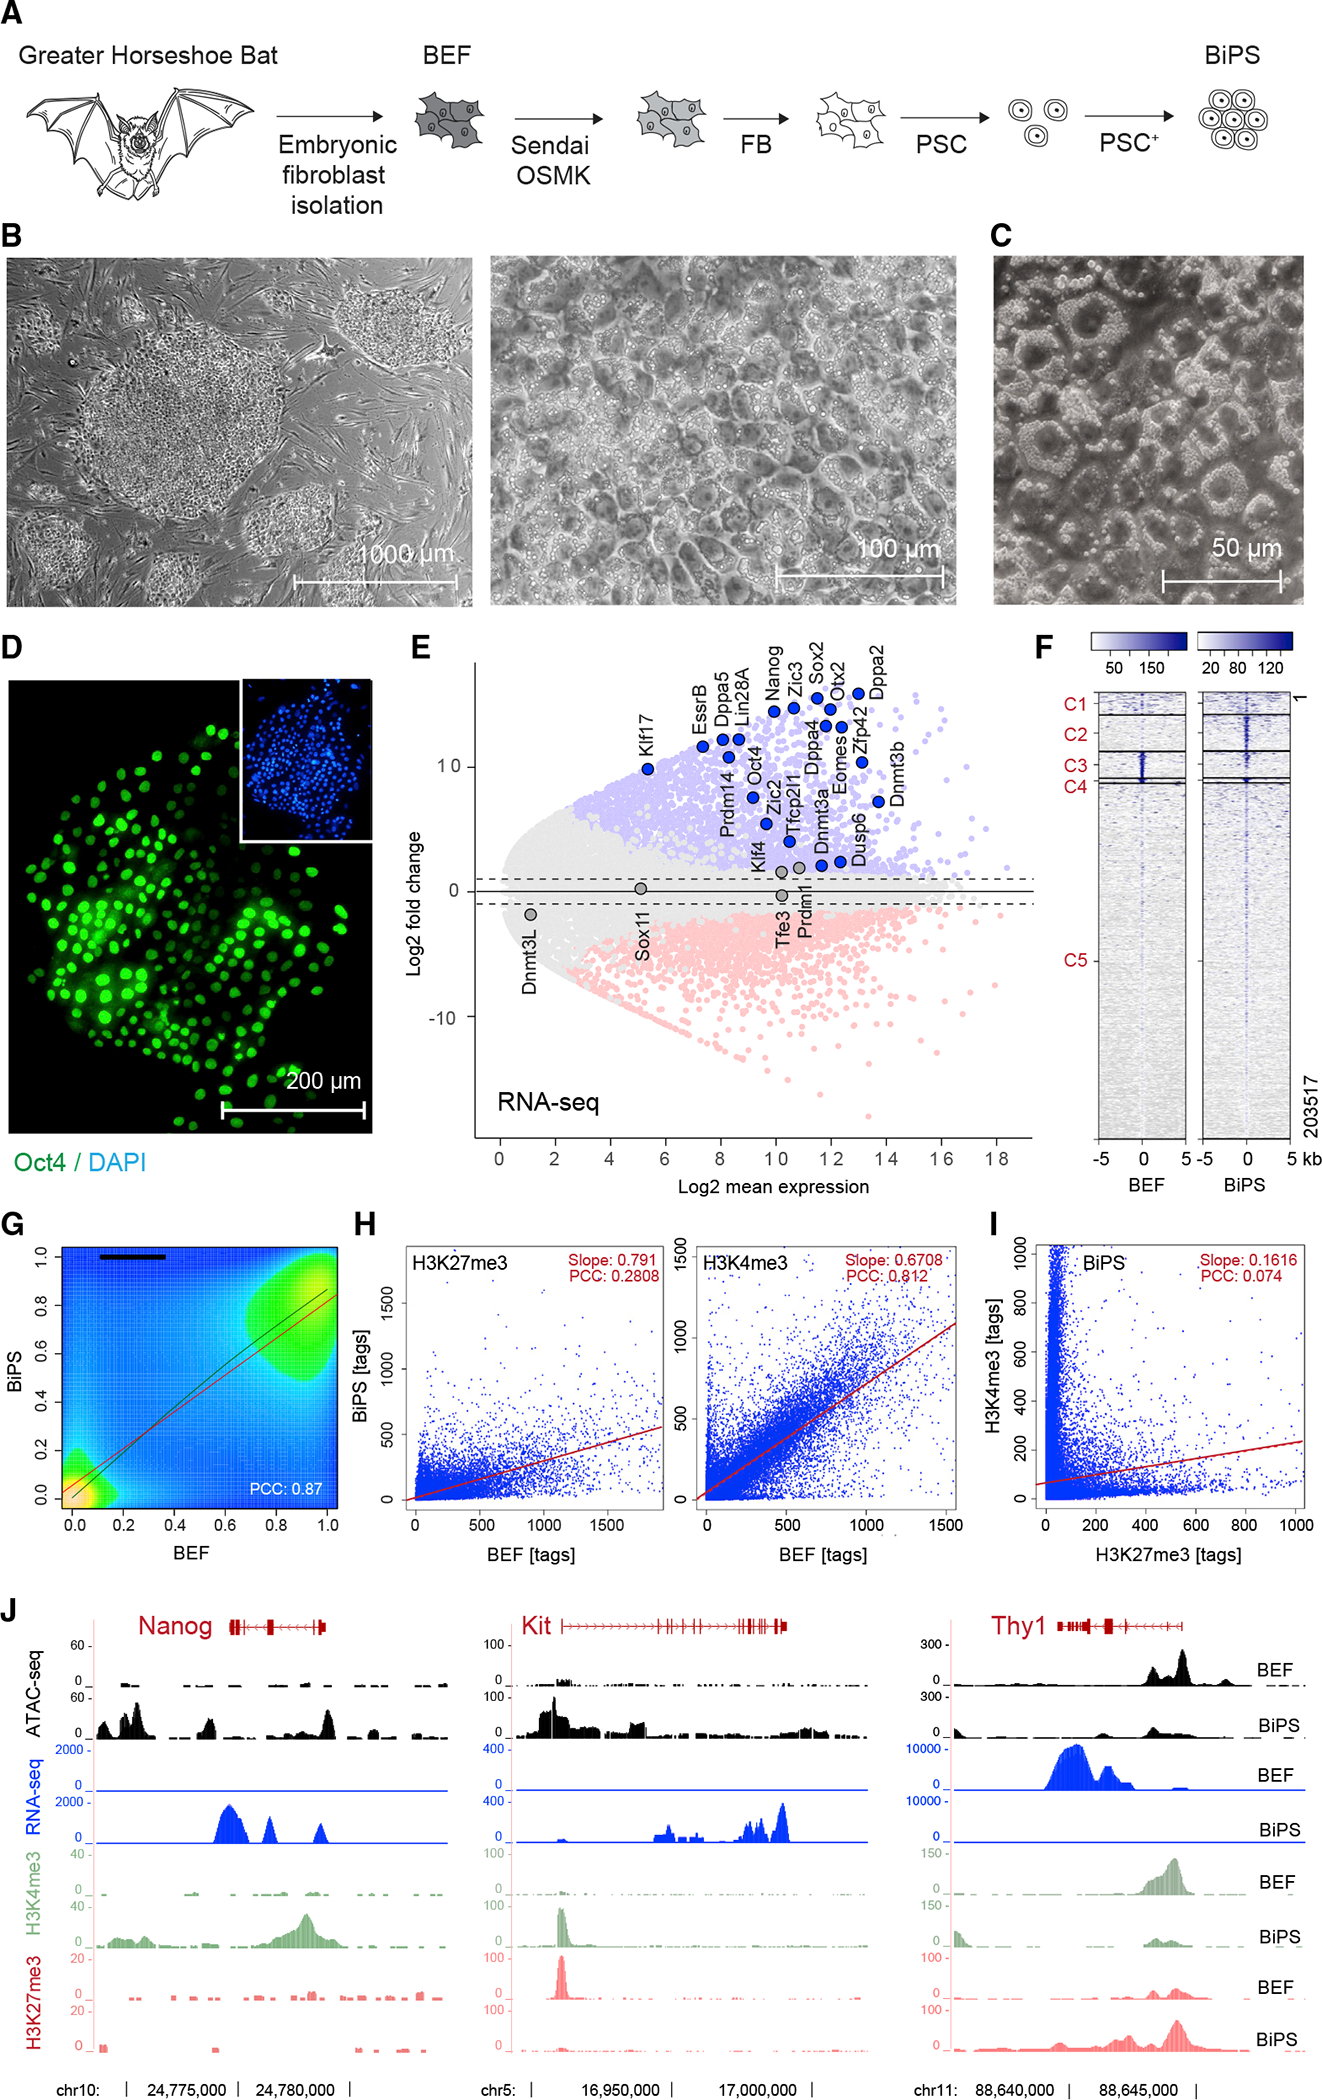
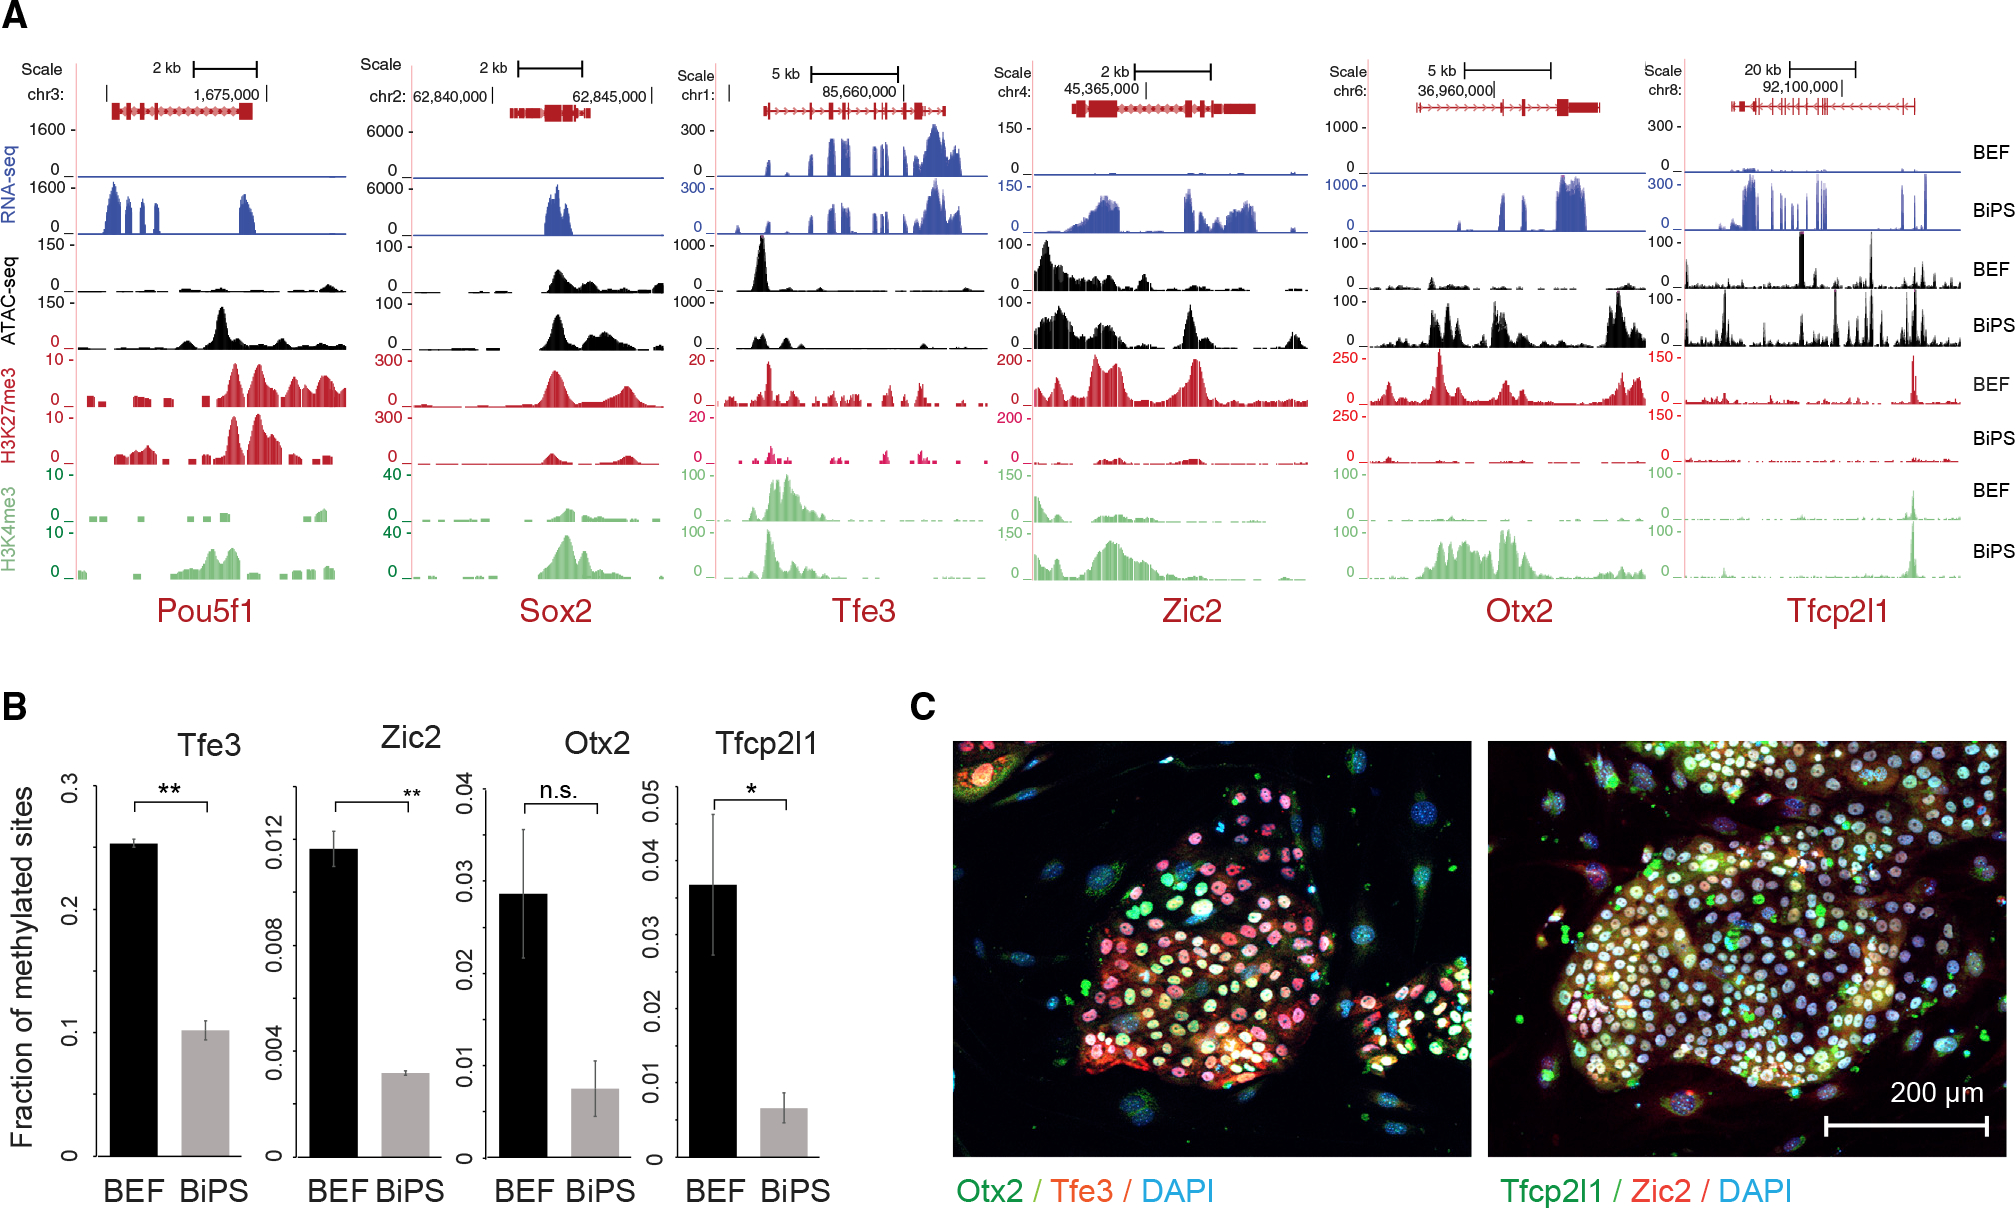
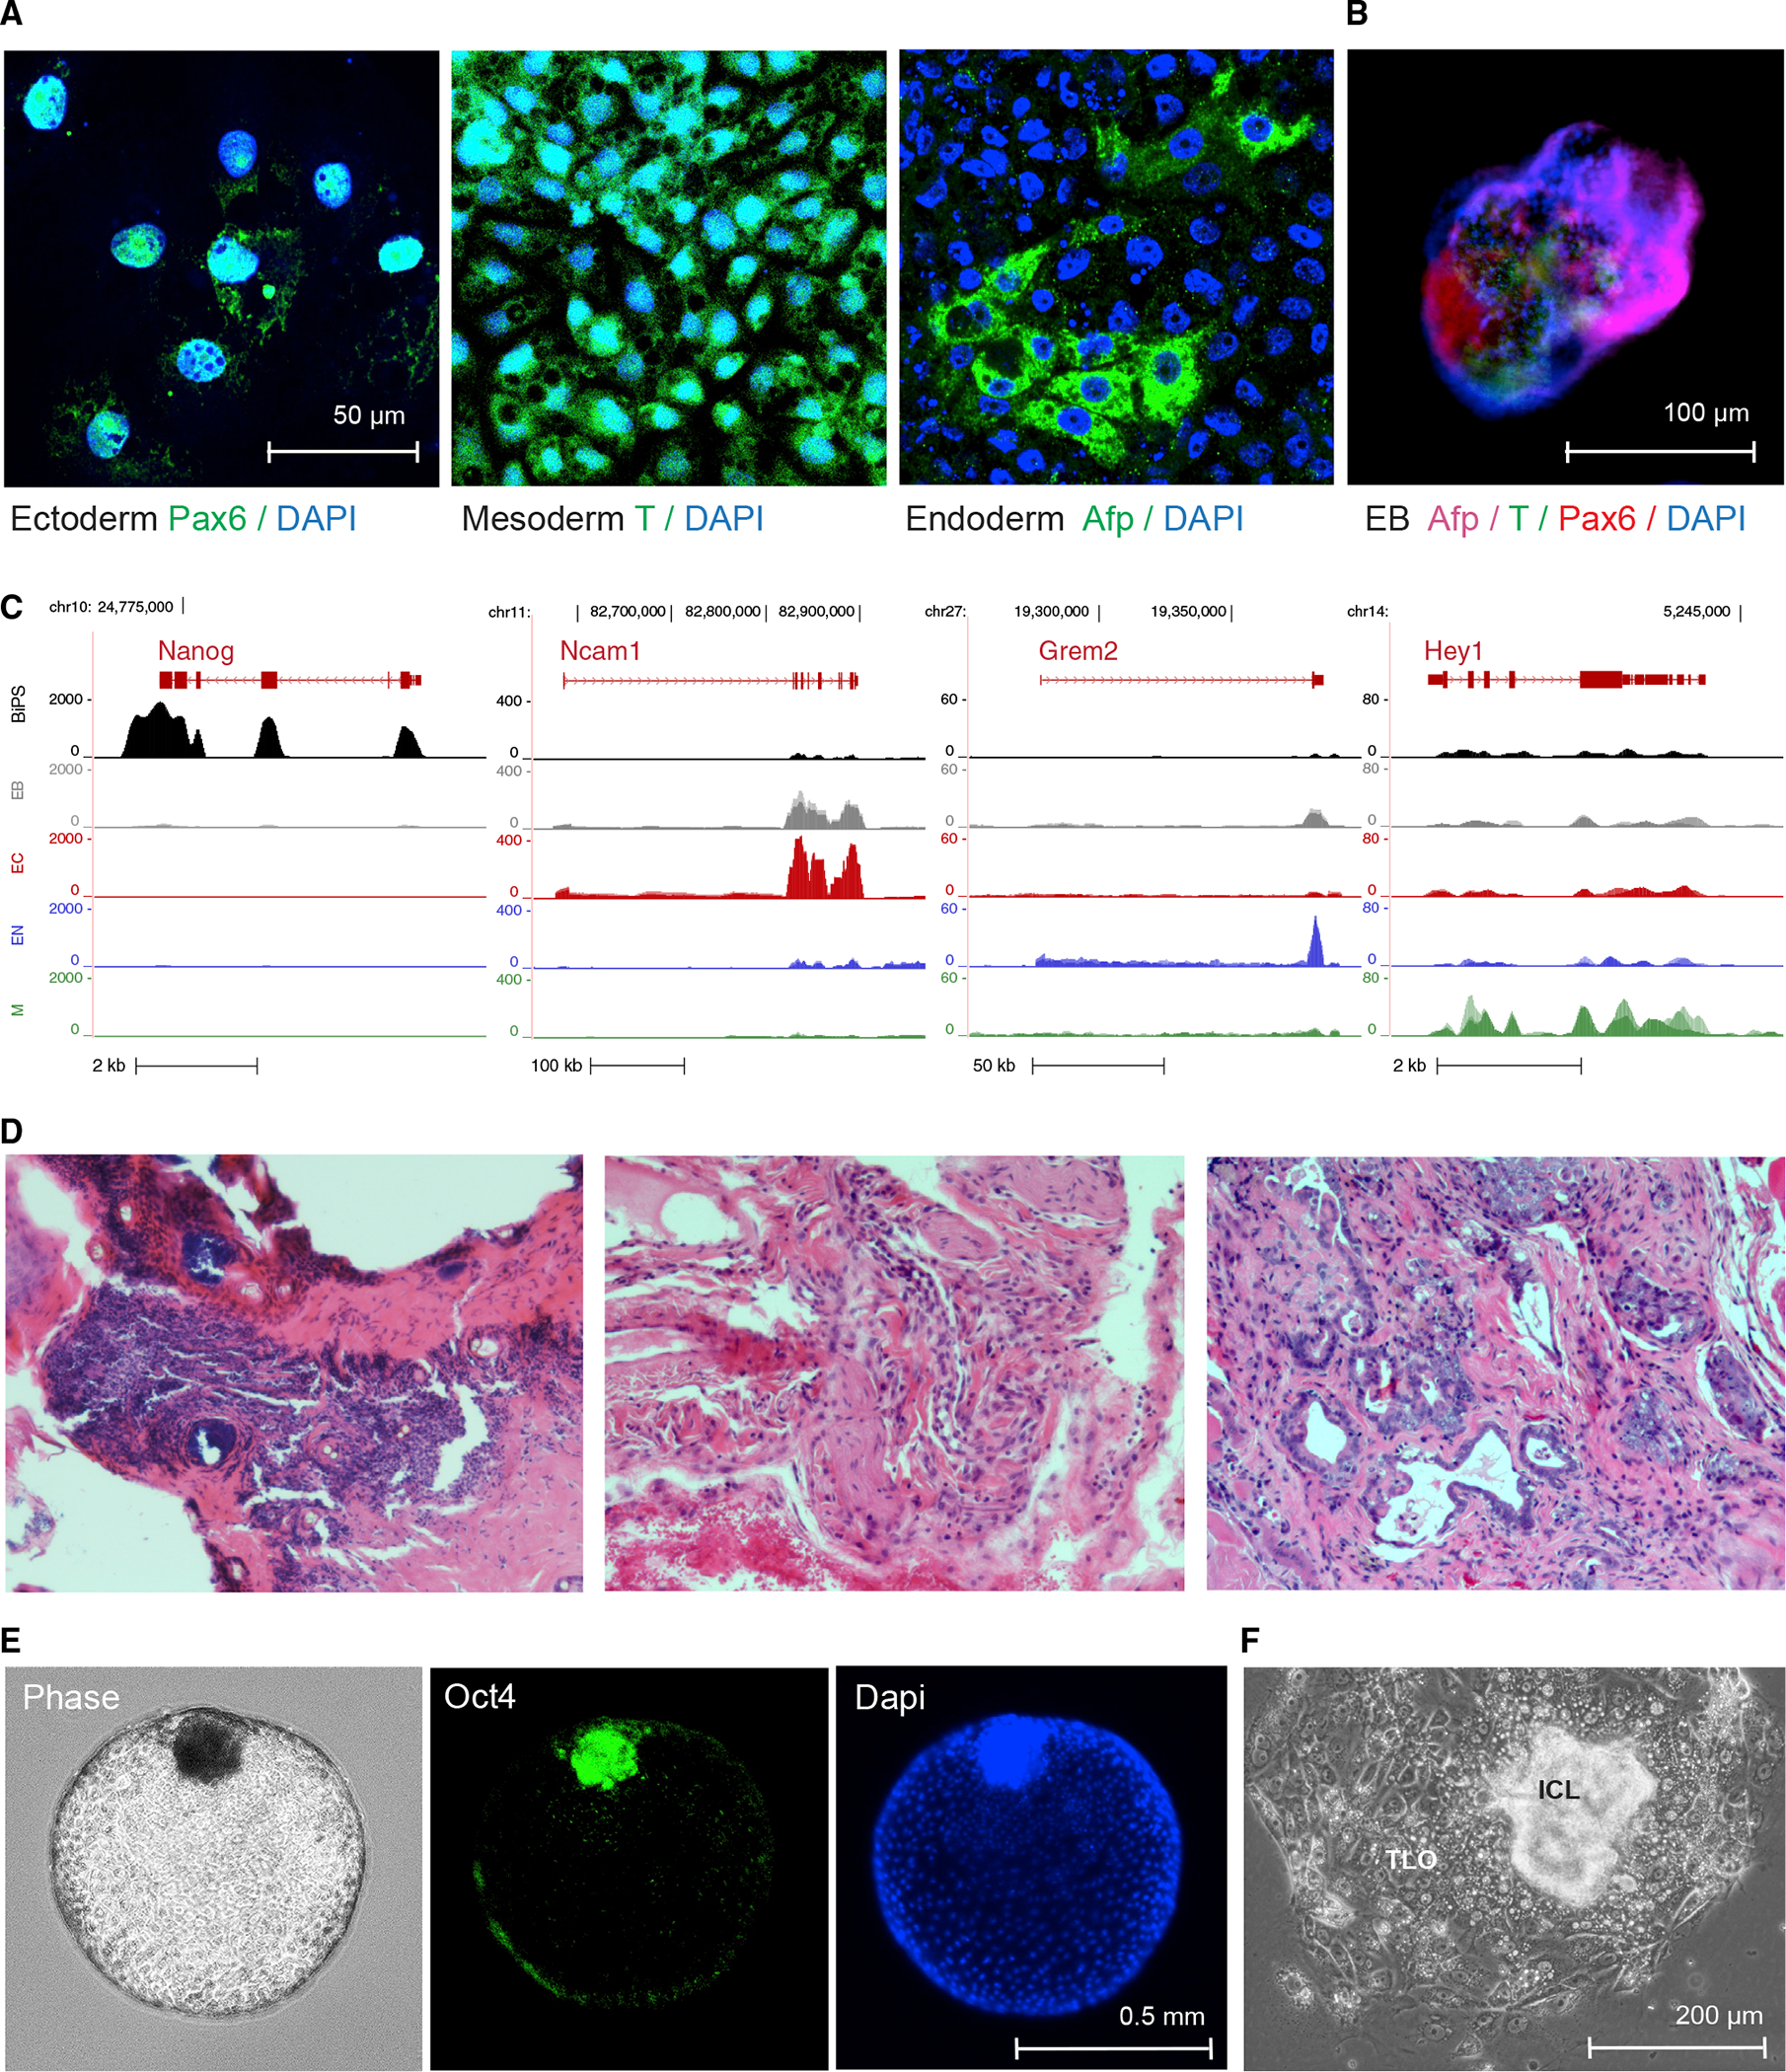
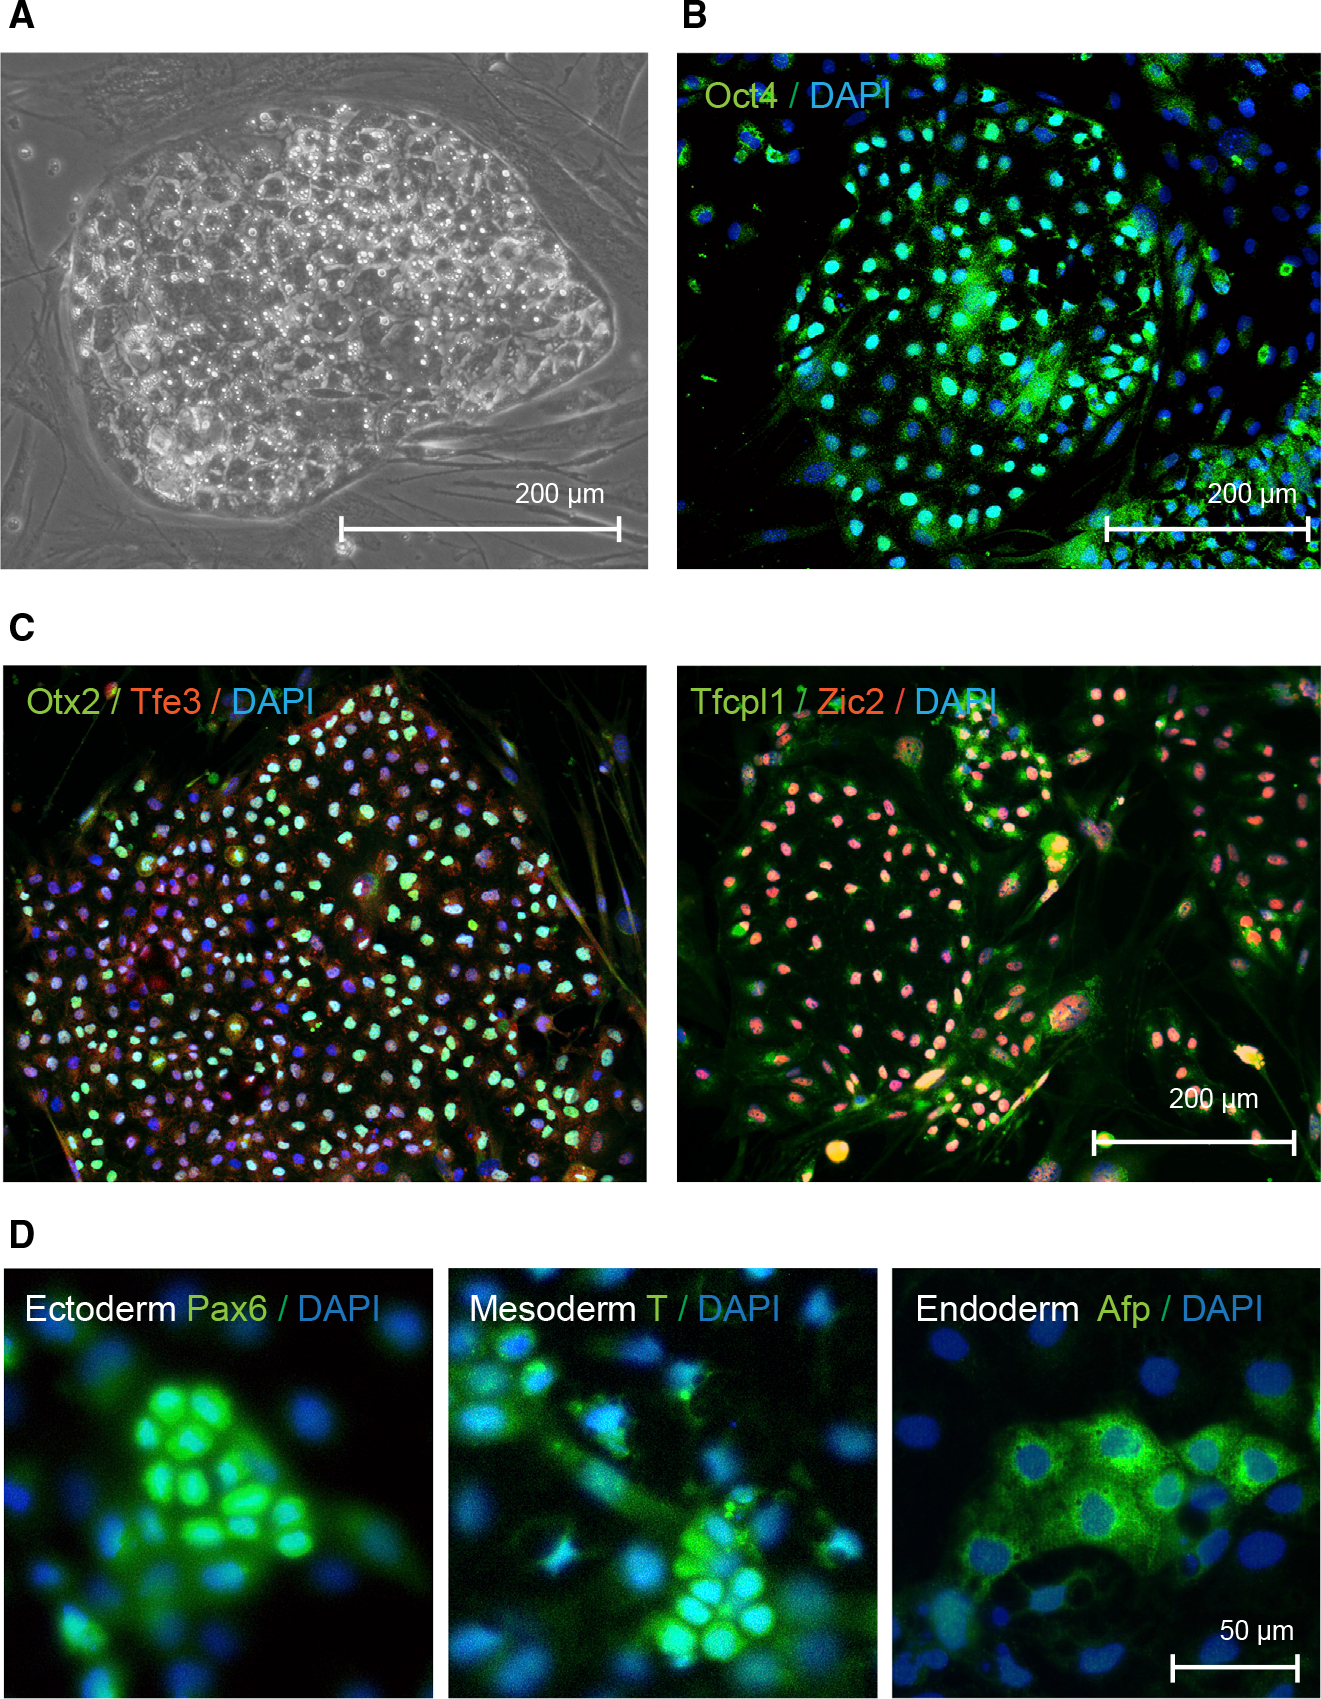
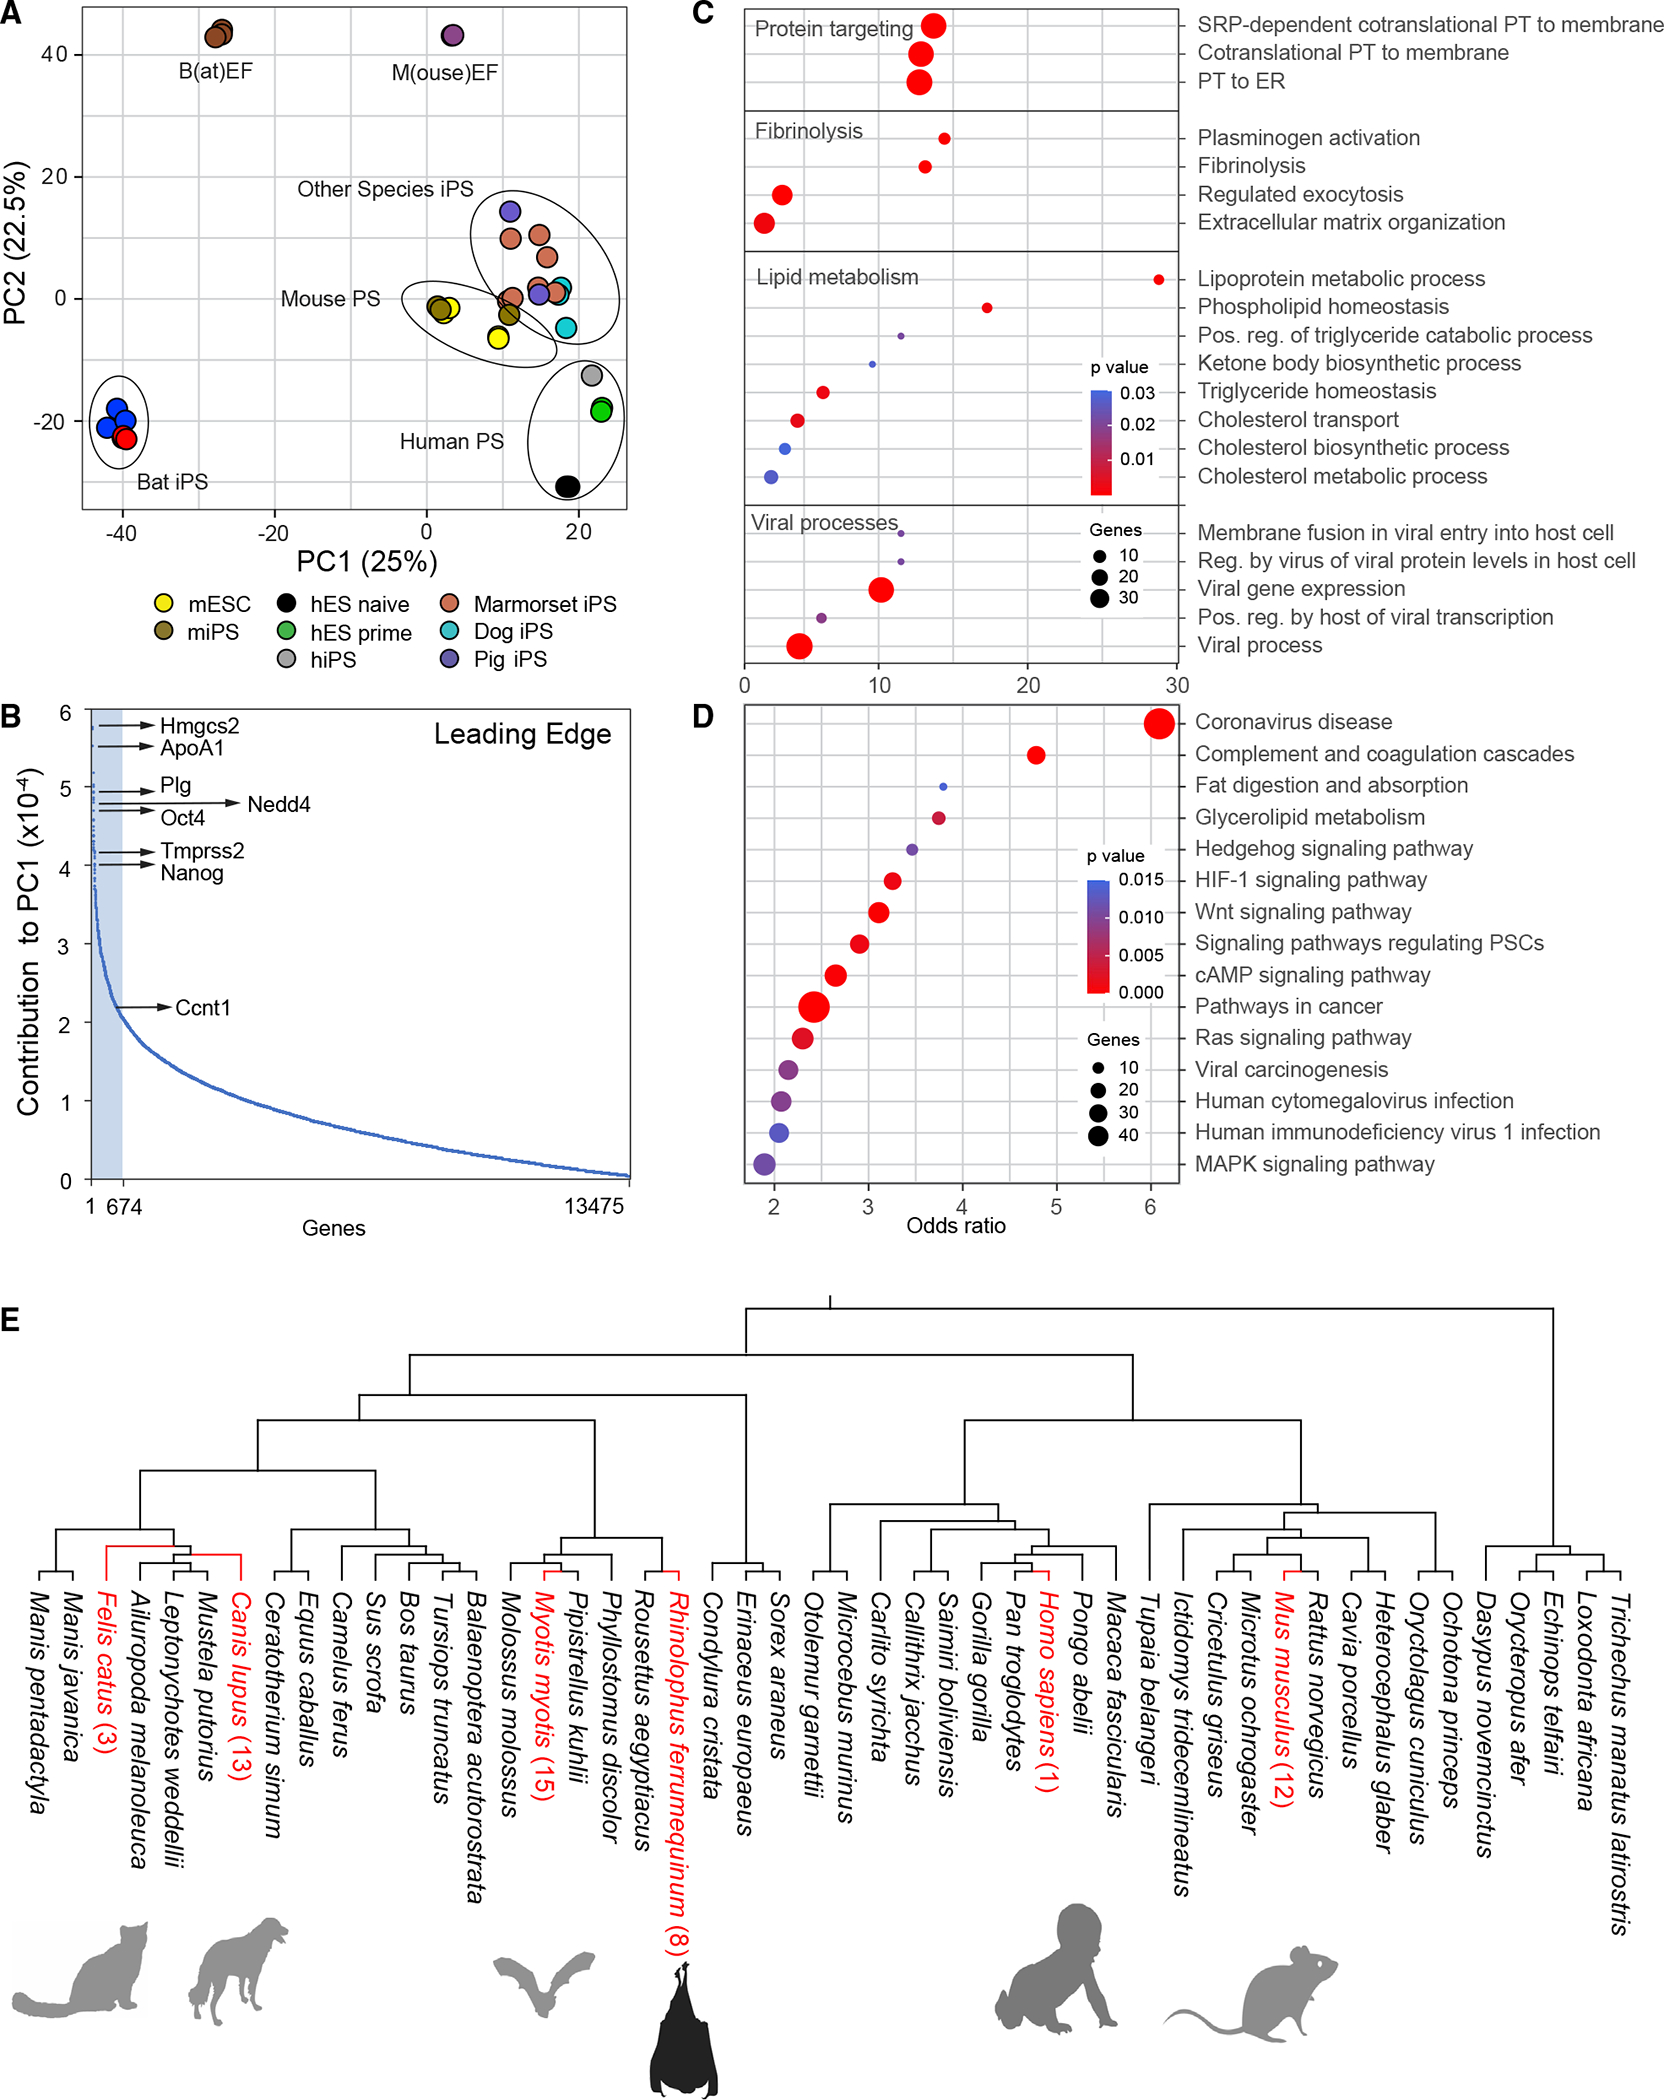
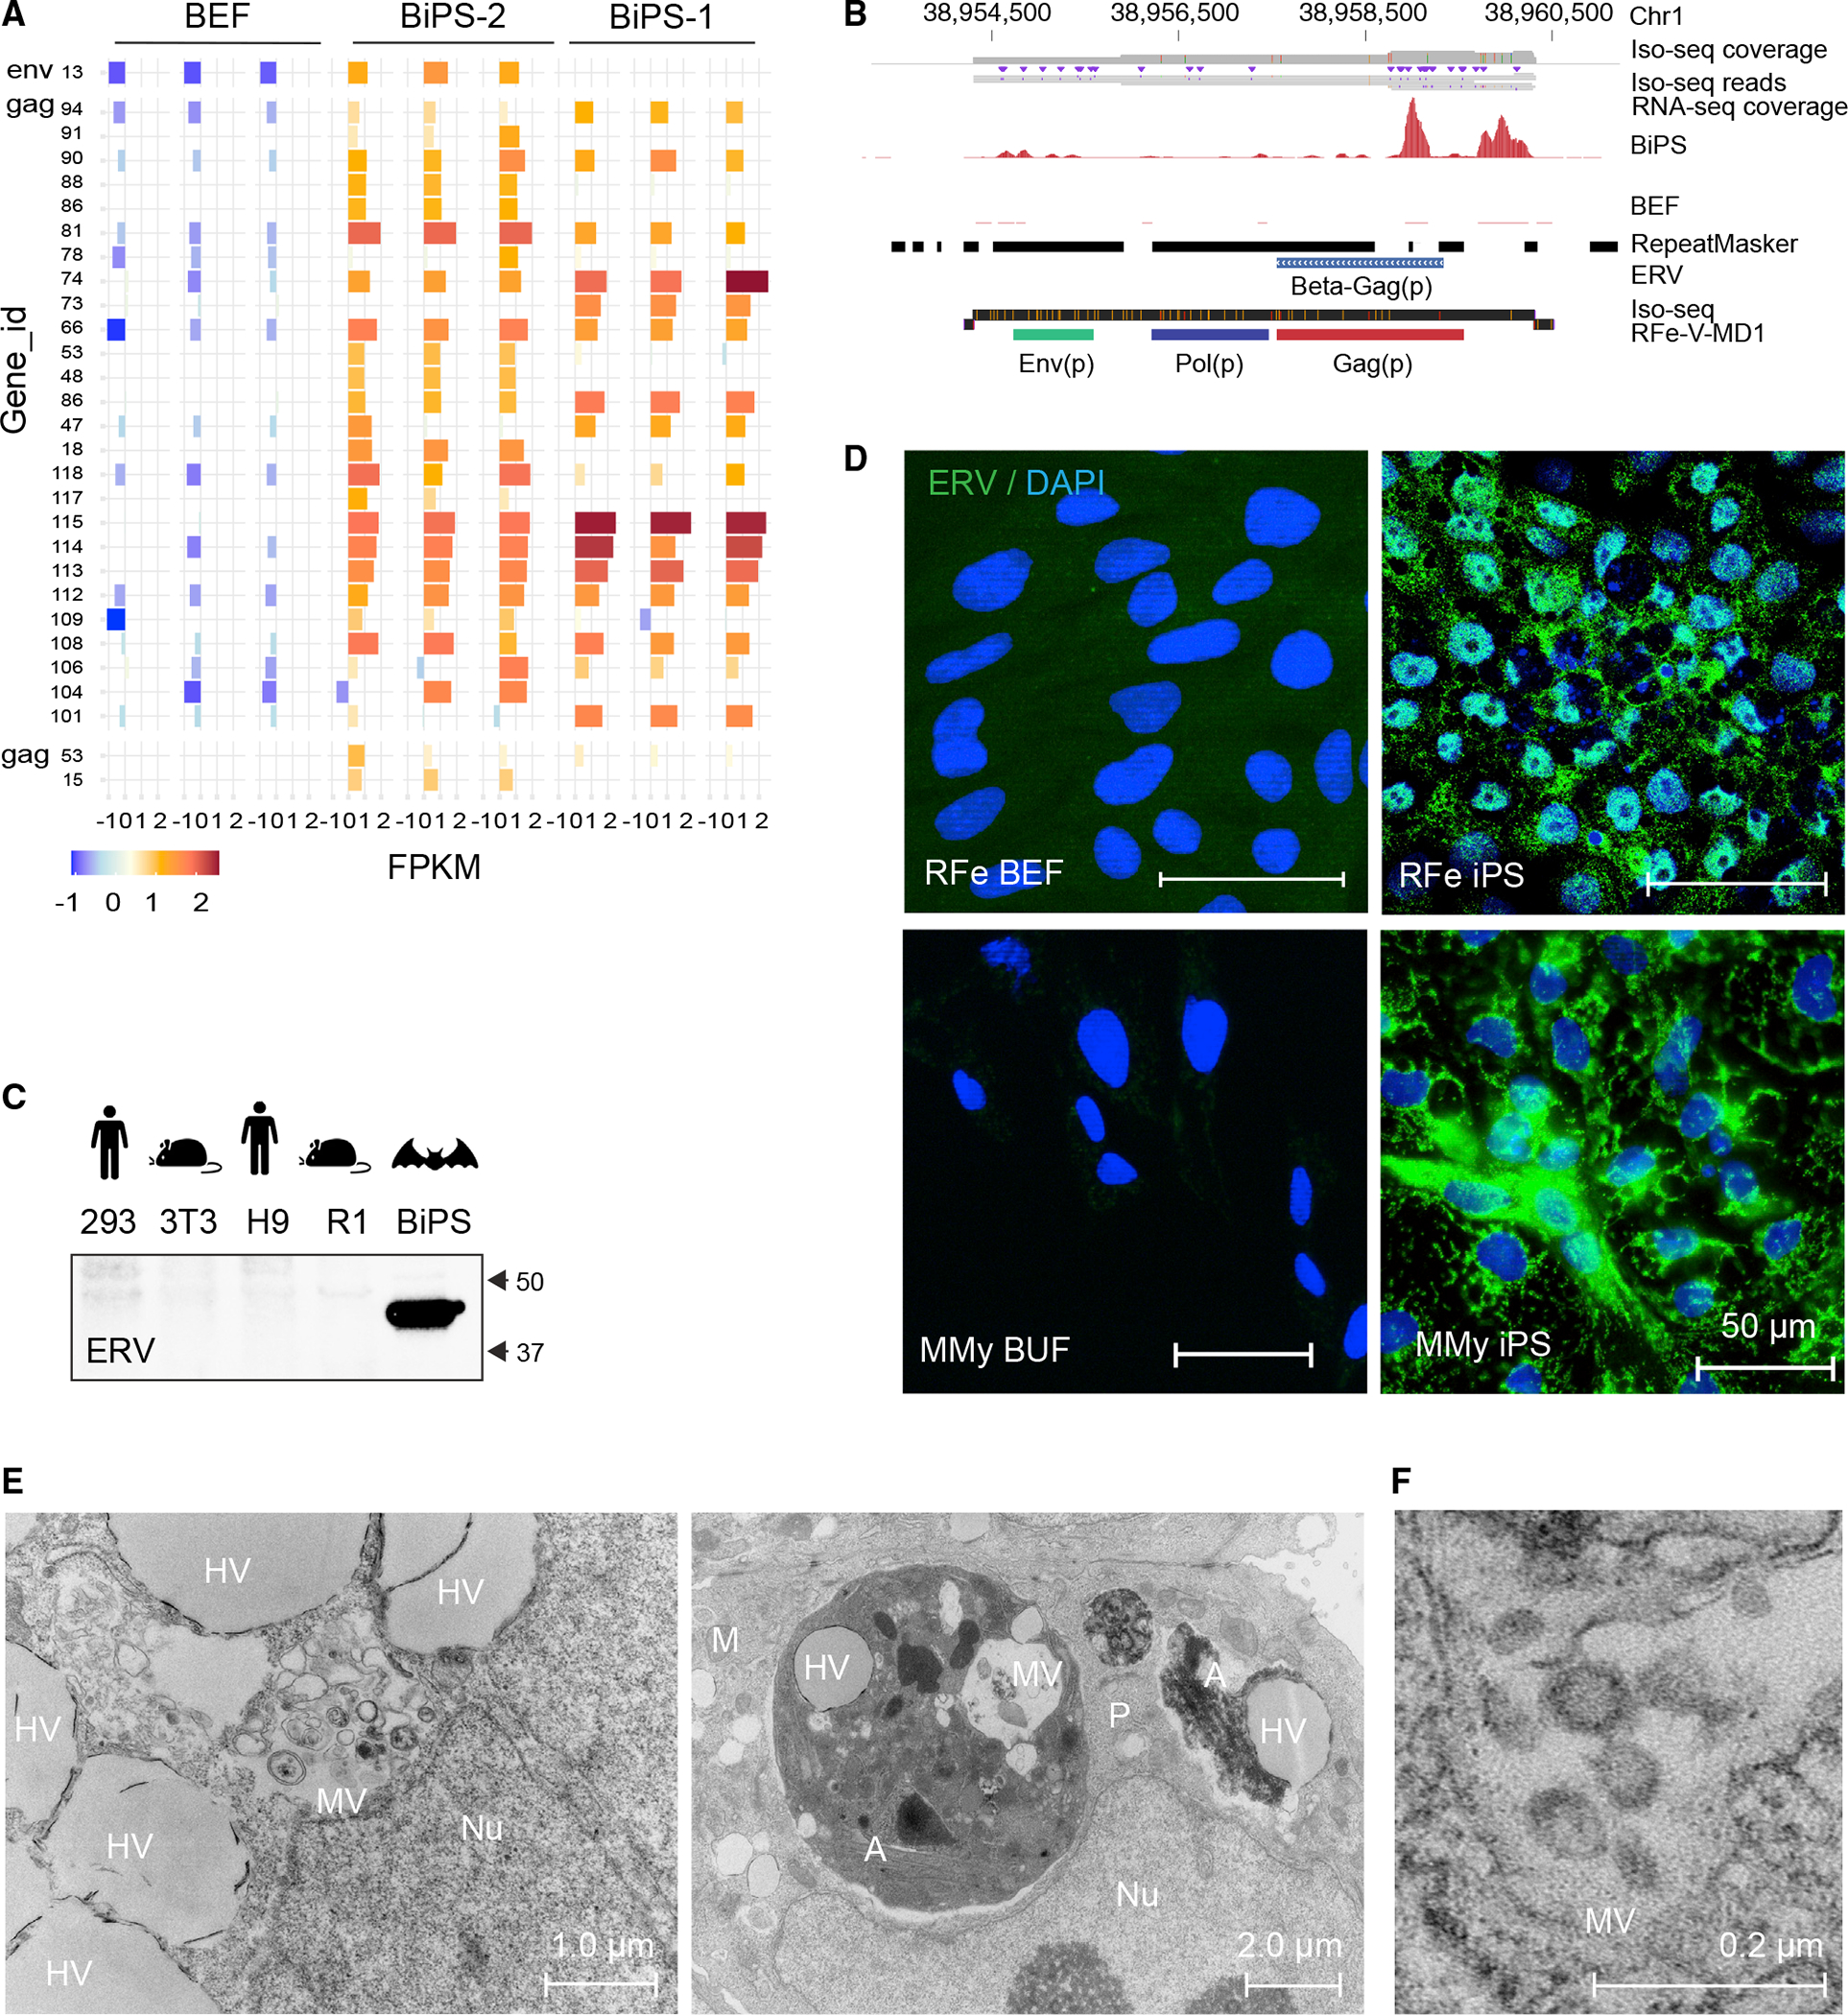
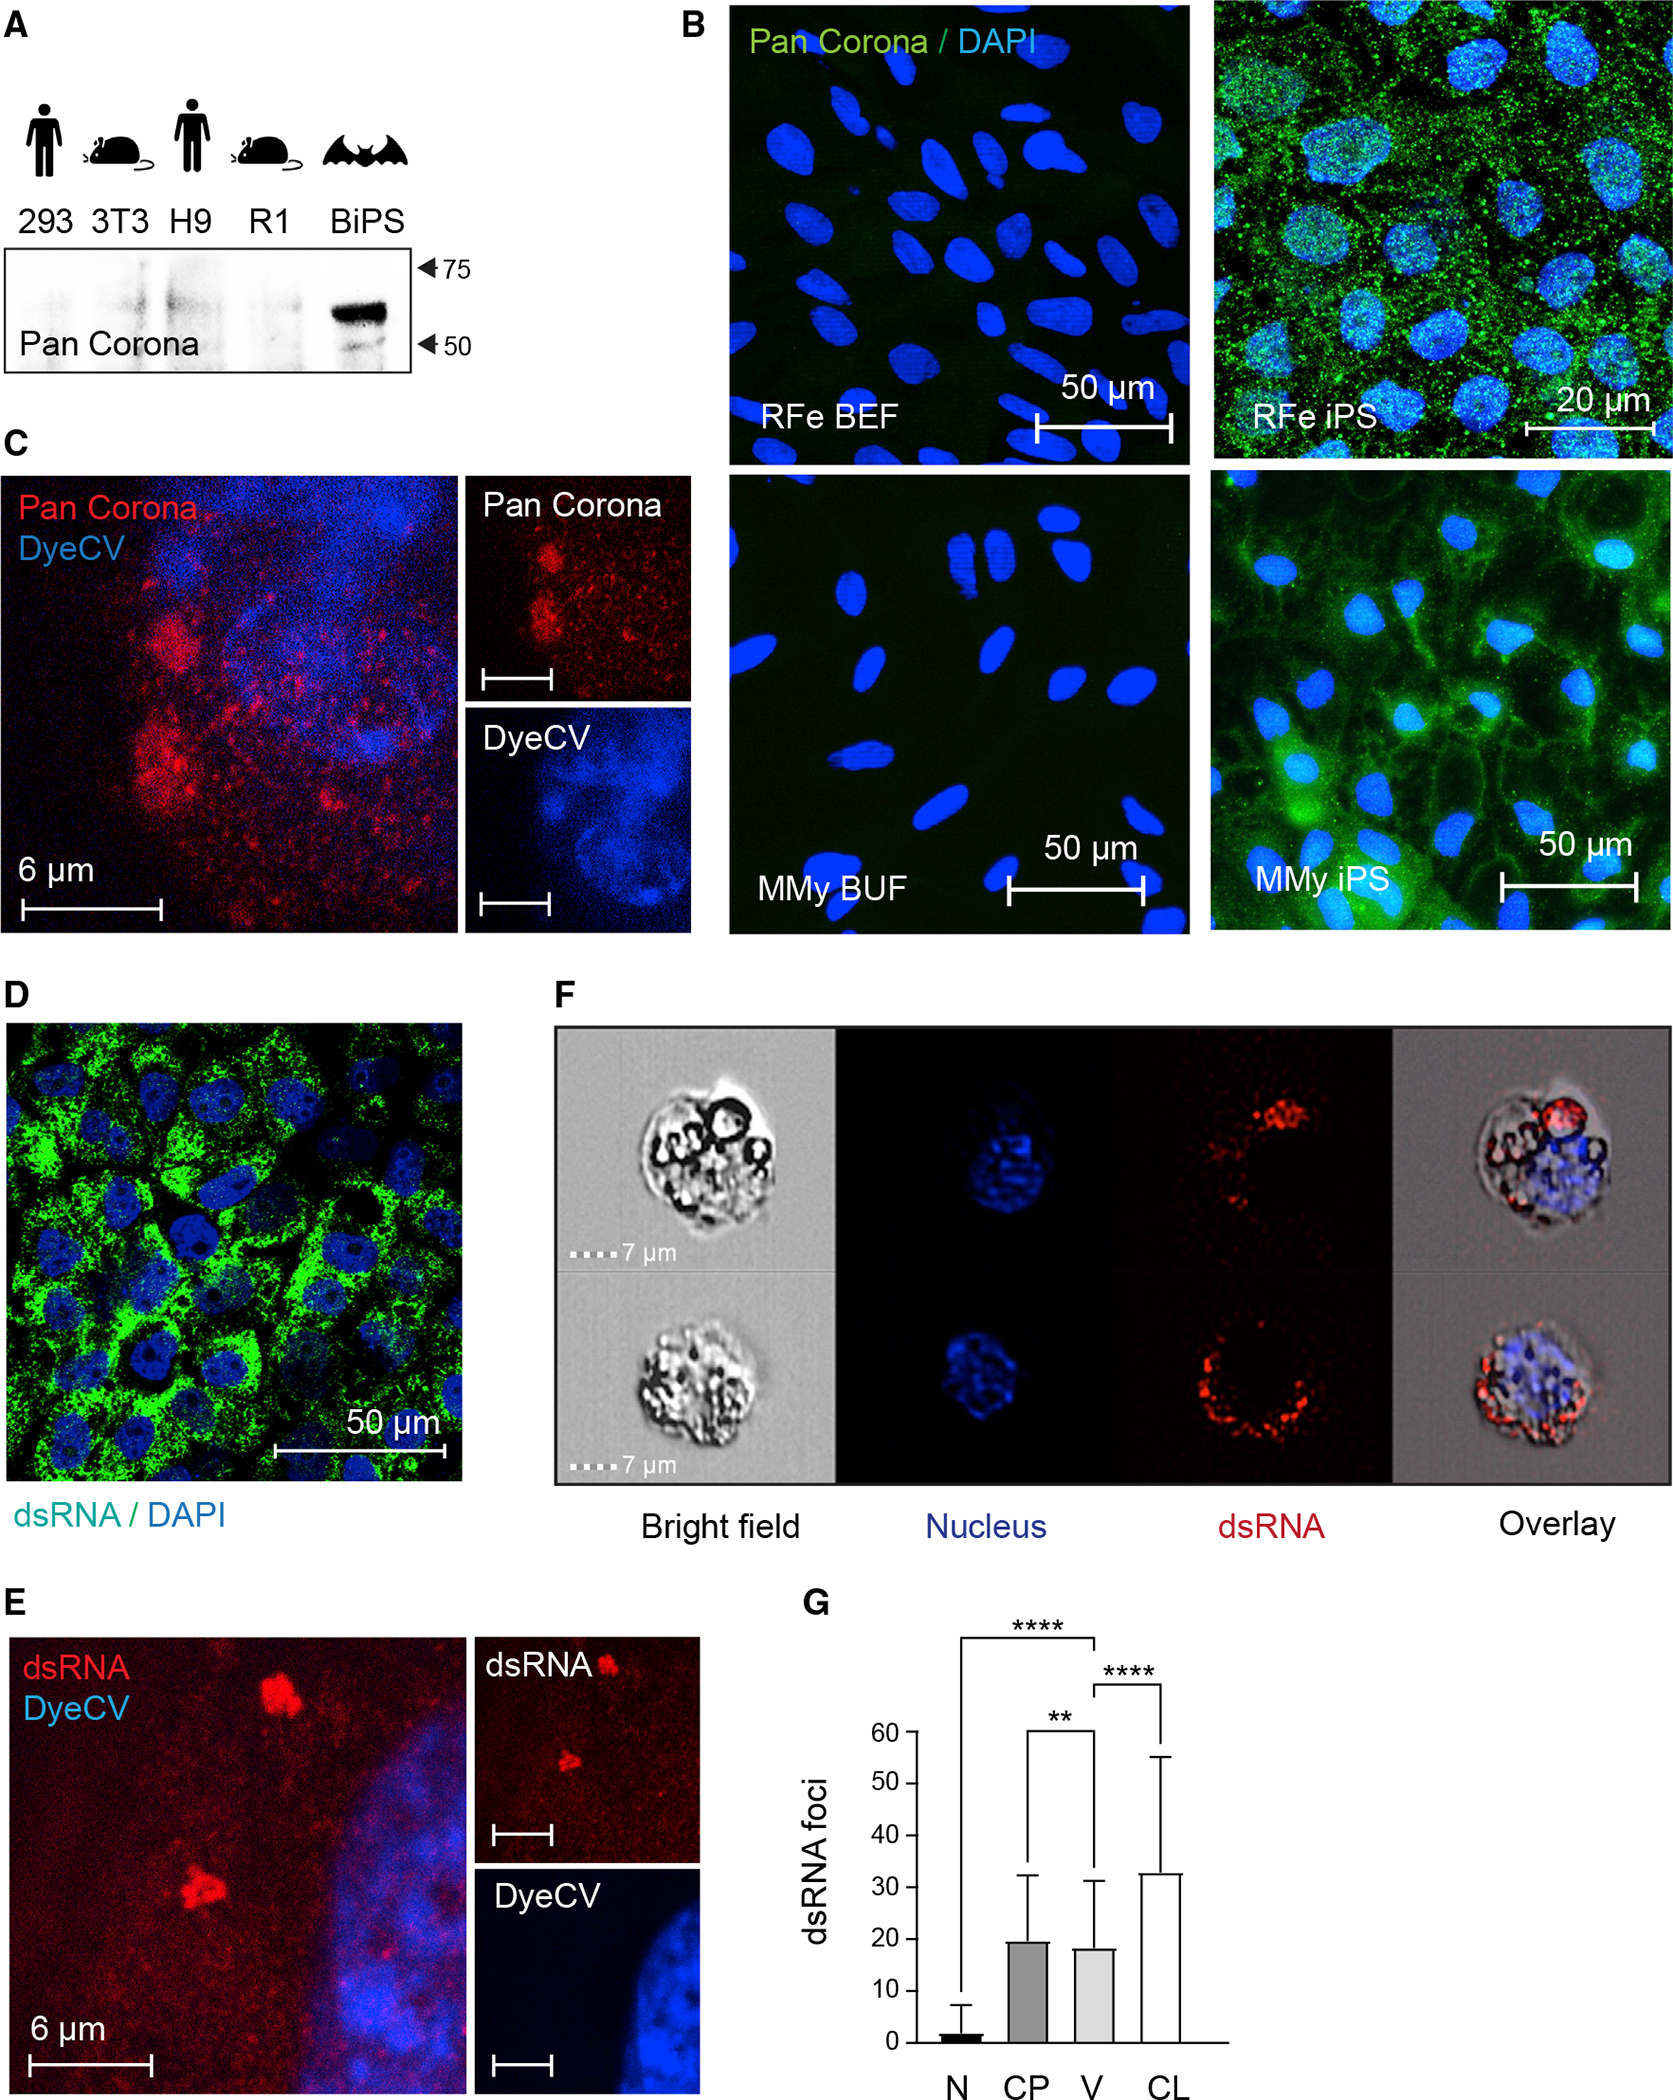
Bats are distinctive among mammals due to their ability to fly, use laryngeal echolocation, and tolerate viruses. However, there are currently no reliable cellular models for studying bat biology or their response to viral infections. Here, we created induced pluripotent stem cells (iPSCs) from two species of bats: the wild greater horseshoe bat (Rhinolophus ferrumequinum) and the greater mouse-eared bat (Myotis myotis). The iPSCs from both bat species showed similar characteristics and had a gene expression profile resembling that of cells attacked by viruses. They also had a high number of endogenous viral sequences, particularly retroviruses. These results suggest that bats have evolved mechanisms to tolerate a large load of viral sequences and may have a more intertwined relationship with viruses than previously thought. Further study of bat iPSCs and their differentiated progeny will provide insights into bat biology, virus host relationships, and the molecular basis of bats' special traits.

Keywords: bats; cancer; coronaviruses; differentiation; endogenized viruses; epigenetics; evolution; host-pathogen-interactions; induced pluripotent stem cells; inflammation; virus response.


Conflict of interest statement

Declaration of interests T.P.Z., M.D., and A.G.S. are inventors on patents and patent applications on the use of bat iPS cells, owned by the Icahn School of Medicine at Mount Sinai, New York. T.P.Z. and R.A.Y. are founders and shareholders of Paratus Sciences, and R.A.Y. is a founder and shareholder of Syros Pharmaceuticals, Camp4 Therapeutics, Omega Therapeutics, and Dewpoint Therapeutics. The A.G.S. laboratory has received research support from Pfizer, Senhwa Biosciences, Kenall Manufacturing, Avimex, Johnson & Johnson, Dynavax, 7Hills Pharma, Pharmamar, ImmunityBio, Accurius, Nanocomposix, Hexamer, N-Fold LLC, Model Medicines, and Merck, outside of the reported work. A.G.S. has consulting agreements for the following companies involving cash and/or stock: Vivaldi Biosciences, Contrafect, 7Hills Pharma, Avimex, Vaxalto, Pagoda, Accurius, Esperovax, Farmak, Applied Biological Laboratories, and Pfizer, outside of the reported work. A.G.S. is inventor on patents and patent applications on the use of antivirals and vaccines for the treatment and prevention of virus infections and cancer, owned by the Icahn School of Medicine at Mount Sinai, New York, outside of the reported work. A.M. is the creator of Omics Bioinformatics and owns all the stocks of this company. R.P.S. has a consulting agreement with Sema4 involving cash and is also a stockholder of this company. A.P. and S.D.W.F. are employees of Microsoft Corporation. S.D.W.F. is co-founder of DIOSynVax, Ltd. and an inventor on patent applications on the design of vaccine immunogens for the prevention of virus infections, outside of the reported work.

Figures

Figure 1.
Figure 1.. Derivation of pluripotent Rhinolophus ferrumequinum bat stem cells
(A) Illustration of the bat pluripotent stem cell derivation strategy. BEF, embryonic fibroblasts; OSMK, Oct4, Sox2, cMyc, Klf4; FB, fibroblast medium; PSC, pluripotent stem cell medium; PSC+, PSC with additives. (B) Microscopic images of bat pluripotent stem cells at different magnifications showing morphology of established BiPS cell colonies grown on mouse embryonic fibroblasts. (C) Differential interference contrast microscopy image of BiPS cells highlighting prominent cytoplasmic vesicles. (D) Immunofluorescent detection of Oct4 in BiPS cells. (E) MA plot of RNA-seq data illustrating the transcriptional differences between bat embryonic fibroblast (BEF) and pluripotent stem cells (BiPS). Shown is the mean average of each gene from three replicates per cell type (n = 3). Selected genes with known functions in the establishment or maintenance of pluripotency are highlighted. (F) Kmean cluster analysis of ATAC-seq signals obtained from BEF or BiPS cells. Shown is the representative result of one of two replicates per cell type. C, cluster. (G) Density plot of RRBS results obtained from BEF and BiPS cells. Shown is the representative result of one of two replicates per cell type. PCC, Pearson correlation coefficient. (H) Scatter plots of histone 3 methylation status at K4 (activating chromatin modification) or K27 (repressing chromatin modification) after ChIP-seq from BEF or BiPS cells, as indicated. Shown are the results of one sample for each chromatin mark. (I) Scatter plot correlation of H3K4me3 and H3K27me3 in BiPS cells illustrating the occurrence of bivalent chromatin sites in BiPS cells. (J) RNA-seq, ATAC-seq, and H3K4me3 or H3K27me3 ChIP-seq signals of selected genes with known roles in reprogramming that are activated (Nanog, Kit) or repressed (Thy1) in BiPS when compared with BEF cells. Shown are tracks of one representative sample. See also Figure S1 and Table S1.
Figure 2.
Figure 2.. Characteristics of pluripotency markers in pluripotent stem cells generated from Rhinolophus ferrumequinum fibroblasts
(A) Sequencing tracks showing expression, ATAC-seq signal, histone H3K27 trimethylation (H3K27me3), and histone H3K4 trimethylation (H3K4me3) status of pluripotency markers Oct4 and Sox2 in bat embryonic fibroblasts (BEF) or induced pluripotent stem cells (BiPS). (B) Fraction of methylated sites in promoters of pluripotency genes that did show promoter methylation. Data are shown as mean ± SD of two replicates; p values were determined by t test: p = 0.0015, 0.0031, 0059, and 0.0481 from left to right. n.s., not significant. Note that we did not detect methylation in the promoters of Nanog, Pou5f1, or Sox2, which might be related to under-annotation of the R. ferrumequinum genome at present. (C) Immunofluorescence images of bat pluripotent stem cells after staining of markers of naive (Tfe3 and Tfcp2l1) or primed pluripotency (Zic2 and Otx2). See also Table S1.
Figure 3.
Figure 3.. Differentiation potential of R. ferrumequinum bat pluripotent stem cells.
(A) Immunofluorescence microscopy images after staining with antibodies detecting the expression of lineage-specific markers Pax6, Afp, or brachyury (T) following specific directed differentiation into ectoderm, endoderm, or mesoderm, respectively. (B) Immunofluorescence images of embryonic bodies (EB) that formed after 3D-differentiation of BiPS cells and were stained with antibodies to detect markers specific to all three germ layers as in (A). (C) RNA-seq signals of selected lineage-specific marker genes in BiPS cells that underwent monolayer differentiation as in (A) or embryonic body differentiation as in (B). Shown is one representative sequencing track (n = 3) per condition. EB, embryonic body differentiation, EC, human ectoderm differentiation protocol; EN, human endoderm differentiation protocol; M, human mesoderm differentiation protocol. (D) Microscopic images of hematoxylin-eosin-stained sections of tumor tissue after injection of BiPS cells into immunocompromised mice exhibiting ectodermal (left), mesodermal (middle), and endodermal (right) features. (E) Images of floating blastoids that were obtained from BiPS cells after exposure to Bmp4 to capture their morphology by phase-contrast microscopy (left) and to detect Oct4 expression in inner-cell mass-like cell clusters after immunofluorescence staining (middle, right). (F) Phase-contrast microscopy image of a typical blastocyst-outgrowth-like cell cluster that formed after the attachment of blastoids to the cell culture vessel surface during Bmp4-induced differentiation as in (E). ICL, inner cell mass-like; TLO, trophoblast-like outgrowth. See also Figure S2 and Table S2.
Figure 4.
Figure 4.. Characterization of induced pluripotent stem cells derived Myotis myotis uropatagium fibroblasts
(A) Phase contrast image of Myotis myotis iPS cells. (B) Microscopic image of Myotis myotis iPS cells after immunostaining to detect pluripotency marker Oct4. (C) Immunofluorescence images of Myotis myotis pluripotent stem cells after staining of markers of naive (Tfe3 and Tfcp2l1) or primed pluripotency (Zic2 and Otx2) (D) Microscopic images of Myotis myotis iPS cells that underwent differentiation and immunostaining to detect Pax6, brachyury (T) and Afp as markers for ectoderm, mesoderm, and endoderm, respectively.
Figure 5.
Figure 5.. Distinct characteristics of bat pluripotent stem cells
(A) Principal component analysis of R. ferrumequinum induced pluripotent bat stem cells (BiPS) in comparison to those derived from other species. h, human; m, mouse. PS, pluripotent stem cells; iPS, induced pluripotent stem cells; ES, embryonic stem cells; EF, embryonic fibroblasts. Each dot represents one dataset. (B) Plot of genes that contribute to the differences of pluripotent bat and mouse stem cells as part of principal component 1 (PC1). Highlighted in light blue is the “leading edge” comprised of the top 5% of PC1-contributing genes. (C) Selected GO and (D) KEGG pathways identified to be significantly enriched among the top 5% of PC1-contributing genes/leading-edge genes defined in (B) were plotted by their odds ratio, with the color of each circle indicating the enrichment p value and the size indicating the number of genes present in the respective category (see Data Tables S3B and S3C for a full list of enriched gene sets). ER, endoplasmic reticulum; PT, protein targeting; Pos, positive; Reg, regulation. (D) Selection analyses of leading-edge genes by comparative genomics of the R. ferrumequinum lineage identified only eight genes (AARD, COL3A1, FAM111A, LAMB3, MUC1*, NES*, RGS5, RSPH1*) with significant evidence of positive selection, five of which showed at least one highly probable BEB site with no visual issues in the alignment region, while three genes (designated with *) did not (see Table S5E). Additional lineages and the number of leading-edge genes with significant evidence of positive selection found in them are highlighted in red. See also Table S3.
Figure 6.
Figure 6.. Reactivation of endogenized retroviral elements in bat induced pluripotent stem cells.
(A) Expression of indicated ERV elements in R. ferrumequinum bat embryonic fibroblasts (BEF) and iPS cells (BiPS), as determined by extracting the overlap between RNA-seq reads mapped to the R. ferrumequinum genome and known mapped ERV elements. Shown are the elements with the most evident differences (see Data Table S4A for a full list of expression data). All replicates (n = 3) per cell type are shown. (B) RNA and Iso-seq sequencing tracks for an identified full-length retrovirus sequence, RFe-V-MD1, aligned to the R. ferrumequinum genome. The Iso-seq fragment represents a 6,088 bp-long transcript (ID: 39584940). (C) Western blotting of protein lysates from human 293FT (kidney tumor cells) and human embryonic stem cells (H9), mouse 3T3 (fibroblasts) and mouse embryonic stem cells (R1), and R. ferrumequinum bat induced pluripotent stem cells (BiPS) with the endogenous retrovirus (ERV)-specific HERV K Cap antibody. (D) Immunofluorescence images of R. ferrumequinum (RFe) bat embryonic fibroblasts (BEFs) and iPS cells from (top) and M. myotis (MMy) bat uropatagium fibroblasts (BUF) and iPS cells (bottom) after detection of the endogenous retrovirus (ERV) HERV K Cap protein (green); DAPI (blue). (E) Overview of transmission electron microscopy of R. ferrumequinum bat pluripotent stem cells. MV, vesicles filled with multimembrane structures; HV, other vesicle structures filled with homogenous content; Nu, Nucleus; A, autophagosome; M, mitochondria; P, phagosome. (F) Higher magnification of electron microscopy images as in (E) showing the presence of aggregates that are morphologically compatible with the appearance of endogenous retrovirus-like particles. See also Figure S3 and Table S4.
Figure 7.
Figure 7.. Reactivation of endogenized viral elements in bat pluripotent stem cells
(A) Western blotting of protein lysates isolated from human 293FT and H9, mouse 3T3 and R1, and R. ferrumequinum BiPS cells with a pan coronavirus antibody known to be specific for the nucleocapsid; its reactivity includes, but might not be limited to, feline infectious peritonitis virus type 1 and 2, canine coronavirus (CCV), pig coronavirus transmissible gastroenteritis virus (TGEV), and ferret coronavirus. (B) Immunofluorescence images of R. ferrumequinum (RFe) bat embryonic fibroblasts (BEFs) and iPS cells from (top) and M. myotis (MMy) bat uropatagium fibroblasts (BUF) and iPS cells (bottom) after detection of the pan coronavirus antigen (green); DAPI (blue). (C) Representative STED microscopy image of R. ferrumequinum iPS cells after detecting the Corona antigen as in (B) and DyeCycle Violet (DyeCV) nuclear counter stain (blue). (D) Immunofluorescence images of R. ferrumequinum BiPS cells after detection of double-stranded RNA (green) characteristic of RNA viruses; DAPI (blue). (E) Representative STED microscopy image of R. ferrumequinum iPS cells after immunofluorescence staining of double-stranded RNA (dsRNA) as in (D). (F) ImageStream analysis after immunofluorescence staining of BiPS cells as in (D and E). A brightfield image, DyeCycle Violet nuclear staining (blue), dsRNA staining (red), and an overlay is shown for each representative cell. (G) Quantification of dsRNA foci by ImageStream in R. ferrumequinum iPS cells show in (F). Data are presented as mean +/− SD; n = 1,846 cells. **p < 0.01,****p < 0.0001 by one-way ANOVA with Bonferroni’s multiple comparisons test. RFe, Rhinolophus ferrumequinum; BEF, bat embryonic fibroblasts; CP, cytoplasm; CL, cell; iPS, induced pluripotent stem cells; MMy, Myotis myotis; N, nucleus; V, vesicle; BUF, bat uropatagium fibroblasts. See also Figures S4–S7 and Tables S5, S6, and S7.

Comment in

  • Bat crazy iPSCs.
    Athar F, Seluanov A, Gorbunova V. Athar F, et al. Cell. 2023 Mar 2;186(5):901-903. doi: 10.1016/j.cell.2023.01.033. Cell. 2023. PMID: 36868212
  • Bat-virus entanglements.
    Mukhopadhyay M. Mukhopadhyay M. Nat Methods. 2023 Apr;20(4):483. doi: 10.1038/s41592-023-01858-3. Nat Methods. 2023. PMID: 37046017 No abstract available.

References

    1. Simmons N, and Cirranello A (2020). Bat species of the world: a taxonomic and geographic database. https://batnames.org/.
    1. Allen G (1939). Bats (Harvard University Press; ).
    1. Nagel T (1974). What is it like to be a bat. The. Philosophical Review 83, 159–168.
    1. Teeling E, Dool S, and Springer M (2012). Phylogenies, fossils and functional genes: the evolution of echolocation in bats. Evol. Hist. Bats Fossils Mol. Morphol, 1–22.
    1. Teeling EC, Vernes SC, Dávalos LM, Ray DA, Gilbert MTP, and Myers E; Bat1K Consortium (2018). Bat biology, genomes, and the Bat1K project: to generate chromosome-level genomes for all living bat species. Annu. Rev. Anim. Biosci. 6, 23–46. - PubMed

Publication types