

doi: 10.1038/s41467-023-36551-8.
Increase of P-wave velocity due to melt in the mantle at the Gakkel Ridge
Affiliations
- PMID: 36813777
- PMCID: PMC9946932
- DOI: 10.1038/s41467-023-36551-8
Item in Clipboard
Increase of P-wave velocity due to melt in the mantle at the Gakkel Ridge
Nat Commun.
.
No abstract available
Conflict of interest statement
The authors declare no competing interests.
Figures
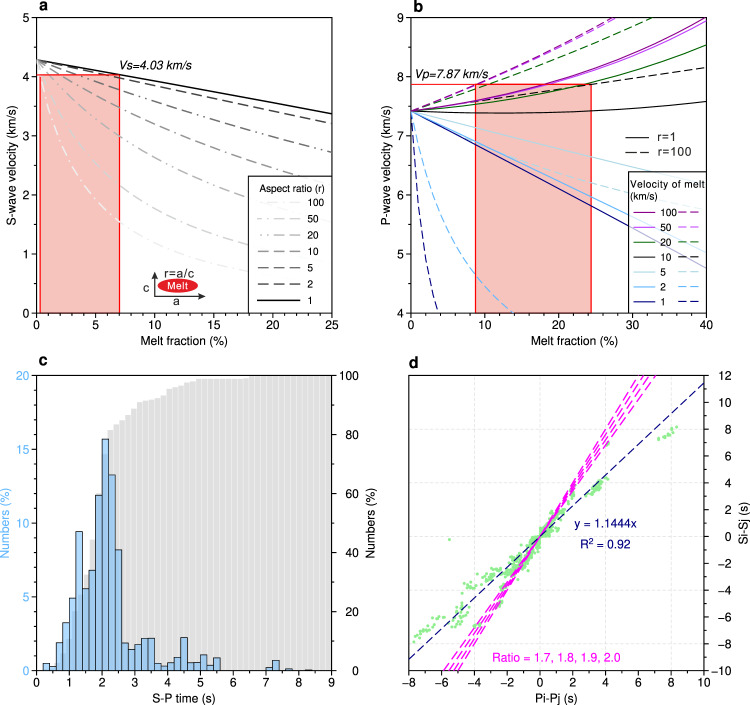
a Variation in the S-wave velocity versus the percentage of melt inclusions in the mantle at 10 km depth. The original Vs in the mantle is assumed to be 4.29 km/s. The different dashed colored lines indicate various aspect ratios (r) ranging from 1 to 100, representing the shape of ellipsoid melt inclusion (see inset red ellipse). r = 1 corresponds to spherical inclusions and r = 100 represents thin films. The red patch indicates the estimated melt fraction (~0.2–7%) based on a decrease of 0.26 km/s in the S-wave velocity. b P-wave velocity as a function for melt (rock) fraction assuming an initial Vp of 7.4 km/s in the mantle, with different P-wave velocities of the melt inclusions varying from 1 to 100 km/s (see legend) for different aspect ratios (r = 1, solid lines; r = 100, dashed lines). For an increase of 0.45 km/s in the P-wave velocity, P-wave velocities of melt inclusion vary from 10 to 100 km/s and the melt fraction would be 9.4–24.2%. c Histograms show the time differences between S- and P-wave phases on each station from Koulakov et al.. The gray columns show the cumulative percentage. d Modified Wadati diagram using the method from ref. . The green dots indicate the time differences of P-wave phases (Pi–Pj) versus those of S-wave phases (Si–Sj) of each station pair (i, j) for each event. The dashed black line indicates the estimated Vp/Vs ratio using the full dataset from Koulakov et al., ~1.14. The dashed magenta lines mark the different Vp/Vs ratios.
References
-
- Takei, Y. Effect of pore geometry on VP/VS: from equilibrium geometry to crack. J. Geophys. Res. 107, ECV 6-1–ECV 6-12 (2002).
-
- Wang, X.-Q. et al. High VP/VS ratio: saturated cracks or anisotropy effects?: high VP/VS ratio-crack anisotropy? Geophys. Res. Lett. 39, 11307 (2012).
-
- Taylor MAJ, Singh SC. Composition and microstructure of magma bodies from effective medium theory. Geophys. J. Int. 2002;149:15–21. doi: 10.1046/j.1365-246X.2002.01577.x. - DOI
-
- Christensen NI. Serpentinites, peridotites, and seismology. Int. Geol. Rev. 2004;46:795–816. doi: 10.2747/0020-6814.46.9.795. - DOI
Publication types
LinkOut - more resources
Full Text Sources
