

Disentangling the causes of temporal variation in the opportunity for sexual selection
- PMID: 36813810
- PMCID: PMC9947164
- DOI: 10.1038/s41467-023-36536-7
Disentangling the causes of temporal variation in the opportunity for sexual selection
Abstract
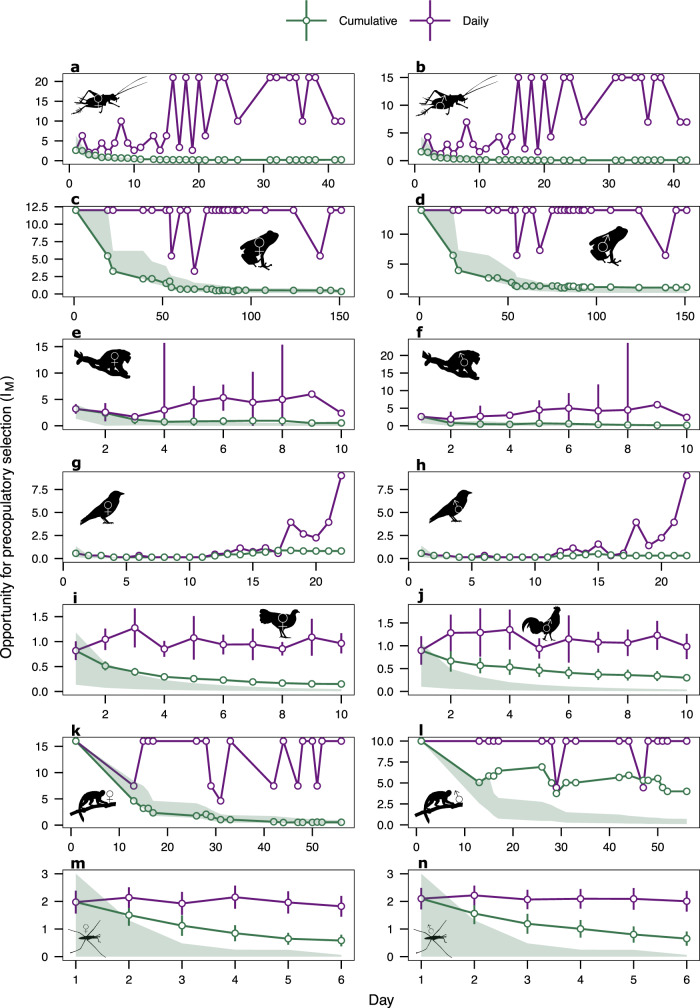
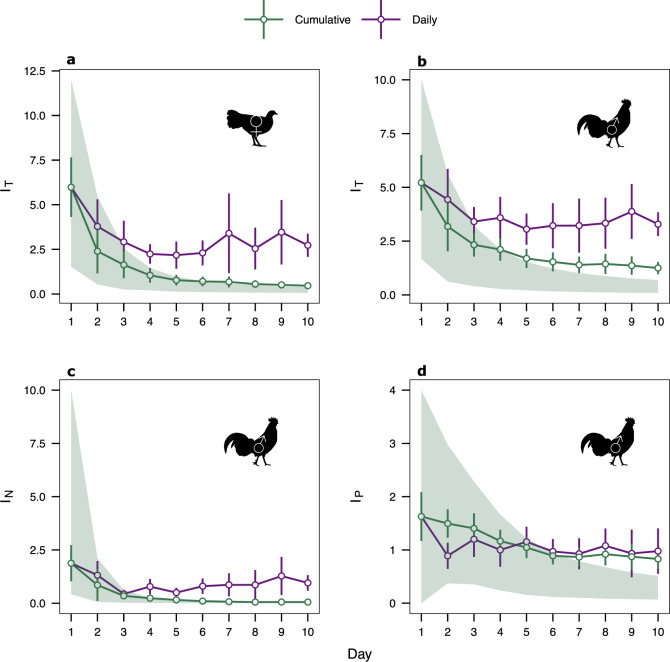
In principle, temporal fluctuations in the potential for sexual selection can be estimated as changes in intrasexual variance in reproductive success (i.e. the opportunity for selection). However, we know little about how opportunity measures vary over time, and the extent to which such dynamics are affected by stochasticity. We use published mating data from multiple species to investigate temporal variation in the opportunity for sexual selection. First, we show that the opportunity for precopulatory sexual selection typically declines over successive days in both sexes and shorter sampling periods lead to substantial overestimates. Second, by utilising randomised null models, we also find that these dynamics are largely explained by an accumulation of random matings, but that intrasexual competition may slow temporal declines. Third, using data from a red junglefowl (Gallus gallus) population, we show that declines in precopulatory measures over a breeding period were mirrored by declines in the opportunity for both postcopulatory and total sexual selection. Collectively, we show that variance-based metrics of selection change rapidly, are highly sensitive to sampling durations, and likely lead to substantial misinterpretation if used as indicators of sexual selection. However, simulations can begin to disentangle stochastic variation from biological mechanisms.
© 2023. The Author(s).
Conflict of interest statement
The authors declare no competing interests.
Figures
Similar articles
-
Differential female sociality is linked with the fine-scale structure of sexual interactions in replicate groups of red junglefowl, Gallus gallus.Proc Biol Sci. 2019 Oct 23;286(1913):20191734. doi: 10.1098/rspb.2019.1734. Epub 2019 Oct 16. Proc Biol Sci. 2019. PMID: 31615354 Free PMC article.
-
Phenology of scramble polygyny in a wild population of chrysomelid beetles: the opportunity for and the strength of sexual selection [corrected].PLoS One. 2012;7(6):e38315. doi: 10.1371/journal.pone.0038315. Epub 2012 Jun 25. PLoS One. 2012. PMID: 22761675 Free PMC article.
-
Sexual selection and personality: Individual and group-level effects on mating behaviour in red junglefowl.J Anim Ecol. 2021 May;90(5):1288-1306. doi: 10.1111/1365-2656.13454. Epub 2021 Mar 12. J Anim Ecol. 2021. PMID: 33630314
-
The total opportunity for sexual selection and the integration of pre- and post-mating episodes of sexual selection in a complex world.J Evol Biol. 2016 Dec;29(12):2338-2361. doi: 10.1111/jeb.12960. Epub 2016 Aug 31. J Evol Biol. 2016. PMID: 27520979 Review.
-
An integrative view of sexual selection in Tribolium flour beetles.Biol Rev Camb Philos Soc. 2008 May;83(2):151-71. doi: 10.1111/j.1469-185X.2008.00037.x. Biol Rev Camb Philos Soc. 2008. PMID: 18429767 Review.
Cited by
-
A male-biased sex ratio increases the opportunity for precopulatory sexual selection but does not change the Bateman gradient.Evol Lett. 2025 Feb 14;9(3):324-334. doi: 10.1093/evlett/qraf001. eCollection 2025 Jun. Evol Lett. 2025. PMID: 40487865 Free PMC article.
References
-
- Darwin, C. The Descent of Man and Selection in Relation to Sex. (John Murray, 1871).
-
- Andersson, M. Sexual Selection. (Princeton University Press, 1994).
-
- Shuster, S. & Wade, M. J. Mating Systems and Strategies. (Princeton University Press, 2003).
Publication types
MeSH terms
Associated data
LinkOut - more resources
Full Text Sources
