. 2023 Feb 22;13(1):3075.
doi: 10.1038/s41598-023-29858-5.

A multiplexed, paired-pooled droplet digital PCR assay for detection of SARS-CoV-2 in saliva

Affiliations

A multiplexed, paired-pooled droplet digital PCR assay for detection of SARS-CoV-2 in saliva

Kaitlyn Wagner et al. Sci Rep. .

Erratum in

Abstract

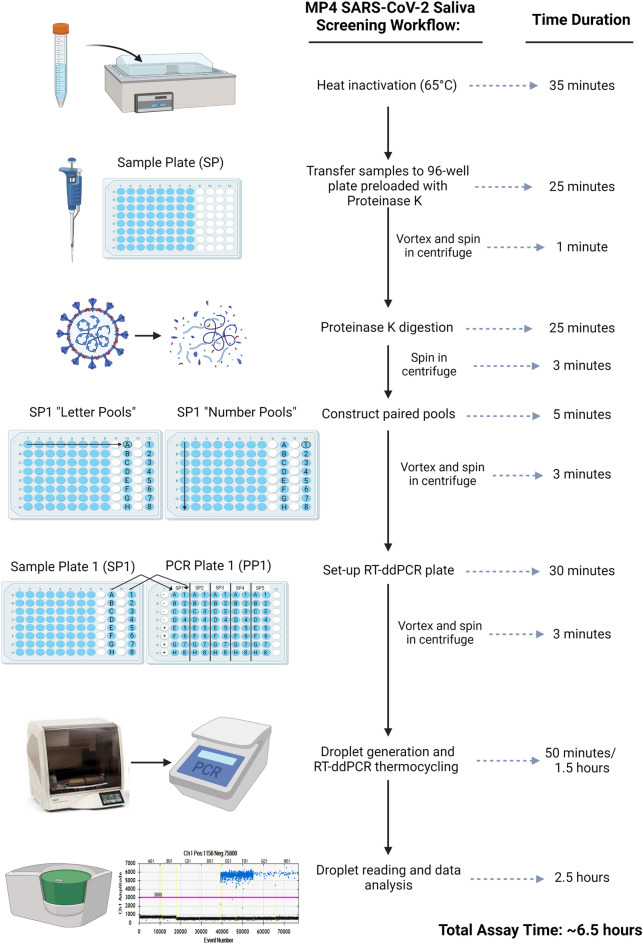
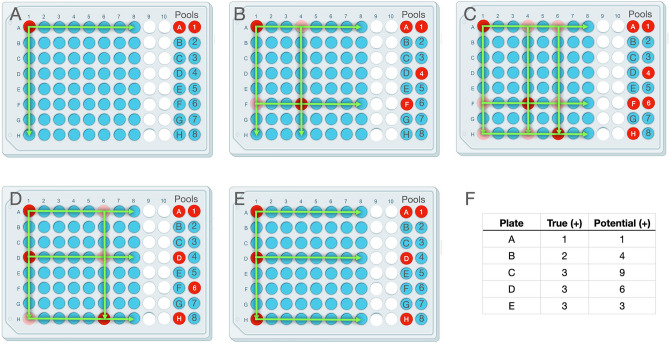
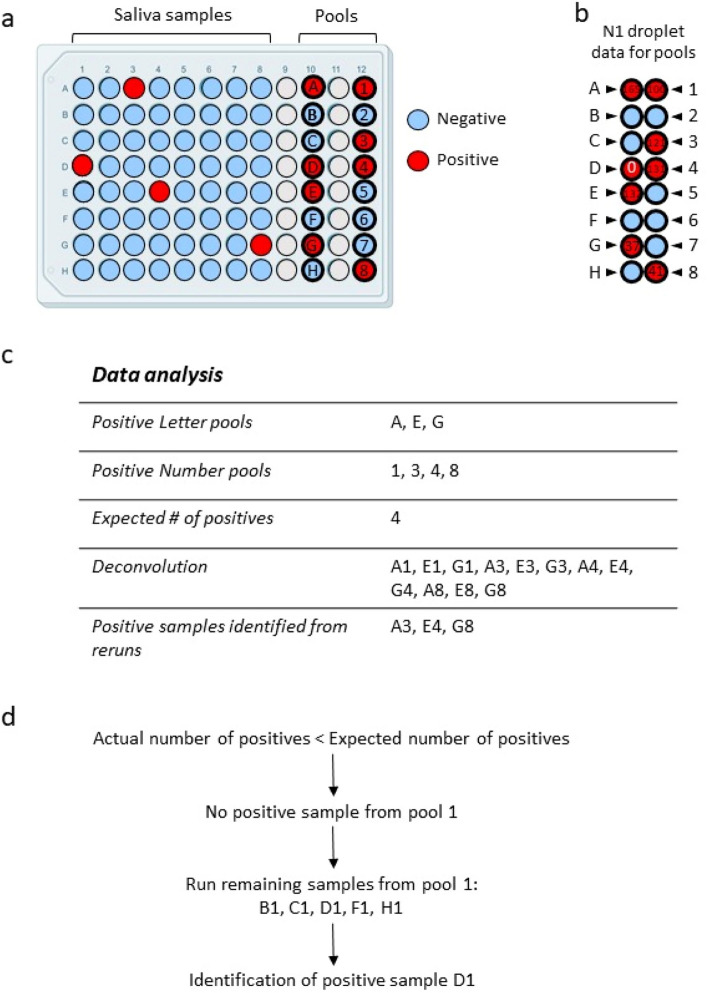
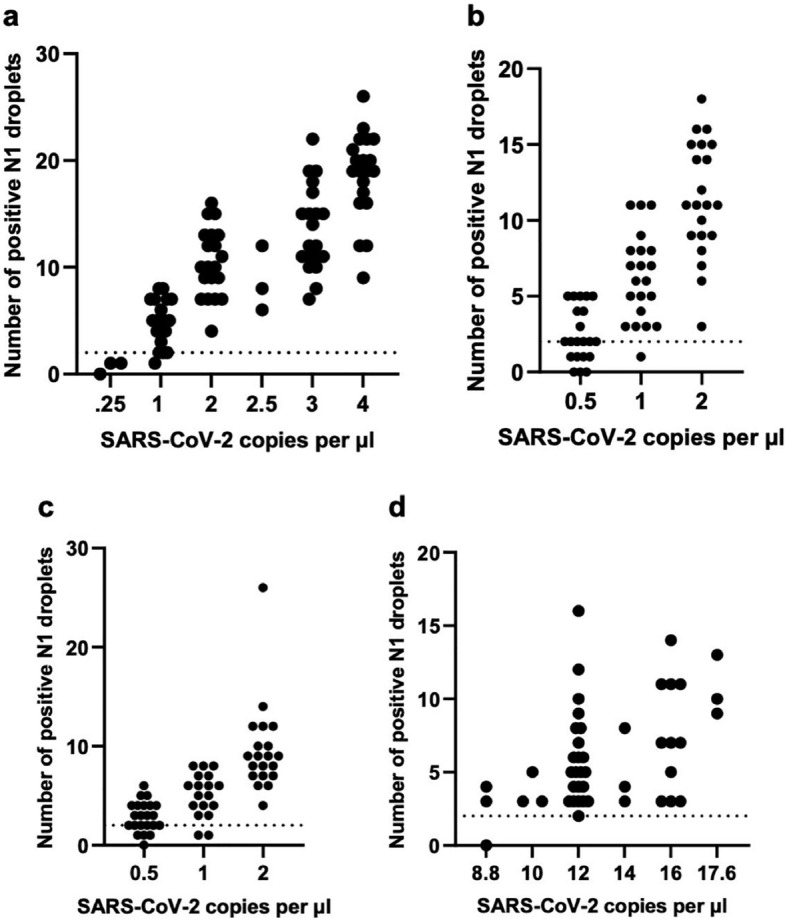
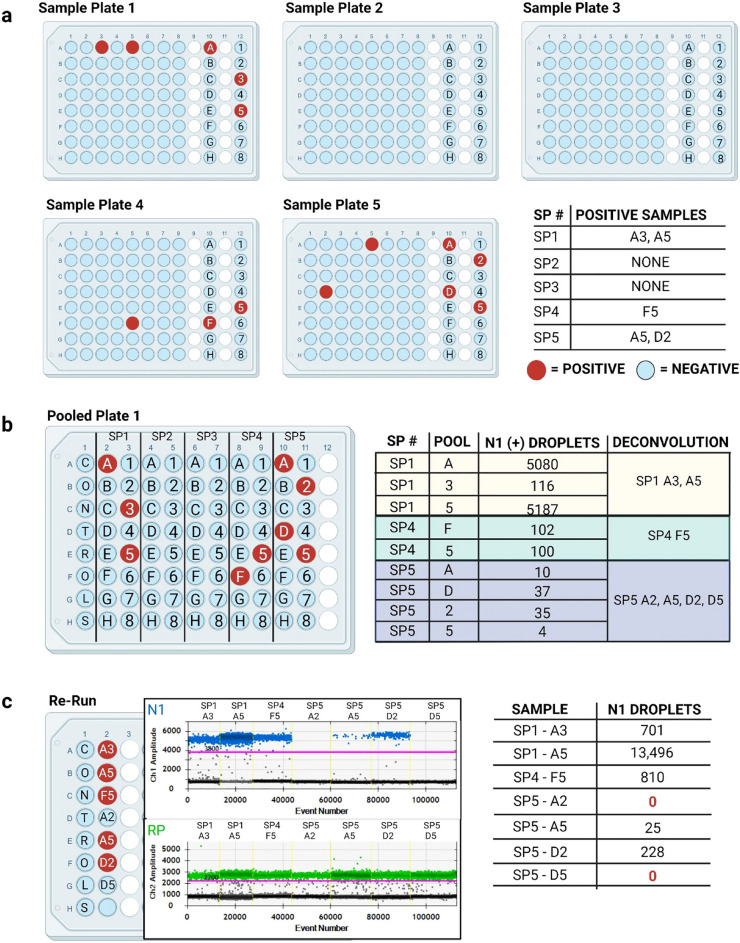
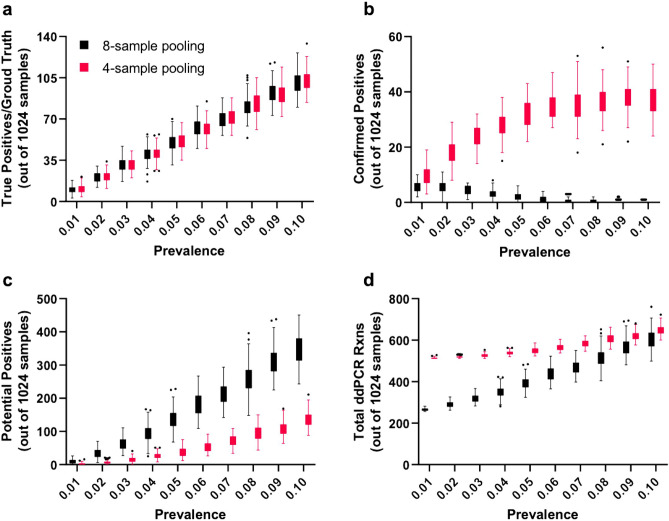
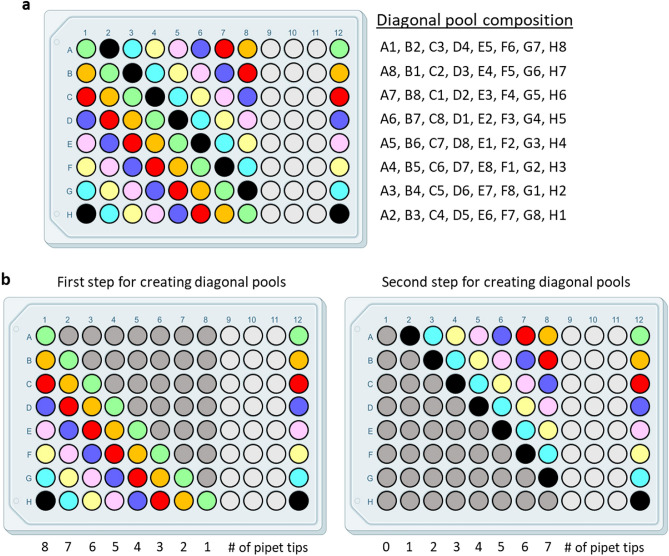
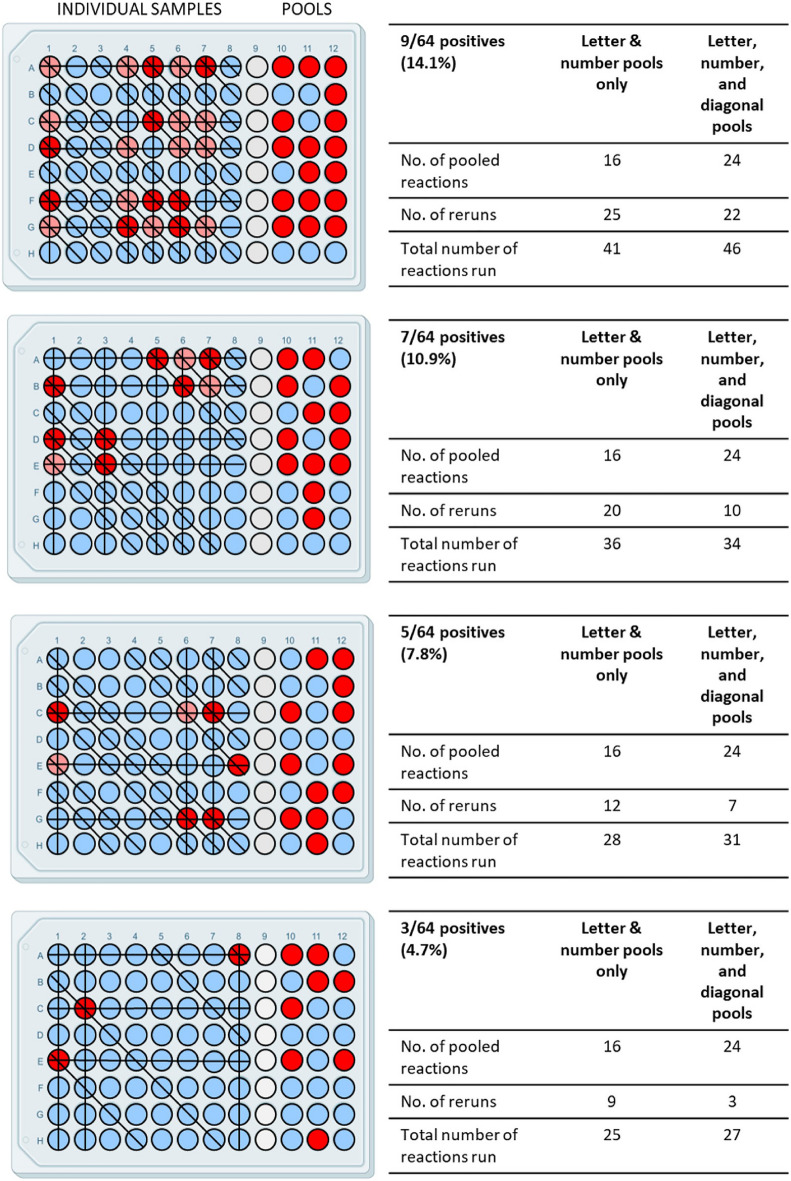
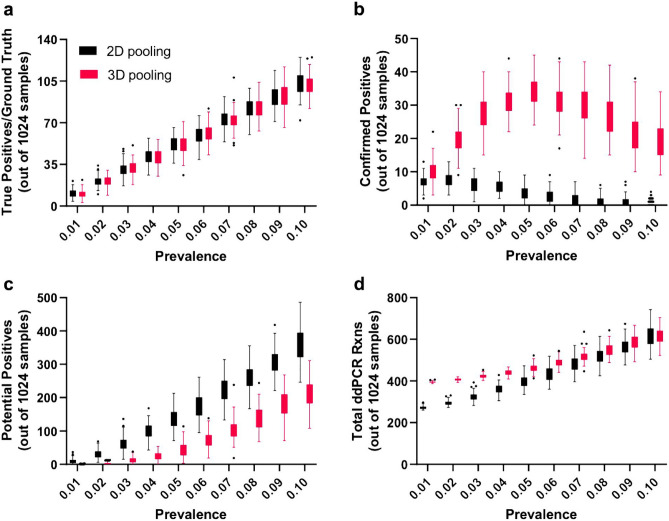
In response to the SARS-CoV-2 pandemic, we developed a multiplexed, paired-pool droplet digital PCR (MP4) screening assay. Key features of our assay are the use of minimally processed saliva, 8-sample paired pools, and reverse-transcription droplet digital PCR (RT-ddPCR) targeting the SARS-CoV-2 nucleocapsid gene. The limit of detection was determined to be 2 and 12 copies per µl for individual and pooled samples, respectively. Using the MP4 assay, we routinely processed over 1,000 samples a day with a 24-h turnaround time and over the course of 17 months, screened over 250,000 saliva samples. Modeling studies showed that the efficiency of 8-sample pools was reduced with increased viral prevalence and that this could be mitigated by using 4-sample pools. We also present a strategy for, and modeling data supporting, the creation of a third paired pool as an additional strategy to employ under high viral prevalence.


Conflict of interest statement

The authors declare no competing interests.

Figures

Figure 1
Figure 1
MP4 screening assay overview. Saliva samples from asymptomatic adults were collected, heat inactivated, and individually pipetted into columns 1–8 of a 96-well sample plate (SP) preloaded with proteinase K. Following a brief incubation and PK inactivation step, two paired pools (letter and number) were created as outlined in Materials and Methods. Pooled samples were transferred to a PCR plate (PP) containing RT-ddPCR master mix. Pooled samples for up to 5 SPs (2 columns per SP) plus one column of control samples were run per PP. After droplet generation in an Automated Droplet Generator, droplets were transferred to a thermocycler for cDNA synthesis and amplification, and then droplet fluorescence was read in a Droplet Reader (FAM/HEX channels). Thresholds for delineating positive and negative droplets were set using control samples. Positive pools (≥ 3 N1 droplets) were flagged for deconvolution and confirmatory testing of individual samples. Figure was created with BioRender.com.
Figure 2
Figure 2
Deconvolution of positive individual samples by decoding paired pools. Sample deconvolution scenarios for plates containing one (A), two (B), or three (C-E) positive samples per 64-sample plate. Columns 1–8 represent individual samples, with positive samples shown in red. Pooled samples are shown on the right, with positive pools indicated in red. (A) When the positivity rate is low (1/64; < 2%), single positives can be identified unambiguously. (B-E) More than one positive sample per plate (> 3%) requires deconvoluting true positives (red) from potential positives (red and pink). (F) As the number of true positives (equal to the (greater of) the number of positive pools from either letter or number pools) increase on a sample plate, the number of potential positives (equal to the product of the number of positive letter pools times the number of positive number pools) increases. In rarer cases, a pool may contain several positives, which are surprisingly easy to identify (D, E).
Figure 3
Figure 3
Example dataset and workflow for identification of a positive sample with only one positive pool. (a) Schematic of the sample plate with positive (red) and negative (blue) samples and pools (bold outline). (b) N1 droplet counts for the pools. Pool D, which should have been positive, is indicated in red. (c) Data analysis including the positive pools, expected number of positive samples, deconvolution, and rerun data. (d) Outline of workflow when the actual number of positives (3) was less than expected, resulting in the identification of positive sample D1.
Figure 4
Figure 4
Determination of the LOD for MP4 assay. LOD was determined in single-sample (a-c) and pooled (d) assays using three different SARS-CoV-2 virus sources. LOD for QE-extracted virus in water (a) and purified viral RNA diluted in water (b) and were determined to be 2 and 1 SARS-CoV-2 copies per µl, respectively. The LOD in single-sample (c) and pooled (d) assays in which negative saliva was spiked with a positive saliva sample of known virus concentration was determined to be 2 and 12 SARS-CoV-2 copies per µl, respectively. Experiments in (c,d) were performed using PK-digested saliva according to the MP4 assay. Data points above the dotted line (set at 2 copies per µl) meet our threshold of ≥ 3 positive N1 droplets. LOD is represented as SARS-CoV-2 copies per µl in the starting sample and was defined as the lowest concentration of virus in which ≥ 95% of replicates (n ≥ 20) were scored as positive.
Figure 5
Figure 5
Representative example of data from a typical PCR plate and subsequent confirmatory testing. (a) Schematic of 5 sample plates (SPs) containing 0–2 positive samples (red) identified by the MP4 screening assay. Negative samples are shown in light blue. (b) Schematic of the PCR plate containing pooled samples from SP1-5. N1 droplet numbers for each positive pool as well as deconvolution results are shown in the table. (c) Schematic of the re-run plate with individual samples identified in B. Quantasoft charts showing fluorescent amplitudes of N1 (top, blue) and RP (bottom, green) droplets for each sample are shown. Thresholds distinguishing positive from negative droplets are shown as pink lines. N1 droplet numbers for the individual samples are shown in the table.
Figure 6
Figure 6
Pooled and individual detection of SARS-CoV-2 in saliva collected during the Fall 2021 semester (August 23- December 17). Pools with more than one positive sample and samples with no negative droplets were removed before analysis. (a) Concordance between letter and number pools. Pearson’s correlation coefficient, r = 0.974 (p < 0.0001). (b) Box and whisker plots of copies per reaction for letter and number pools. Data are plotted on a log10 scale. Boxes extend from the 25th to 75th percentiles with median indicated by a line. The letter versus number pools comparison had a median of differences of 4. Asterisks (****) denote a p-value < 0.0001 as determined using Wilcoxon matched-pairs signed rank test. (c) Plot of pooled versus individual copies per reaction for letter (red) and number (blue) pools. Pearson’s r = 0.907 (p < 0.0001) and 0.929 (p < 0.0001) for letter and number pools, respectively. Green circles indicate paired pool samples that deviate from the trendline. The dashed line indicates the line of identity (x = y).
Figure 7
Figure 7
Simulations of 8-sample versus 4-sample pooling strategies. Each simulation contained 1,024 samples arranged in 16, 64-sample plates containing random positive samples at 10 different prevalence values (0.01–0.1). 100 iterations were simulated for each prevalence value and the data summarized using a Tukey boxplot (Graphpad). (a) The number of positive samples (ground truth) at each prevalence value. (b) The number of positive samples correctly identified by the results from pooled samples. (c) The number of potential positive samples identified from the results of pooled samples that would need to be rerun individually for confirmation. (d) The total number of ddPCR reactions required to confirm all positives.
Figure 8
Figure 8
Outline and pipetting strategy for creating diagonal pools. (a) We pooled samples diagonally from the indicated wells such that we transferred aliquots of all same-colored samples to their color-matched well in column 12. (b) Pipetting strategy to create diagonal pools. In the first step (left), an 8-well multichannel pipettor was loaded with the indicated number of tips. With the pipettor oriented vertically, samples were aliquoted from the individual wells (colored) of each column. Samples were then pipetted into column 12 such that the top-most sample (green) is dispensed into well A12. In the second step, a similar strategy is used, except that samples were pipetted into column 12 such that the bottom-most sample (black) was pipetted into well H12.
Figure 9
Figure 9
Effect of diagonal pooling on the number of pooled reactions, reruns, and total number of reactions on representative sample plates containing 3, 5, 7, or 9 positive samples out of 64. Individual positive and negative samples are indicated in red and light green, respectively. Potential positives are shown in pink. Positive and negative pooled samples are indicated in red and green, respectively. Columns 10–12 represent letter, number, and diagonal pools, respectively. Inclusion of a third pooled sample increased the number of initial pooled samples from 16 to 24 but reduced the number of rerun reactions.
Figure 10
Figure 10
Simulations of 2D and 3D 8-sample pooling strategies. (a) Similar sample sets to those in Fig. 7 were created with 1,024 total samples and positive samples randomly introduced at 1–10% positivity rates. (b, c) The number of confirmed and potential positives, respectively. Above 8% prevalence no confirmed positive samples can be determined by 2D pooling, while 3D pooling identified significant numbers of known positives even at 10% prevalence. (d) As prevalence surpasses 5%, the total number of tests for each strategy equilibrates.

Similar articles

Cited by

References

    1. Walke HT, Honein MA, Redfield RR. Preventing and responding to COVID-19 on college campuses. JAMA. 2020;324:1727–1728. doi: 10.1001/jama.2020.20027. - DOI - PMC - PubMed
    1. Dooling K, et al. The advisory committee on immunization practices’ interim recommendation for allocating initial supplies of COVID-19 vaccine — United States, 2020. MMWR Morb. Mortal Wkly. Rep. 2020;69:1857–1859. doi: 10.15585/mmwr.mm6949e1. - DOI - PMC - PubMed
    1. Centers for Disease Control and Prevention. CovidVaxView. https://www.cdc.gov/vaccines/imz-managers/coverage/covidvaxview/index.html.
    1. Thomas, K., Weiland, N. & LaFraniere, S. F.D.A. Advisory panel gives green light to pfizer vaccine. New York Times (2020).
    1. Booeshaghi, A. S., Tan, F., Renton, B., Berger, Z. & Pachter, L. Markedly heterogeneous COVID-19 testing plans among US colleges and universities. medRxiv 2020.08.09.20171223 (2020) doi:10.1101/2020.08.09.20171223.

Publication types