. 2023 Mar;42(14):1117-1131.
doi: 10.1038/s41388-023-02596-8. Epub 2023 Feb 22.

Mitochondrial structure and function adaptation in residual triple negative breast cancer cells surviving chemotherapy treatment

Affiliations

Mitochondrial structure and function adaptation in residual triple negative breast cancer cells surviving chemotherapy treatment

Mokryun L Baek et al. Oncogene. 2023 Mar.

Abstract

Neoadjuvant chemotherapy (NACT) used for triple negative breast cancer (TNBC) eradicates tumors in ~45% of patients. Unfortunately, TNBC patients with substantial residual cancer burden have poor metastasis free and overall survival rates. We previously demonstrated mitochondrial oxidative phosphorylation (OXPHOS) was elevated and was a unique therapeutic dependency of residual TNBC cells surviving NACT. We sought to investigate the mechanism underlying this enhanced reliance on mitochondrial metabolism. Mitochondria are morphologically plastic organelles that cycle between fission and fusion to maintain mitochondrial integrity and metabolic homeostasis. The functional impact of mitochondrial structure on metabolic output is highly context dependent. Several chemotherapy agents are conventionally used for neoadjuvant treatment of TNBC patients. Upon comparing mitochondrial effects of conventional chemotherapies, we found that DNA-damaging agents increased mitochondrial elongation, mitochondrial content, flux of glucose through the TCA cycle, and OXPHOS, whereas taxanes instead decreased mitochondrial elongation and OXPHOS. The mitochondrial effects of DNA-damaging chemotherapies were dependent on the mitochondrial inner membrane fusion protein optic atrophy 1 (OPA1). Further, we observed heightened OXPHOS, OPA1 protein levels, and mitochondrial elongation in an orthotopic patient-derived xenograft (PDX) model of residual TNBC. Pharmacologic or genetic disruption of mitochondrial fusion and fission resulted in decreased or increased OXPHOS, respectively, revealing longer mitochondria favor oxphos in TNBC cells. Using TNBC cell lines and an in vivo PDX model of residual TNBC, we found that sequential treatment with DNA-damaging chemotherapy, thus inducing mitochondrial fusion and OXPHOS, followed by MYLS22, a specific inhibitor of OPA1, was able to suppress mitochondrial fusion and OXPHOS and significantly inhibit regrowth of residual tumor cells. Our data suggest that TNBC mitochondria can optimize OXPHOS through OPA1-mediated mitochondrial fusion. These findings may provide an opportunity to overcome mitochondrial adaptations of chemoresistant TNBC.


Figures

Figure 1.
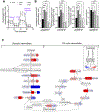
Figure 1.. Conventional chemotherapies differentially alter mitochondrial metabolism in TNBC cells.
(A) Seahorse MitoStress Test of MDA-MB-231 cells 48 hours following treatment with DNA-damaging chemotherapy agents (100 nM DXR, doxorubicin; 100 μM CRB, carboplatin) and microtubule stabilizing chemotherapy agents (10 nM PTX, paclitaxel; 5 nM DTX, docetaxel) or vehicle (DMSO). OCR readings were normalized to cell counts computed from DAPI staining immediately following the Seahorse assay. Measurements from the Mito Stress Test results were quantified: (B) maximal OCR, basal OCR, basal ECAR, and OCR/ECAR ratio. Data are represented as the mean ± SEM (n=4). ****P < 0.0001, ***<0.001, **<0.01, *<0.05, one-way ANOVA. (C) 13C-glucose derived, or 13C-glutamine derived, enrichment of glycolytic and TCA cycle intermediates was measured in MDA-MB-231 cells 48 hours after treatment with vehicle (DMSO), DXR, CRB, and PTX (n=3/ group). Data were drawn in SBGN (system biology graphical notation), Process Description (PD) and Activity Flow (AF) languages or Simple Interaction Format (SIF). Metabolites are color-coded based on the 13C-flux ratio calculated as previously described. The increased metabolic flux is represented in red, and decreased flux is represented in blue relative to vehicle treated cells.
Figure 2.
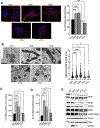
Figure 2.. Mitochondrial structure is altered in residual TNBC cells surviving conventional chemotherapy treatments.
MDA-MB-231 cells were treated with vehicle (DMSO), DXR (100 nM), CRB (100 μM), PTX (10 nM), or DTX (5 nM). After 48 hours, residual cells were analyzed by: (A) MitoTracker Red and DAPI staining. Mitochondrial morphology subtype was assigned using MicroP. Data are represented as the mean ± SEM (n>=3, at least 30 cells per experiment). Scale bars are 10 μm. ****P < 0.0001, ***<0.001 by one-way ANOVA. (B) TEM of cells treated as above. Scale bars are 500 nm. Mitochondria length (maximum Feret’s diameter) was measured with Qupath. ****P < 0.0001 and *<0.05 by one-way ANOVA. (C) qPCR to compute mtDNA:nucDNA ratios. ****P < 0.0001, ***<0.001, **<0.01, *<0.05 by one-way ANOVA. (D) quantification of number of mitochondria per nucleus from MitoTracker and DAPI stained cells by MicroP analysis of data from Figure 2a. ****P < 0.0001, ***<0.001, **<0.01, *<0.05 by one-way ANOVA. (E) western blot of mitochondrial fission and fusion proteins. Data are representative of at least 5 independent experiments.
Figure 3.
Figure 3.. Pharmacologic perturbation of mitochondrial morphology functionally impacts mitochondrial metabolism in TNBC cells.
MDA-MB-231 cells were treated with a sub-lethal dose of vehicle (DMSO), Mdivi-1 (5μM), or MYLS22 (50 μM), then after 48 hours cells were analyzed by: (A) MitoTracker Red and DAPI staining. Mitochondrial morphology subtype was assigned using MicroP. Data are represented as the mean ± SEM (n >30 cells per group). Scale bars are 10 μm. (B) Seahorse MitoStress Test with OCR readings normalized to cell counts computed from DAPI staining immediately following the Seahorse assay. (C) Maximal OCR, basal OCR, basal ECAR and OCR/ECAR ratio were computed from the Mito Stress Test. ****P < 0.0001, ***<0.001, **<0.01 by one-way ANOVA test.
Figure 4.
Figure 4.. Genetic perturbation of mitochondrial morphology alters mitochondrial metabolism in TNBC cells.
MDA-MB-231 cells were transfected with siRNAs to knock down DRP1 or OPA1 or a non-targeting control siRNA (NC). 48 hours after transfection, cells were analyzed by: (A) western blotting to verify knockdown, (B) MitoTracker Red and DAPI staining. Mitochondrial morphology subtype was assigned using MicroP. Scale bars are 10 μm. Data are represented as the mean ± SEM (n>=3, at least 30 cells per experiment), ****P < 0.0001, ***<0.001, **<0.01 by one-way ANOVA test. (C-F) Seahorse Mito Stress Test with OCR readings normalized to cell counts computed from DAPI staining immediately following the Seahorse assay. (D,F) Maximal OCR, basal OCR, basal ECAR and OCR/ECAR ratio were computed from the MitoStress Test. ****P < 0.0001, ***<0.001, **<0.01 by one-way ANOVA test.
Figure 5.
Figure 5.. Mitochondrial morphology impacts chemo-sensitivity of TNBC cells.
(A) IncuCyte time lapse imaging of MDA-MB-231 cell confluence following transfection with siOPA1 or siNC. Imaging started immediately after siRNA transfections. (B) 48 hours after transfection, MDA-MB-231 cells were treated with DXR for 48 hours, then the IC50 was calculated from a 10-point dose curve by Cell Titer Glo luminescence. Data are represented as the mean ± SEM (n=3), ***P < 0.001, **<0.01, *<0.05 by one-way ANOVA test. (C) IncuCyte time lapse imaging of MDA-MB-231 cell confluence following treatment with vehicle (DMSO), MYLS22 (50 μM), DXR (100 nM), or DXR followed 48 hours later by MYLS22. **P<0.01 by two sample t-test (D) Cells treated as in 5C were analyzed by MitoTracker Red and DAPI staining. Scale bars are 10 μm. (E) Cells treated as in 5C were analyzed by the Seahorse MitoStress Test with OCR readings normalized to cell counts computed from DAPI staining immediately following the Seahorse assay. (F) Maximal OCR, basal OCR, basal ECAR and OCR/ECAR ratio were computed from the MitoStress Test. ****P < 0.0001, *<0.05 by one-way ANOVA test. Data are representative of at least 3 independent experiments.
Figure 6.
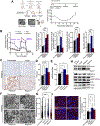
Figure 6.. Mitochondrial adaptations in a PDX model of post-AC residual TNBC.
(A) Schematic diagram of procedures performed on PDX tumors isolated from NOD/SCID mice bearing orthotopic PIM001-P tumors treated with a single AC dose (day 0; 50 mg/kg C + 0.5 mg/kg A). Tumors were harvested prior to AC treatment, 2 days following AC (ACd2), 21 days following AC (residual), and 35 days following AC when tumors had reached the starting tumor volume (regrown) and were used for multiple analyses: (B) Seahorse MitoStress Tests were conducted immediately after tumor isolation, digestion, and purification of human tumor cells. Maximal OCR, basal OCR, basal ECAR and OCR/ECAR ratio were computed from the MitoStress Test. ****P < 0.0001 and *<0.05 by one-way ANOVA test. (C) IHC with a human mitochondria specific antibody. Scale bars are 20 μm. (D) Vectra 3 machine learning quantification of IHC staining intensity within tumor cells. *P<0.05 by one-way ANOVA test. (E) qPCR-based quantification of mtDNA:nucDNA ratio using DNA prepared from snap-frozen purified tumor cells. (F-G) TEM to quantify mitochondrial length. Mitochondria were annotated with QuPath. Scale bars are 1 μm. Approximately 3000 mitochondria per group were analyzed across 3 biological replicate mice per group. ***P < 0.001 and *<0.05 by one-way ANOVA test, (H) western blotting to measure mitochondrial fusion and fission protein levels, and (I) co-immunofluorescence of OPA1 (red), VDAC1 (green; see Fig S11), and nucleus DAPI (blue). scale bars are 10 μm. Fluorescence intensity of OPA1 normalized to VDAC was measured by ImageJ. ****P < 0.0001, ***<0.001, **<0.01, *<0.05 by one-way ANOVA test.
Figure 7.
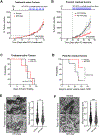
Figure 7.. Pharmacologic inhibition of OPA1 slows residual tumor regrowth in a PDX model.
(A) NOD/SCID mice bearing orthotopic PIM001-P tumors were treated with vehicle (corn oil, intratumoral injection; n=4) or MYLS22 (100 mg/kg intratumoral injection; n=4) when tumors reached an average volume of 150 mm3. (B) 21 days following a dose of AC, residual tumor-bearing mice began treatment with vehicle (corn oil, n=6) or MYLS22 (n=6). Data are represented as the mean ± SEM. Tumor growth plots of data were analyzed by two sample t-test. (C-D) Survival plots of data from 7A-B were analyzed by Wilcoxon test. (E-F) TEM was conducted on 4 tumors per group from 7A-B. Scale bars are 250 nm. Approximately 2000 mitochondria per group were analyzed at least 3 biological replicate mice per group. Data are represented as the mean ± SEM (n=3), ****P < 0.0001 by t-test.

References

    1. Garrido-Castro AC, Lin NU, Polyak K. Insights into Molecular Classifications of Triple-Negative Breast Cancer: Improving Patient Selection for Treatment. Cancer Discov 2019;9:176–98. - PMC - PubMed
    1. Symmans WF, Wei C, Gould R, et al. Long-Term Prognostic Risk After Neoadjuvant Chemotherapy Associated With Residual Cancer Burden and Breast Cancer Subtype. J Clin Oncol 2017;35:1049–60. - PMC - PubMed
    1. Liedtke C, Mazouni C, Hess KR, et al. Response to Neoadjuvant Therapy and Long-Term Survival in Patients With Triple-Negative Breast Cancer. J Clin Oncol 2008;26:1275–81. - PubMed
    1. Cortazar P, Zhang L, Untch M, et al. Pathological complete response and long-term clinical benefit in breast cancer: the CTNeoBC pooled analysis. Lancet 2014;384:164–72. - PubMed
    1. von Minckwitz G, Untch M, Blohmer JU, et al. Definition and impact of pathologic complete response on prognosis after neoadjuvant chemotherapy in various intrinsic breast cancer subtypes. J Clin Oncol 2012;30:1796–804. - PubMed

Publication types

MeSH terms

Substances