. 2023 Feb;614(7949):676-681.
doi: 10.1038/s41586-022-05434-1. Epub 2023 Feb 22.

Suppressing quantum errors by scaling a surface code logical qubit

Collaborators

Suppressing quantum errors by scaling a surface code logical qubit

Google Quantum AI. Nature. 2023 Feb.

Abstract

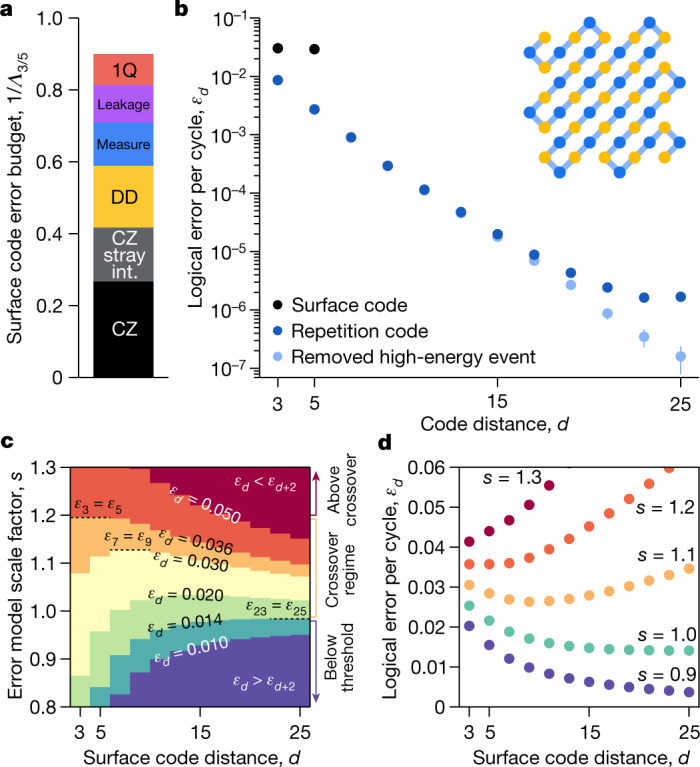
Practical quantum computing will require error rates well below those achievable with physical qubits. Quantum error correction1,2 offers a path to algorithmically relevant error rates by encoding logical qubits within many physical qubits, for which increasing the number of physical qubits enhances protection against physical errors. However, introducing more qubits also increases the number of error sources, so the density of errors must be sufficiently low for logical performance to improve with increasing code size. Here we report the measurement of logical qubit performance scaling across several code sizes, and demonstrate that our system of superconducting qubits has sufficient performance to overcome the additional errors from increasing qubit number. We find that our distance-5 surface code logical qubit modestly outperforms an ensemble of distance-3 logical qubits on average, in terms of both logical error probability over 25 cycles and logical error per cycle ((2.914 ± 0.016)% compared to (3.028 ± 0.023)%). To investigate damaging, low-probability error sources, we run a distance-25 repetition code and observe a 1.7 × 10⁻⁶ logical error per cycle floor set by a single high-energy event (1.6 × 10⁻⁷ excluding this event). We accurately model our experiment, extracting error budgets that highlight the biggest challenges for future systems. These results mark an experimental demonstration in which quantum error correction begins to improve performance with increasing qubit number, illuminating the path to reaching the logical error rates required for computation.


Conflict of interest statement

The authors declare no competing interests.

Figures

Fig. 1
Fig. 1. Implementing surface code logical qubits.
a, Schematic of a 72-qubit Sycamore device with a distance-5 surface code embedded, consisting of 25 data qubits (gold) and 24 measure qubits (blue). Each measure qubit is associated with a stabilizer (blue coloured tile, dark: X, light: Z). Representative logical operators ZL (black) and XL (green) traverse the array, intersecting at the lower-left data qubit. The upper right quadrant (red outline) is one of four subset distance-3 codes (the four quadrants) that we compare to distance-5. b, Illustration of a stabilizer measurement, focusing on one data qubit (labelled ψ) and one measure qubit (labelled 0), in perspective view with time progressing to the right. Each qubit participates in four CZ gates (black) with its four nearest neighbours, interspersed with Hadamard gates (H), and finally, the measure qubit is measured and reset to 0 (MR). Data qubits perform dynamical decoupling (DD) while waiting for the measurement and reset. All stabilizers are measured in this manner concurrently. Cycle duration is 921 ns, including 25-ns single-qubit gates, 34-ns two-qubit gates, 500-ns measurement and 160-ns reset (see Supplementary Information for compilation details). The readout and reset take up most of the cycle time, so the concurrent data qubit idling is a dominant source of error. c, Cumulative distributions of errors for single-qubit gates (1Q), CZ gates, measurement (Meas.) and data qubit dynamical decoupling (idle during measurement and reset), which we refer to as component errors. The circuits were benchmarked in simultaneous operation using random circuit techniques, on the 49 qubits used in distance-5 and the 4 CZ layers from the stabilizer circuit, (see Supplementary Information). Vertical lines are means.
Fig. 2
Fig. 2. Error detection in the surface code.
a, Illustration of a surface code experiment, in perspective view with time progressing to the right. We begin with an initial data qubit state that has known parities in one stabilizer basis (here, Z). We show example errors that manifest in detection pairs: a Z error (red) on a data qubit (spacelike pair), a measurement error (purple) on a measure qubit (timelike pair), an X error (blue) during the CZ gates (spacetimelike pair) and a measurement error (green) on a data qubit (detected in the final inferred Z parities). b, Detection probability for each stabilizer over a 25-cycle distance-5 experiment (50,000 repetitions). Darker lines: average over all stabilizers with the same weight. There are fewer detections at timestep t = 0 because there is no preceding syndrome extraction, and at t = 25 because the final parities are calculated from data qubit measurements directly. QEC, quantum error correction. c, Detection probability heatmap, averaging over t = 1 to 24. d,e, Similar to b,c for four separate distance-3 experiments covering the four quadrants of the distance-5 code. f,g, Similar to b,c using a simulation with Pauli errors plus leakage, crosstalk and stray interactions (Pauli+). h, Bar chart summarizing the detection correlation matrix pij, comparing the distance-5 experiment from b to the simulation in f (Pauli+) and a simpler simulation with only Pauli errors. We aggregate four groups of correlations: timelike pairs; spacelike pairs; spacetimelike pairs expected for Pauli noise; and spacetimelike pairs unexpected for Pauli noise (Unexp.), including correlations over two timesteps. Each bar shows a mean and standard deviation of correlations from a 25-cycle, 50,000-repetition dataset.
Fig. 3
Fig. 3. Logical error reduction.
a, Logical error probability pL versus cycle comparing distance-5 (blue) to distance-3 (pink: four separate quadrants, red: average), all averaged over ZL and XL. Each individual data point represents 100,000 repetitions. Solid line: fit to experimental average, t = 3 to 25 (see main text). Dotted line: comparison to Pauli+ simulation. b, Logical fidelity F = 1 − 2pL versus cycle, semilog plot. The datapoints and fits are the experimental averages and fits from a. c, Summary of experimental progression comparing logical error per cycle εd (specifically plotting 1 − εd) between distance-3 and distance-5, for which system improvements lead to faster improvement for distance-5 (see main text). Each open circle is a comparison to a specific distance-3 code, and filled circles average over several distance-3 codes measured in the same session. Markers are coloured chronologically from light to dark. Typical 1σ statistical and fit uncertainty is 0.02%, smaller than the points.
Fig. 4
Fig. 4. Towards algorithmically relevant error rates.
a, Estimated error budget for the surface code, based on component errors (see Fig. 1c) and Pauli+ simulations. Λ3/5 = ε3/ε5. CZ, contributions from CZ error (excluding leakage and stray interactions). CZ stray int., CZ error from unwanted interactions. DD, dynamical decoupling (data qubit idle error during measurement and reset). Measure, measurement and reset error. Leakage, leakage during CZs and due to heating. 1Q, single-qubit gate error. b, Logical error for repetition codes. Inset: schematic of the distance-25 repetition code, using the same data and measure qubits as the distance-5 surface code. Smaller codes are subsampled from the same distance-25 data. A high-energy event resulted in an apparent error floor around 10−6. After removing the instances nearby (light blue), error decreases more rapidly with code distance. The dataset has 50 cycles, 5 × 105 repetitions. We also plot the surface code error per cycle from Fig. 3b in black. c, Contour plot of simulated surface code logical error per cycle εd as a function of code distance d and a scale factor s on the error model in Fig. 1c (Pauli simulation, s = 1.0 corresponds to the current device error model). d, Horizontal slices from c, each for a value of error-model scale factor s. s = 1.3 is above threshold (larger codes are worse), and s = 1.2 to 1.0 represent the crossover regime, for which progressively larger codes get better until a turnaround. s = 0.9 is below threshold (larger codes are better).

References

    1. Shor PW. Scheme for reducing decoherence in quantum computer memory. Phys. Rev. A. 1995;52:R2493. - PubMed
    1. Gottesman, D. Stabilizer Codes and Quantum Error Correction. PhD thesis, California Institute of Technology (1997).
    1. Feynman, R. P. Simulating physics with computers. Int. J. Theor. Phys.21, 467–488 (1982).
    1. Shor PW. Polynomial-time algorithms for prime factorization and discrete logarithms on a quantum computer. SIAM Rev. 1999;41:303–332.
    1. Farhi E, et al. A quantum adiabatic evolution algorithm applied to random instances of an NP-complete problem. Science. 2001;292:472–475. - PubMed

Publication types