. 2023 Feb;614(7949):774-780.
doi: 10.1038/s41586-023-05696-3. Epub 2023 Feb 22.

De novo design of luciferases using deep learning

Affiliations

De novo design of luciferases using deep learning

Andy Hsien-Wei Yeh et al. Nature. 2023 Feb.

Abstract

De novo enzyme design has sought to introduce active sites and substrate-binding pockets that are predicted to catalyse a reaction of interest into geometrically compatible native scaffolds1,2, but has been limited by a lack of suitable protein structures and the complexity of native protein sequence-structure relationships. Here we describe a deep-learning-based 'family-wide hallucination' approach that generates large numbers of idealized protein structures containing diverse pocket shapes and designed sequences that encode them. We use these scaffolds to design artificial luciferases that selectively catalyse the oxidative chemiluminescence of the synthetic luciferin substrates diphenylterazine3 and 2-deoxycoelenterazine. The designed active sites position an arginine guanidinium group adjacent to an anion that develops during the reaction in a binding pocket with high shape complementarity. For both luciferin substrates, we obtain designed luciferases with high selectivity; the most active of these is a small (13.9 kDa) and thermostable (with a melting temperature higher than 95 °C) enzyme that has a catalytic efficiency on diphenylterazine (kcat/Km = 106 M-1 s-1) comparable to that of native luciferases, but a much higher substrate specificity. The creation of highly active and specific biocatalysts from scratch with broad applications in biomedicine is a key milestone for computational enzyme design, and our approach should enable generation of a wide range of luciferases and other enzymes.


Conflict of interest statement

A.H.-W.Y., C.N., Y.K., D.T., S.J.P., I.A. and D.B. are co-inventors in several provisional patent applications (application numbers 63/300171, 63/300178, 63/381922 and 63/381924 submitted by the University of Washington) covering the de novo luciferases and protein scaffolds described in this Article. A.H.-W.Y., C.N., J.Z. and D.B. are stockholders of Monod Bio, a company that aims to develop the inventions described in this manuscript. The remaining authors declare no competing interests.

Figures
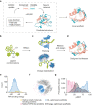
Fig. 1
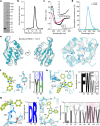
Fig. 1. Generation of idealized scaffolds and computational design of de novo luciferases.
a, Family-wide hallucination. Sequences encoding proteins with the desired topology are optimized by Markov chain Monte Carlo (MCMC) sampling with a multicomponent loss function. Structurally conserved regions (peach) are evaluated on the basis of consistency with input residue–residue distance and orientation distributions obtained from 85 experimental structures of NTF2-like proteins, whereas variable non-ideal regions (teal) are evaluated on the basis of the confidence of predicted inter-residue geometries calculated as the KL divergence between network predictions and the background distribution. The sequence-space MCMC sampling incorporates both sequence changes and insertions and deletions (see Supplementary Methods) to guide the hallucinated sequence towards encoding structures with the desired folds. Hydrogen-bonding networks are incorporated into the designed structures to increase structural specificity. bd, The design of luciferase active sites. b, Generation of luciferase substrate (DTZ) conformers. c, Generation of a Rotamer Interaction Field (RIF) to stabilize anionic DTZ and form hydrophobic packing interactions. d, Docking of the RIF into the hallucinated scaffolds, and optimization of substrate–scaffold interactions using position-specific score matrices (PSSM)-biased sequence design. e, Selection of the NTF2 topology. The RIF was docked into 4,000 native small-molecule-binding proteins, excluding proteins that bind the luciferin substrate using more than five loop residues. Most of the top hits were from the NTF2-like protein superfamily (pink dashes). Using the family-wide hallucination scaffold generation protocol, we generated 1,615 scaffolds and found that these yielded better predicted RIF binding energies than the native proteins. f,g, Our DL-optimized scaffolds sample more within the space of the native structures (f) and have stronger sequence-to-structure relationships (more confident Alphafold2 structure predictions) (g) than native or previous non-deep-learning energy-optimized scaffolds.
Fig. 2
Fig. 2. Biophysical characterization of LuxSit.
a, Coomassie-stained SDS–PAGE of purified recombinant LuxSit from E. coli (for gel source data, see Supplementary Fig. 1). b, Size-exclusion chromatography of purified LuxSit suggests monodispersed and monomeric properties. c, Far-ultraviolet CD spectra at 25 °C (black), 95 °C (red) and cooled back to 25 °C (green). Insert, CD melting curve of LuxSit at 220 nm. MRE, molar residue ellipticity. d, Luminescence emission spectra of DTZ in the presence (blue) and absence (green) of LuxSit. e, Structural alignment of the design model (blue) and AlphaFold2-predicted model (grey), which are in close agreement at both the backbone (left) and the side-chain (right) level. fi, Site-saturation mutagenesis of substrate-interacting residues. Magnified views (left) of designed (blue) and AlphaFold2 (grey) models at the side-chain level, illustrating the designed enzyme–substrate interactions of Tyr14–His98 core HBNet (f), Asp18–Arg65 dyad (g), π-stacking (h) and hydrophobic packing (i) residues. Sequence profiles (right) are scaled by the activities of different sequence variants: (activity for the indicated amino acid)/(sum of activities over all tested amino acids at the indicated position). A96M and M110V substitutions with increased activity are highlighted in pink. Source data
Fig. 3
Fig. 3. Characterization of de novo luciferase activity in vitro and in human cells.
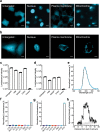
a, Substrate concentration dependence of LuxSit, LuxSit-f and LuxSit-i activity. Numbers indicate the signal-to-background (S/N) ratio at Vmax (photon s−1 molecule−1). Data are mean ± s.d. (n = 3). b, Luminescence images acquired by a BioRad Imager (top) or an Apple iPhone 8 camera (bottom). Tubes from left to right: DTZ only; DTZ plus 100 nM purified LuxSit; and DTZ plus 100 nM purified LuxSit-i, showing the high efficiency of photon production. c, Fluorescence and luminescence microscopic images of live HEK293T cells transiently expressing LuxSit-i-mTagBFP2; LuxSit-i activity can be detected at single-cell resolution. Left, fluorescence channel representing the mTagBFP2 signal. Right, total luminescence photons were collected during a course of a 10-s exposure without excitation light, immediately after adding 25 µM DTZ. Insets, negative control, untransfected cells with DTZ. Scale bars, 20 μm; 40× magnification. Source data
Fig. 4
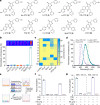
Fig. 4. High substrate specificity of de novo luciferases allows multiplexed bioassay.
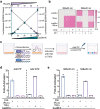
a, Chemical structures of coelenterazine substrate analogues. b, Normalized activity of LuxSit-i on selected luciferin substrates. Luminescence image (top) and signal quantification (bottom) of the indicated substrate in the presence of 100 nM LuxSit-i. LuxSit-i has high specificity for the design target substrate, DTZ. c, Heat map visualization of the substrate specificity of LuxSit-i; Renilla luciferase (RLuc); Gaussia luciferase (GLuc); engineered NLuc from Oplophorus luciferase; and the de novo luciferase (HTZ3-G4) designed for h-CTZ. The heat map shows the luminescence for each enzyme on each substrate; values are normalized on a per-enzyme basis to the highest signal for that enzyme over all substrates. d, The luminescence emission spectrum of LuxSit-i-DTZ (green) and RLuc-PP-CTZ (purple) can be spectrally resolved by 528/20 and 390/35 filters (shown in dashed bars) and only recognize the cognate substrate. e, Schematic of the multiplex luciferase assay. HEK293T cells transiently transfected with CRE-RLuc, NF-κB-LuxSit-i and CMV-CyOFP plasmids were treated with either forskolin (FSK) or human tumour necrosis factor (TNF) to induce the expression of labelled luciferases. f,g, Luminescence signals from cells can be measured under either substrate-resolved or spectrally resolved methods by a plate reader. f, For the substrate-resolved method, luminescence intensity was recorded without a filter after adding either PP-CTZ or DTZ. g, For the spectrally resolved method, both PP-CTZ and DTZ were added, and the signals were acquired using 528/20 and 390/35 filters simultaneously. In f and g, the bottom panel indicates the addition of FSK or TNF. Luminescence signals were acquired from the lysate of 15,000 cells in CelLytic M reagent, and the CyOFP fluorescence signal was used to normalize cell numbers and transfection efficiencies. All data were normalized to the corresponding non-stimulated control. Data are mean ± s.d. (n = 3). Source data
Extended Data Fig. 1
Extended Data Fig. 1. Proposed catalytic mechanism of coelenterazine-utilizing luciferases.
Density functional theory (DFT) calculation suggested that the formation of an anionic state is the essential electron source for the activation of triplet oxygen (3O2). Supported by both theoretical, and experimental evidence,, the next oxygenation process is likely through a single-electron transfer (SET) mechanism in which the surrounding reaction field could highly influence the change of Gibbs free energy (ΔGSET). Finally, the thermolysis of a dioxetane light emitter intermediate can produce photons via the mechanism of gradually reversible charge-transfer-induced luminescence (GRCTIL), which is generally exergonic. As all the historical pieces of evidence are based on calculations in the virtual solvents or chemiluminescence in ideal organic solvents, the detailed mechanism of a luciferase-catalysed luminescence reaction has remained unclear. We proposed that the key step of the enzyme is to promote the formation of an anionic state and create a suitable environment to facilitate efficient SET. Hence, the goal of this study is to design an enzyme reaction field surrounding the substrate to stabilize the anionic substrate state and alter the local proton activity, solvent polarity, and hydrophobicity for the efficient activation of 3O2.
Extended Data Fig. 2
Extended Data Fig. 2. Schematic representation of colony-based luciferase screening.
Computationally designed DNA sequences were purchased in an oligo array, where the fragments were amplified by PCR, assembled, and ligated into a pBAD bacterial expression vector. The plasmid library was used to transform DH10B cells. Each colony grown on the LB agar plate represented one luciferase design. The plates were sprayed with DTZ solution and imaged to identify active colonies using a ChemiDoc imager. Selected colonies were inoculated in 96-well plates, expressed, and purified to confirm individual luciferase activity. Plasmids can then be individually sequenced to point out active design models that provide insights into the design principle and enzyme functions or can be subjected to random mutagenesis for further evolution. Insert: three luciferases were identified from this screening. We refer to the most active and DTZ-specific luciferase as “LuxSit”.
Extended Data Fig. 3
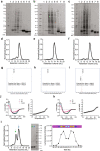
Extended Data Fig. 3. Expression, purification and structural characterization of LuxSit variants.
ac, The recombinant expression of a, LuxSit, b, LuxSit-i, and c, LuxSit-f in E. coli. Annotations for each lane are the following – 1: Pre-IPTG; 2: Post-IPTG; 3: Soluble lysate; 4: Flow-through; 5: Wash; 6: Elusion; 7: Post-TEV cleavage; 8: Post-SEC. df, Size-exclusion chromatography of the purified d, LuxSit; e, LuxSit-i; and f, LuxSit-f monomer. gi, Deconvoluted mass spectrum of g, LuxSit, h, LuxSit-i, and i, LuxSit-f. j,k, Far-ultraviolet circular dichroism (CD) spectra (Left panel) of j, LuxSit-i; and k, LuxSit-f at 25 °C (black line), 95 °C (red line) and cooled back to 25 °C (green line). CD melting curve at 220 nm (Right panel). l, Dimeric SEC peak was observed when LuxSit-i was concentrated to a high concentration (~50 μM) in Tris pH 8.0 buffer. Both dimeric and monomeric SEC fractions showed the expected size on SDS–PAGE and both peaks were catalytically active to emit luminescence in the presence of 25 μM DTZ.
Extended Data Fig. 4
Extended Data Fig. 4. Expression, purification and activity measurement of selected de-novo-designed luciferases for h-CTZ.
a, Coomassie-stained SDS–PAGE of HTZ3-D2 and HTZ3-G4 purified from recombinant expression in E. coli. b, Magnified views of HTZ3-D2 (left panel) and HTZ3-G4 (right panel) illustrated the side-chain preorganization of luciferase-h-CTZ interactions. c,d, Size-exclusion chromatography (left), deconvoluted mass spectrum (middle), and the normalized luciferase activities on selected compounds (right) of c, HTZ3-D2 and d, HTZ3-G4, which suggested high specificity for the design target substrate, h-CTZ. e, Substrate concentration dependence of LuxSit (w/ DTZ), HTZ3-D2 (w/ h-CTZ), and HTZ3-G4 (w/ h-CTZ) activity in PBS. All data points were fitted to the Michaelis-Menten equation. HTZ3-D2 and HTZ3-G4 showed Km values of 7.9 and 19.5 μM with ~25% and ~58% Imax of LuxSit, respectively. Data are presented as mean ± s.d. (n = 3).
Extended Data Fig. 5
Extended Data Fig. 5. Predicted changes in substrate-binding free energy from binding-site mutations.
The calculated ddGbind of each mutation was plotted as a function of the relative average experimental luciferase activity. The ddGbind of hypothetical catalytic residues: a, Tyr14–His98 and b, Asp18–Arg65 dyads were generally not the lowest, which suggested that these designed catalytic residues are not favourable for substrate binding. Red dots represent the wild-type (LuxSit) amino acids. The rank of wild-type ddGbind for each position screened for activity is shown with a heat map in c. df, The wild-type ddGbind of the residues designed for d,e, π–π stacking or f, hydrophobic interactions were the lowest compared to the mutation ddGbind values. This shows that the sequence is near-optimal for substrate binding and the design model is reliable.
Extended Data Fig. 6
Extended Data Fig. 6. Screening of a randomized NNK library at 60, 96 and 110 positions and sequence alignment between LuxSit and its variants.
We generated a fully randomized library at 60, 96, and 110 positions to screen all possible combinations exhaustively. After the colony-based screening, we identified many colonies with strong luciferase activities with DTZ. Each colony was expressed individually in each well of 96-well plates (1 mL culture) and purified accordingly (see Supplementary Methods). a, Individual luminescence activity of each selected mutant was plotted and compared to the parent, LuxSit. Luminescence activities were measured in the presence of 25 μM DTZ. Luminescence activity (RLU) was shown as the integrated signal over the first 15 min. Statistical analysis of the amino acid frequency versus the luciferase activity at residue b, 60, c, 96, and d, 110. Data are presented as mean ± s.d. (n varies across each bar as the mutants were selected from a randomized library). Arg60 is confirmed to be mutable among all selected mutants as Arg60 may be structurally less well-defined because it emanates from a loop and has no hydrogen-bonding partner. Ala96 prefers larger side-chain substitutions (Leu, Ile, Met, and Cys), and Met110 favours hydrophobic residues (Val, Ile, and Ala). A newly discovered variant (R60S/A96L/M110V) with more than 100-fold higher photon flux over LuxSit was assigned LuxSit-i for its high brightness. In the sequence alignment, mutations are highlighted in yellow fonts and grey backgrounds. The conserved catalytic dyads of Asp18–Arg65 and Tyr14–His98 are in green and blue fonts.
Extended Data Fig. 7
Extended Data Fig. 7. Additional characterization of LuxSit variants.
a, Normalized emission kinetics of 15,000 intact HeLa cells expressing LuxSit-i (red), 100 nM purified LuxSit-i (green), or 100 nM purified LuxSit-f (blue) in the presence of 50 μM DTZ. The more extended emission kinetics in HeLa cells is likely due to the diffusion rate of DTZ across cell membranes. b, Normalized luminescence decay curves of LuxSit-i in various pH buffers revealed a pH-dependent catalytic mechanism. c, Luminescent quantum yield was estimated from the integrated luminescence signal until completely converting 125 pmol substrates to photons in the presence of 50 nM corresponding luciferase (see Supplementary Methods). Data are presented as mean (n = 3).
Extended Data Fig. 8
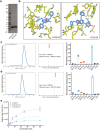
Extended Data Fig. 8. Free-energy profile of DTZ chemiluminescence and MD simulations of proposed protein–intermediate complexes.
a, The free-energy profile calculated by density functional theory (DFT) shows triplet oxygen can react directly with the anionic species of DTZ (Int1) through the reactant complex Int2 and TS1. The dioxetane intermediate Int3 then cleaves in an open shell singlet transition state OSSTS2 to form excited intermediate Int4*, which rapidly extrudes CO2 and forms the emissive product Int5. Note: either Int4* or Int5* emit in the observed region, but the lifetime of Int4* is very short and likely completely converts to Int5* before emission. b, Int2 and Int3 were docked into both LuxSit and LuxSit-i and the bindings were evaluated by molecular dynamics (MD). The distances between His98 to O1 (top row) and Arg65 to N1 (bottom row) of the substrate were plotted throughout 500 ns MD simulations. LuxSit-i (blue trace) binds Int2′ (middle) considerably better than LuxSit does (red trace), suggesting that the mutations of LuxSit-i provide a binding pocket more complimentary to TS1. This binding orientation brings N1 of the substrate much closer to Arg65, providing better charge stabilization for the high energy transition state. c, Docking of the peroxide anion form of bis-CTZ into the pocket of LuxSit-i; blue overlay represents DTZ in the original design model. During MD simulation, the added benzylic carbon of bis-CTZ (green trace) disrupts the shape complementarity between LuxSit-i and the transition states (TS1 and TS2), reducing the charge stabilization by Arg65. This charge stabilization is necessary for the reaction to proceed, explaining the high substrate specificity of LuxSit-i for DTZ over bis-CTZ.
Extended Data Fig. 9
Extended Data Fig. 9. Expression, localization and luminescence activity of LuxSit-i in live HEK293T and HeLa cells.
a,b, Fluorescence imaging of live a, HEK293T and b, HeLa cells expressing LuxSit-i-mTagBFP2, which is untargeted or localized to the nucleus (Histone2B), plasma membrane (KRasCAAX), or mitochondria (DAKAP) cellular compartments. Scale bar: 10 μm. c,d, Luminescence signals were measured with 15,000 intact c, HEK293T or d, HeLa cells in the presence of 25 μM DTZ in DPBS. Transfection efficiencies range from 60-70% for HEK293T cells and 5-10% for HeLa cells. e, Luminescence emission spectra acquired from LuxSit-i expressing HEK293T cells is consistent with the emission spectra of recombinant LuxSit-i purified from E. coli. f,g, Luminescence signals were measured with 15,000 f, intact LuxSit-i expressing HEK293T cells or g, cell lysate in the presence of 25 μM indicated substrate in DPBS. Luminescence intensities were normalized to DTZ signal, showing high DTZ specificity over other substrates in cell-based assays. Data were shown as total luminescence signal over the first 20 min ± s.d. (n = 3). h, Normalized luminescence intensity profile of lines traversing across different cells (n = 10) of main Fig. 3c luminescence image; grey lines represent untransfected cells. Error bars represent ± SEM.
Extended Data Fig. 10
Extended Data Fig. 10. Substrate specificity of LuxSit-i and spectrally resolved luciferase–luciferin pairs allow multiplexed bioassay.
a, The orthogonality relationship between LuxSit-i-DTZ and RLuc-PP-CTZ (Prolume Purple, methoxy e-Coelenterazine) luminescent pairs. Indicated percentages of each luciferase were mixed at different ratios totalling 100%. After the addition of both 25 µM DTZ and PP-CTZ substrates, filtered light from 528/20 and 390/35 channels were measured simultaneously. b, Heat map shows the luminescence signal for individual luciferase (100 nM) or 1:1 mixture in the presence of the cognate or non-cognate (DTZ or PP-CTZ or both) substrates. Response signals were acquired by a Neo2 plate reader with 528/20 and 390/35 nm filters simultaneously. c, Multiplex luciferase assay in live HEK293T after co-transfection of CRE-RLuc, NFκB-LuxSit-i, and CMV-CyOFP plasmids and stimulation by Forskolin (FSK) or human TNF. d,e, 15,000 intact cells were assayed (see Supplementary Methods) by either d, substrate-resolved or e, spectrally resolved modes after adding DTZ, PP-CTZ, or both DTZ and PP-CTZ in DPBS without cell lysis. Area scanning of the CyOFP fluorescence signal was used to estimate cell numbers and transfection efficiency. The reported unit was RLU/a.u.; relative light units/fluorescence intensity measurements at Ex./Em. = 480/580 nm. All data were normalized to the corresponding non-stimulated control. Data are presented as mean ± s.d. (n = 3).

Comment in

References

    1. Jiang L, et al. De novo computational design of retro-aldol enzymes. Science. 2008;319:1387–1391. doi: 10.1126/science.1152692. - DOI - PMC - PubMed
    1. Rothlisberger D, et al. Kemp elimination catalysts by computational enzyme design. Nature. 2008;453:190–195. doi: 10.1038/nature06879. - DOI - PubMed
    1. Yeh HW, et al. Red-shifted luciferase–luciferin pairs for enhanced bioluminescence imaging. Nat. Methods. 2017;14:971–974. doi: 10.1038/nmeth.4400. - DOI - PMC - PubMed
    1. Love AC, Prescher JA. Seeing (and using) the light: recent developments in bioluminescence technology. Cell Chem. Biol. 2020;27:904–920. doi: 10.1016/j.chembiol.2020.07.022. - DOI - PMC - PubMed
    1. Syed AJ, Anderson JC. Applications of bioluminescence in biotechnology and beyond. Chem. Soc. Rev. 2021;50:5668–5705. doi: 10.1039/D0CS01492C. - DOI - PubMed

Publication types