. 2023 Mar;615(7950):168-174.
doi: 10.1038/s41586-023-05728-y. Epub 2023 Feb 22.

Microbiota-derived 3-IAA influences chemotherapy efficacy in pancreatic cancer

Affiliations

Microbiota-derived 3-IAA influences chemotherapy efficacy in pancreatic cancer

Joseph Tintelnot et al. Nature. 2023 Mar.

Erratum in

  • Author Correction: Microbiota-derived 3-IAA influences chemotherapy efficacy in pancreatic cancer.
    Tintelnot J, Xu Y, Lesker TR, Schönlein M, Konczalla L, Giannou AD, Pelczar P, Kylies D, Puelles VG, Bielecka AA, Peschka M, Cortesi F, Riecken K, Jung M, Amend L, Bröring TS, Trajkovic-Arsic M, Siveke JT, Renné T, Zhang D, Boeck S, Strowig T, Uzunoglu FG, Güngör C, Stein A, Izbicki JR, Bokemeyer C, Sinn M, Kimmelman AC, Huber S, Gagliani N. Tintelnot J, et al. Nature. 2025 May;641(8065):E12-E13. doi: 10.1038/s41586-025-08979-z. Nature. 2025. PMID: 40360841 Free PMC article. No abstract available.

Abstract

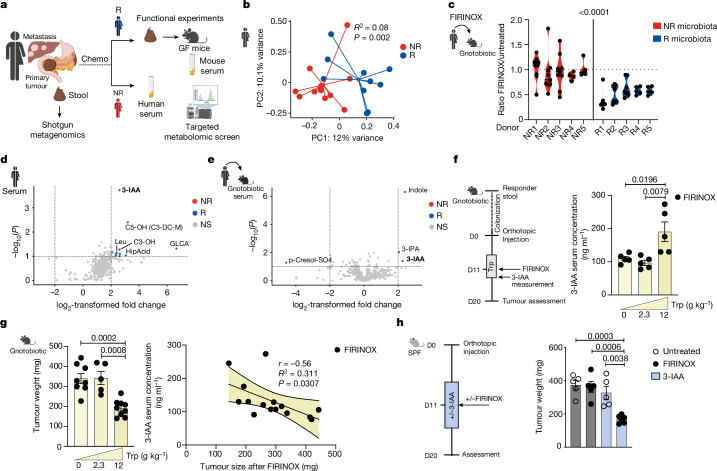
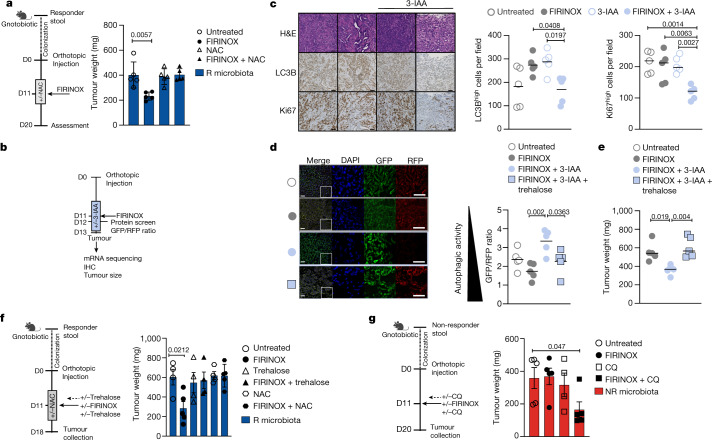
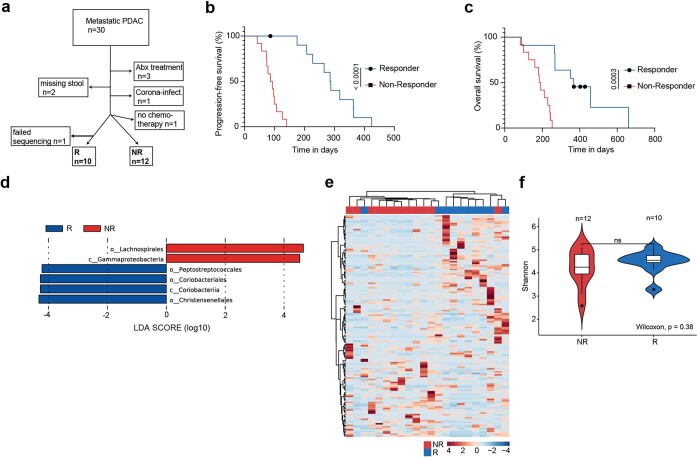
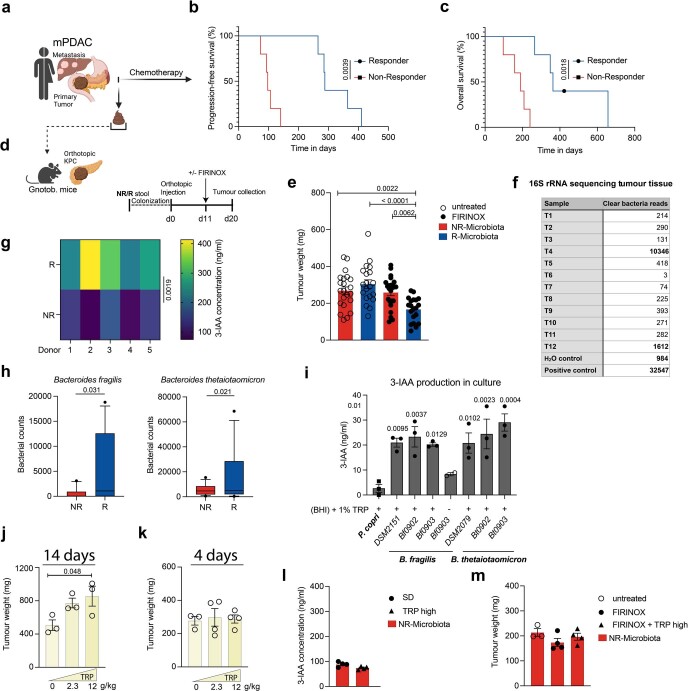
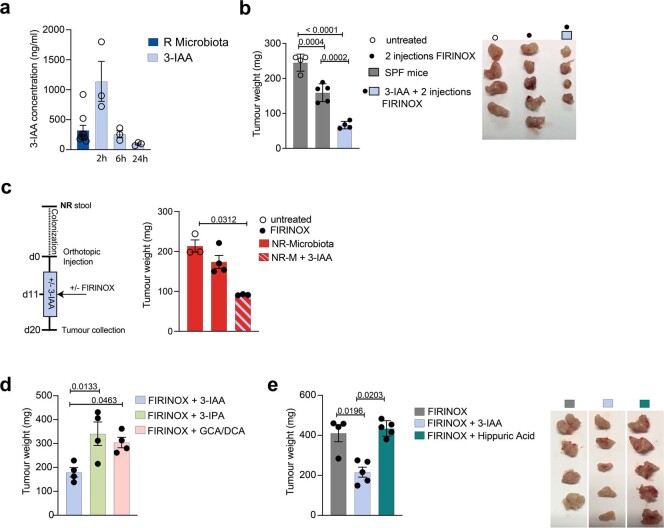
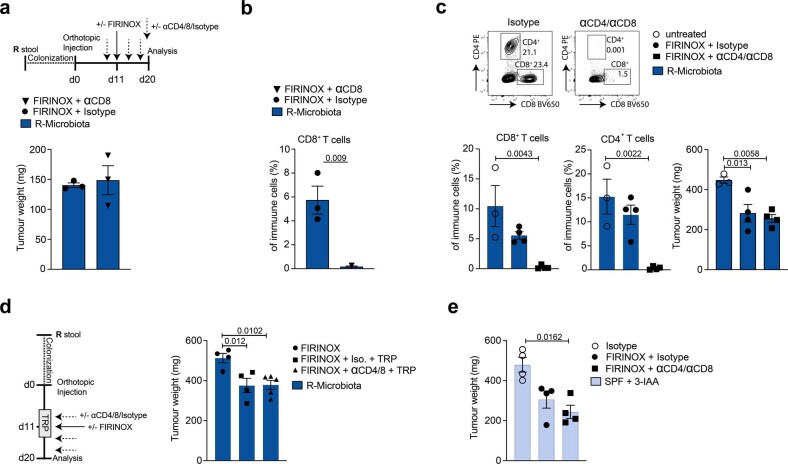
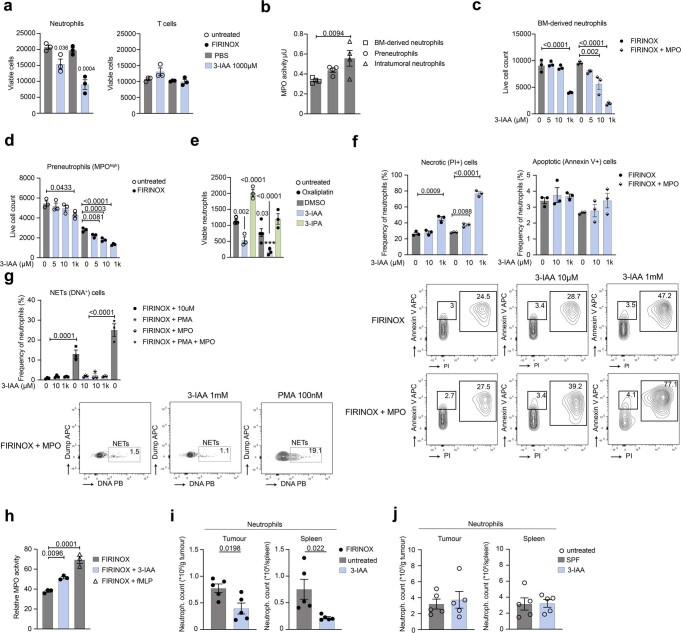
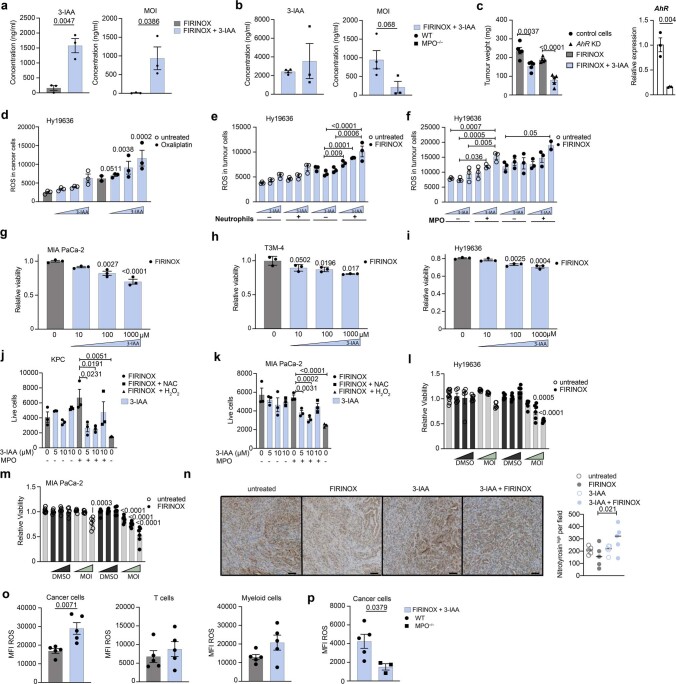
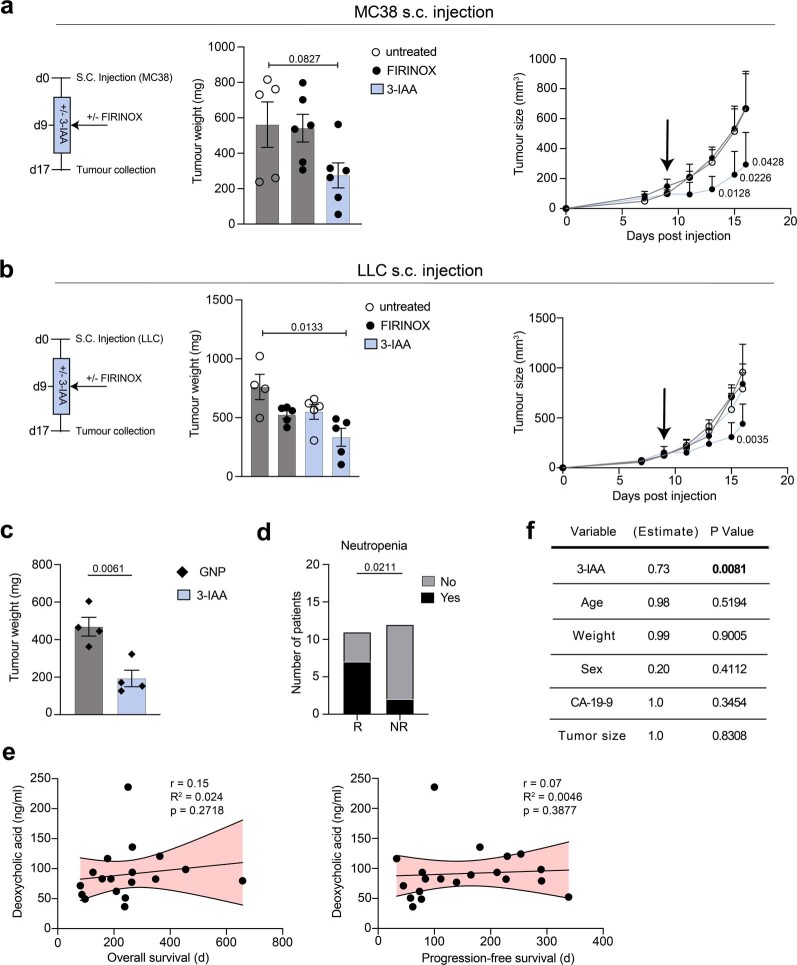
Pancreatic ductal adenocarcinoma (PDAC) is expected to be the second most deadly cancer by 2040, owing to the high incidence of metastatic disease and limited responses to treatment1,2. Less than half of all patients respond to the primary treatment for PDAC, chemotherapy3,4, and genetic alterations alone cannot explain this5. Diet is an environmental factor that can influence the response to therapies, but its role in PDAC is unclear. Here, using shotgun metagenomic sequencing and metabolomic screening, we show that the microbiota-derived tryptophan metabolite indole-3-acetic acid (3-IAA) is enriched in patients who respond to treatment. Faecal microbiota transplantation, short-term dietary manipulation of tryptophan and oral 3-IAA administration increase the efficacy of chemotherapy in humanized gnotobiotic mouse models of PDAC. Using a combination of loss- and gain-of-function experiments, we show that the efficacy of 3-IAA and chemotherapy is licensed by neutrophil-derived myeloperoxidase. Myeloperoxidase oxidizes 3-IAA, which in combination with chemotherapy induces a downregulation of the reactive oxygen species (ROS)-degrading enzymes glutathione peroxidase 3 and glutathione peroxidase 7. All of this results in the accumulation of ROS and the downregulation of autophagy in cancer cells, which compromises their metabolic fitness and, ultimately, their proliferation. In humans, we observed a significant correlation between the levels of 3-IAA and the efficacy of therapy in two independent PDAC cohorts. In summary, we identify a microbiota-derived metabolite that has clinical implications in the treatment of PDAC, and provide a motivation for considering nutritional interventions during the treatment of patients with cancer.


Conflict of interest statement

D.Z. received travel support from AstraZeneca and AMGEN, honoraria from AstraZeneca and Roche. S.B. reports honoraria from AstraZeneca, BMS, Celgene, Incyte, Janssen Cilag, MSD and Servier for scientific presentations and paid consulting, as well as research support from Celgene. J.T.S. receives honoraria as consultant or for continuing medical education presentations from AstraZeneca, Bayer, Boehringer Ingelheim, Bristol-Myers Squibb, Immunocore, MSD Sharp Dohme, Novartis, Roche/Genentech, and Servier. His institution receives research funding from Abalos Therapeutics, Boehringer Ingelheim, Bristol-Myers Squibb, Celgene, Eisbach Bio, and Roche/Genentech; he holds ownership and serves on the Board of Directors of Pharma15. C.B. reports personal fees from Sanofi Aventis, Merck KgA, Bristol-Myers Squibb, Merck Sharp & Dohme, Lilly Imclone, Bayer Healthcare, GSO Contract Research, AOK Rheinland-Hamburg and Novartis. M. Sinn received honoraria from AstraZeneca, Amgen, BMS, MSD, Incyte, Pierre Fabre, Pfizer Servier and Sanofi and support for clinical research (institutional) from Amgen, AstraZeneca, Bayer, BMS, Incyte, MSD, Pierre Fabre, Roche and Servier. N.G. reports financial support from Roche. All of these are outside the submitted work. A.C.K. has financial interests in Vescor Therapeutics, OncoRev and is an inventor on patents pertaining to KRAS-regulated metabolic pathways and redox control pathways in pancreatic cancer, targeting GOT1 as a therapeutic approach, targeting alanine transport, and the autophagic control of iron metabolism. A.C.K. is on the scientific advisory board of Rafael/Cornerstone Pharmaceuticals and has been a consultant for Deciphera and Abbvie. The remaining authors declare no competing interests.

Figures

Fig. 1
Fig. 1. 3-IAA induces a response to FIRINOX in mouse models of PDAC.
a, The intestinal microbiota of 23 patients with mPDAC was sequenced before the start of chemotherapy (chemo). GF, germ-free. b, Principal coordinate analysis (PCoA), with Bray–Curtis dissimilarity matrix, of pre-treatment NR (n = 12) and R (n = 10; one patient was excluded after the quality control) microbiota. c, Gnotobiotic mice were colonized with five different R or NR microbiota, KPC cancer cells were orthotopically injected and mice were treated with FIRINOX or left untreated. Tumour weight is shown relative to the mean tumour weight of the untreated group of each experiment at day 20 after tumour cell injection (n = 9 NR1–3; n = 8 R2; n = 7 R1 and R3; n = 5 NR5, R4 and R5; n = 4 NR4; pooled from nine independent experiments). d,e, Volcano plots showing differentially abundant metabolites in the serum of three R and NR patients (d) and in the serum of gnotobiotic mice colonized with R or NR microbiota (n = 3 each, biological replicates) (e). NS, non-specified. f, R-microbiota-colonized gnotobiotic mice were fed with the indicated concentration of tryptophan, and the 3-IAA serum concentration at the fourth day of dietary intervention is shown (n = 5 each). g, Left, tumour weight of orthotopic KPC tumours (n = 8, 5 or 9) after FIRINOX treatment. Right, correlation between 3-IAA serum concentration and tumour weight of five randomly selected mice per dietary group from f (n = 15). h, SPF mice were orthotopically injected with KPC cells and treated with or without (+/−) 3-IAA and/or with or without FIRINOX, and tumour weight was assessed at day 20 of the experiment (n = 5 or 6). Each symbol represents one mouse. One out of two (f,g) or three (h) independent experiments is shown. Error bars indicate s.e.m. Significant P values are indicated and were determined by MANOVA (b), two-tailed nested t-test (c), fold change analysis and two-tailed t-test (d,e), simple linear regression and Pearson’s r (g) and one-way ANOVA with Tukey’s post-hoc test (fh). Source data
Fig. 2
Fig. 2. The efficacy of 3-IAA and FIRINOX is licensed by MPO.
a, SPF mice were orthotopically injected with KPC cells and treated with FIRINOX with or without 3-IAA, and tumours were analysed at day three after FIRINOX treatment (n = 8 each). Immune subsets of orthotopic tumours or respective spleens were determined by flow cytometry. CD8+ T cells (CD3+CD8+); CD4+ T cells (CD3+CD4); macrophages (CD11b+F4/80+); neutrophils (CD11b+Ly6G+) are shown as relative to total living immune cells (CD45+). b, Tumour weight and counts of immune subsets of orthotopic KPC tumours or respective spleens of irradiated and wild-type (WT; n = 4) or Mpo–/– (n = 5 or 6) bone-marrow (BM)-reconstituted mice treated and analysed as in a. c, Irradiated and wild-type, Mpo–/– or Ahr–/– bone-marrow-reconstituted mice received KPC cells orthotopically and were treated with FIRINOX or FIRINOX + 3-IAA for five days (n = 5 each). All mice received a four-day dietary intervention with a high-tryptophan diet. Tumour weight was assessed at day seven after FIRINOX treatment. Each symbol represents one mouse. Two independent experiments were pooled (a) or one out of two independent experiments (b,c) is shown. Error bars indicate s.e.m. Significant P values are indicated and were determined by two-tailed Mann–Whitney test (a) or two-tailed t-test (b,c). Source data
Fig. 3
Fig. 3. Treatment with 3-IAA and FIRINOX results in reduced autophagic activity.
a, Gnotobiotic mice were colonized with R microbiota and KPC cells were orthotopically injected. Mice were untreated or treated with FIRINOX, NAC (day 9–13) or FIRINOX + NAC (n = 5 each). Tumour weight at day 20 of the experiment is shown. b, SPF mice bearing orthotopic KPC tumours were substituted +/− 3-IAA, treated with FIRINOX and analysed as indicated. IHC, immunohistochemistry. c, Representative images of orthotopic tumours stained with haematoxylin and eosin (H&E), LC3B or Ki67 (left) and respective statistics for positive cells per field (n = 5 each) (right). Scale bars, 50 μm. d,e, The GFP-LC3B-RFP reporter cell line Hy19636_GLRM was injected into SPF mice and mice were treated as indicated (n = 5 each). The graphs show the GFP/RFP ratio at day one (d) and tumour weight at day three (e) after FIRINOX treatment. Representative merged immunofluorescence images or indicated areas with a magnification of 3× are shown; scale bars, 10 μm. f, KPC cancer cells were orthotopically injected into R-microbiota-colonized mice and the indicated treatment was applied as shown in the scheme (n = 4 or 5). Tumour weight is shown at day 18 of the experiment. g, Tumour weight of orthotopic KPC tumours from gnotobiotic mice colonized with NR microbiota is shown nine days after the indicated treatment (n = 4 or 5). CQ, hydroxychloroquine. One experiment (c) or one out of two independent experiments (a,d,eg) is shown. Each symbol represents one mouse. Error bars indicate s.e.m. Significant P values are indicated and were determined by one-way ANOVA followed by Dunnett’s (a,c,f) or Tukey’s (d,e) post-hoc test or Kruskal–Wallis test followed by Dunn’s post-hoc test (g). Source data
Fig. 4
Fig. 4. 3-IAA is clinically relevant in PDAC.
a, SPF mice were orthotopically injected with Hy19636 cells, treated as indicated and their overall survival is depicted in the Kaplan-Meier estimator (untreated n = 12; FIRINOX n = 14; 3-IAA n = 9; 3-IAA + FIRINOX n = 10). bd, The 3-IAA serum concentration of patients from the Hamburg cohort was measured by chemiluminescence immune assay (CLIA) and correlated with the ratio of blood neutrophil (b), lymphocyte (c) or monocyte (d) counts at the time point of lowest overall leukocyte count (within the first three months of chemotherapy) and counts before start of chemotherapy. e, Tumour size as measured in CT scans was correlated with PFS in patients from the Hamburg cohort. f,g, 3-IAA serum concentration after two to three chemotherapy cycles of patients from the Hamburg cohort was correlated with PFS (f) or overall survival (g). One patient was excluded from f, because the patient’s cancer did not progress before the event of death. Patients represented with open circles are still alive and therefore excluded from the correlative analysis in g. h,i, The 3-IAA serum concentration before the start of treatment of patients from the Munich cohort was correlated with PFS (h) or overall survival (i). Each symbol represents one patient. Two independent experiments were pooled (a). Mean and 95% confidence intervals. P values are indicated and were determined by log-rank Mantel–Cox test (a) or simple linear regression and Pearson’s r (bi). Source data
Extended Data Fig. 1
Extended Data Fig. 1. Survival and microbiota analysis of R and NR patients with mPDAC from the Hamburg cohort.
a, 30 patients were recruited to the study. b,c, After exclusion of non-eligible patients as indicated, 23 patients could be analysed for PFS (b) and overall survival (OS) (c). PFS and OS are presented separately for responder (R, n = 11, blue) and non-responder (NR, n = 12, red) patients. df, After exclusion of one sample due to sample collection errors that led to sequencing failure, the microbiota of 22 patients was analysed. d, Microbiota LEfSe analysis showing linear discriminant analysis (LDA) score of bacterial taxa enriched in R or NR patients, respectively. e, Genus heat map with Ward clustering of patients. f, Microbiota diversity compared using Shannon index. Boxes indicate 25 to 75% of values (f) and error bars indicate median, significant p-values are indicated and were determined by Gehan–Breslow–Wilcoxon test (b,c) or two-tailed Wilcoxon test (f). Source data
Extended Data Fig. 2
Extended Data Fig. 2. R microbiota induces a response to FIRINOX treatment.
a, Microbiota of five R and NR patients with mPDAC was collected and transferred to gnotobiotic mice. Nine patients were treated with FIRINOX and one with GnP. PFS (b) and OS (c) of patients used for microbiota transfer experiments is depicted in Kaplan-Meier estimators. In four individual experiments with varying donors, one group of mice was colonized with R microbiota and one group was colonized with NR microbiota. After stool transfer, gnotobiotic mice (d) received orthotopic injections of KPC tumour cells and were either left untreated (n = 22 (NR) or 20 (R)) or treated once with FIRINOX (n = 23 (NR) or 20 (R)) at day eleven of the experiment. e, Tumour weight of orthotopic tumours is depicted for the respective experimental group at day 20 of the experiment. f, Randomly selected tumours from varying experiments of e were analysed for intratumoral bacteria using 16S rRNA sequencing (n = 12). Table shows indicated clean reads for different tumours (T1–12), H2O or positive control. g, 3-IAA was analysed in the serum of n = 3 to 5 randomly selected mice per experiment with different donors each. h, Metagenomic sequencing data was analysed for the abundance of a panel of 3-IAA-producing bacteria. Increased abundance of B. fragilis and B. thetaiotaomicron was detected in stool samples from NR or R patients during and before chemotherapy treatment, which were used for experiments in gnotobiotic mice (5 donors per group and 1–3 samples per patient, n = 12 per group). i, 3-IAA was quantified in supernatants of bacteria lacking (Prevotella copri) and having the ability (B. thetaiotaomicron and B. fragilis) to produce 3-IAA based on genomic predictions. The characterized strains included P. copri (DSM18205), B. fragilis (BF DSM2151, Bf0903, Bf0902) and B. thetaiotaomicron (DSM, Bt0903, Bt0902). Strains were all cultured in BHI containing 1% tryptophan, the strain Bf0903 was also cultured in BHI alone (n = 3 biological replicates). j, SPF mice were orthotopically injected with KPC cells. Mice were either supplemented with tryptophan-free, standard diet (2.3 g/kg TRP) or tryptophan-high diet (12 g/kg TRP) starting 7 days after tumour cell injection for a total of 14 days (n = 3). k, As in j, except dietary intervention was applied for a total of 4 days before standard diet was reintroduced. Tumour weight was assessed 9 days after dietary intervention (n = 3 or 4). l, NR microbiota-colonized mice (red) were fed either standard diet (SD) or tryptophan-high diet for 4 days (TRP high). Blood was drawn at day 4 of intervention and 3-IAA was measured in the serum using 3-IAA CLIA (n = 4). m, Tumour sizes of mice from l at day nine after treatment with FIRINOX are shown (n = 3 or 4). Each symbol represents one mouse, human or in vitro replicate. One experiment was performed (f,im) or four (e,g) independent experiments were pooled. Error bars indicate SEM, whiskers indicate 10% and 90% (h), significant p-values are indicated and were determined by Gehan-Breslow-Wilcoxon test (b,c), one-way ANOVA followed by Tukey’s (e,m) or Dunnett’s (ik) post-hoc test, two-way ANOVA (g), two-tailed Wilcoxon paired-ranks test (h) or two-tailed t-test (l). Source data
Extended Data Fig. 3
Extended Data Fig. 3. 3-IAA induces a response to FIRINOX in mouse models of PDAC.
a, 3-IAA serum concentration of SPF mice gavaged with 500 mg/kg 3-IAA was measured using CLIA at 2, 6 and 24 h after 3-IAA application (n = 3 mice). Unrelated serum concentration of R-microbiota-colonized gnotobiotic mice is shown as a control. b, SPF mice were orthotopically injected with KPC cells and received two treatments of FIRINOX or FIRINOX + 3-IAA (n = 5). Tumour weight at day 20 of the experiment is depicted in the statistic. c, NR-colonized gnotobiotic mice were injected with KPC tumour cells orthotopically. 9 days later, mice were substituted +/− 3-IAA for five days (d9–13) and treated +/− FIRINOX as depicted in the experimental scheme (n = 3 or 4). Tumour weight is shown at day 20 of the experiment. d, SPF mice were orthotopically injected with KPC tumour cells. At day 9 after tumour cell injection, mice were treated with either 500 mg/kg 3-IAA, 3-IPA or 250 mg/kg GCA and 250 mg/kg DCA for five consecutive days (n = 4). FIRINOX treatment was applied at day 11. Tumour weight is shown at day 20 of the experiment. e, As in d, except mice were treated with FIRINOX, FIRINOX + 3-IAA (500 mg/kg) or FIRINOX + hippuric acid (500 mg/kg) (n = 4 or 5). Each symbol represents one mouse. One experiment (e) or one out of two independent experiments is shown (ad). Error bars indicate SEM, significant p-values are indicated and were determined by Kruskal–Wallis test followed by Dunn’s post-hoc test (a,c,e), or one-way ANOVA followed by Tukey’s (b) or Dunnett’s (d) post-hoc test. Source data
Extended Data Fig. 4
Extended Data Fig. 4. Tumour-infiltrating immune cells of KPC tumours from gnotobiotic mice.
a, Flow cytometric gating strategy to classify immune subsets (left panel) or intracellular cytokines and coinhibitory receptors (right panel). Immune subsets were determined using the following marker combinations on live CD45+ immune cells: CD8+ T cells (CD11bCD3+CD8+); CD4+ T cells (CD11bCD3+CD4+); neutrophils (CD11b+Ly6G+); and macrophages (CD11b+Ly6GF4/80+). b, Immune subsets or cytokine profiles and PD-1 expression of immune cells from orthotopic tumours obtained from gnotobiotic mice colonized with R or NR microbiota was analysed at day 20 of the experiment. Each symbol represents one mouse. Three to five independent experiments were pooled (n = 11 to 23 in total). Error bars indicate SEM, significant p-values are indicated and were determined by two-tailed t-test. Source data
Extended Data Fig. 5
Extended Data Fig. 5. CD4+ and CD8+ T cells are dispensable for the efficacy of 3-IAA and FIRINOX.
R-microbiota-colonized gnotobiotic mice were injected with KPC tumour cells orthotopically. Before treatment with FIRINOX, mice were injected with either isotype control antibody or CD8-depleting antibody every third day, as indicated. The tumour weight (a) and the depletion efficacy of intratumoral CD8+ T cells (b) as relative to total immune cells (CD45+), determined by flow cytometry, is shown at day 20 of the experiment (n = 3). c, As in a, except that CD4+ and CD8+ T cells were depleted simultaneously (n = 3 or 4). d, R-microbiota-colonized gnotobiotic mice with orthotopic KPC tumours were treated with FIRINOX, FIRINOX + tryptophan-high diet (d8–12) + isotype control antibody or FIRINOX + tryptophan-high diet (d8–12) + CD4/CD8-depleting antibody (n = 4 or 5). Tumour weight at day 20 of the experiment is depicted. e, As in c, except that SPF mice were treated with 3-IAA +/− FIRINOX and CD4/CD8-depleting or isotype control antibody (n = 4). Tumour weight is depicted at day 20 of the experiment. Each symbol represents one mouse. One experiment each was performed. Error bars indicate SEM, significant p-values are indicated and were determined by two-tailed t-test (a,b), one-way ANOVA followed by Dunnett’s (c,d) post-hoc test or Kruskal–Wallis test followed by Dunn’s post-hoc test (e). Source data
Extended Data Fig. 6
Extended Data Fig. 6. 3-IAA and chemotherapy induce cell death in neutrophils.
a, FACS-sorted T cells or neutrophils were cultured for 24 h +/− 1,000 μM 3-IAA and +/− FIRINOX (3.2 μM Oxaliplatin, 5.6 μM Irinotecan and 19.2 μM 5-FU). Viability was assessed via flow cytometry (n = 3, biological replicates). b, MPO activity was determined in 50,000 FACS-sorted bone-marrow-derived neutrophils, neutrophil precursors (lineage-negative, CD115, Ly6B+, Ly6Gint-low) from the bone marrow or PDAC-infiltrating neutrophils using a fluorometric MPO activity assay kit (n = 4, biological replicates). c, FACS-sorted bone-marrow-derived neutrophils were cultured in the presence of increasing dosages of 3-IAA +/− MPO +/− FIRINOX (3.2 μM Oxaliplatin, 5.6 μM Irinotecan and 19.2 μM 5-FU; n = 3, biological replicates). Cell numbers were quantified using flow cytometry after 48 h of culture. d, FACS-sorted neutrophil precursors were cultured in the presence of increasing dosages of 3-IAA +/− FIRINOX (3.2 μM Oxaliplatin, 5.6 μM Irinotecan and 19.2 μM 5-FU; n = 3, biological replicates). Cell numbers were quantified using flow cytometry after 48 h of culture. e, As in a, except only neutrophils were cultured in the presence of +/− Oxaliplatin (8 μM Oxaliplatin) and 1,000 μM 3-IAA, 1,000 μM 3-IPA or DMSO at similar concentrations (n = 3 to 6, biological replicates). f, As in c, except cell death of neutrophils was defined by flow cytometry using Annexin V and PI staining. Frequencies are shown relative to total neutrophils (n = 3, biological replicates). g, As in c, except NET formation was defined by SYTOX DNA staining after three hours of treatment (n = 3, biological replicates). h, Degranulation of 1 × 106 FACS-sorted bone-marrow-derived neutrophils was measured after 30 min of stimulation with FIRINOX (3.2 μM Oxaliplatin, 5.6 μM Irinotecan and 19.2 μM 5-FU), 1 mM 3-IAA + FIRINOX or FIRINOX + 1 μM fMLP using an MPO activity assay kit (n = 3, biological replicates). i, KPC tumour cells were orthotopically injected into SPF mice and mice were treated +/− 500 mg/kg 3-IAA for 5 consecutive days and FIRINOX at day 11 (n = 5 each). Immune cells from the spleen and tumour were analysed by flow cytometry at day 3 after FIRINOX treatment. Neutrophil counts in the spleen or tumour are shown. j, As in i, except only 3-IAA, but no FIRINOX was applied (n = 5 each). Each symbol represents one mouse or one in vitro replicate. One experiment (b) or one out of three (c,d) or two (a,ej) independent experiments are shown. Error bars indicate SEM, significant p-values are indicated and were determined by one-way ANOVA followed by Dunnett’s (ah) post-hoc test or two-tailed t-test (i,j). Source data
Extended Data Fig. 7
Extended Data Fig. 7. 3-IAA and MPO increase ROS and decrease cell viability.
a, Concentrations of 3-IAA measured using LC–MS/MS (left) or MOI (right) of tumours isolated from SPF mice treated with FIRINOX +/− 3-IAA five hours after treatment (n = 3 biological replicates). b, Concentrations of 3-IAA (left) or MOI (right) were measured in tumours isolated from WT or Mpo–/– bone-marrow-reconstituted mice treated with FIRINOX + 3-IAA using LC–MS/MS five hours after treatment (n = 3 or 4 biological replicates). c, SPF mice received KPC control or Ahr KD cells orthotopically and were treated with FIRINOX (d11) or FIRINOX + 3-IAA (d9–13) (n = 4 or 5). Tumour weight was assessed at day 20 of the experiment. d, KPC tumour cells were cultured in the presence of increasing dosages of 3-IAA +/− Oxaliplatin (8 μM Oxaliplatin; n = 2-3 biological replicates). ROS expression was determined via flow cytometry using CellROX dye. Hy19636 cells were cultured with increasing dosages of 3-IAA +/− 5 × 104 neutrophils (e) or MPO 200mU/ml (f) and +/− FIRINOX (1.6 μM Oxaliplatin, 2.8 μM Irinotecan and 9.6 μM 5-FU; n = 2-3 biological replicates). ROS expression was assessed via flow cytometry. Only p-values for relevant groups are shown for clarity. MIA PaCa-2 (g), T3M-4 (h) or Hy19636 (i) cells were cultured with increasing dosages of 3-IAA +/− FIRINOX (3.2 μM Oxaliplatin, 5.6 μM Irinotecan and 19.2 μM 5-FU) for 6 h (n = 3 biological replicates). Viability was assessed by MTS/MTT assay and displayed as relative to untreated cells after 48 h. KPC (j) or MIA PaCa-2 (k) cells were cultured in the presence of increasing dosages of 3-IAA +/− MPO 400 mU/ml +/− FIRINOX (3.2 μM Oxaliplatin, 5.6 μM Irinotecan and 19.2 μM 5-FU; n = 3 biological replicates). Cell numbers were quantified using flow cytometry after 48 h of culture. Hy19636 (l) or MIA PaCa-2 (m) cells were cultured with increasing dosages of MOI (100, 200 or 400 μM) +/− FIRINOX (1.6 μM Oxaliplatin, 2.8 μM Irinotecan and 9.6 μM 5-FU; n = 5 to 12 biological replicates). Viability was assessed using the MTS assay and displayed as relative to untreated cells after 24 h. n, KPC tumour cells were orthotopically injected into SPF mice and mice were left untreated or treated with either FIRINOX (d11), 3-IAA (d9–13) or 3-IAA and FIRINOX (n = 5 each). Statistics and representative pictures show orthotopic tumours three days after indicated treatment with staining for nitrotyrosine (ROS). o, SPF mice were injected with orthotopic tumours and were treated with FIRINOX or FIRINOX + 3-IAA (n = 5 each). After five hours of treatment, ROS accumulation was analysed using flow cytometry. ROS levels of cancer cells (Epcam+), T cells (CD45+CD3+) or myeloid cells (CD45+CD11b+) are shown. p, Irradiated and WT (n = 5) or Mpo–/– (n = 3) bone-marrow-reconstituted mice received KPC cells orthotopically and were treated with FIRINOX or FIRINOX + 3-IAA as in o. ROS levels were assessed by flow cytometry as in o. One (a,b,n) or one out of three (d,gi) or two (c,e,f,jm,o,p) independent experiments are shown. Error bars indicate SEM or median (n), significant p-values are indicated and were determined by two-tailed t-test (ac,o,p), one-way ANOVA followed by Dunnett’s (d,gn) or Tukey’s (e,f) post-hoc test. Source data
Extended Data Fig. 8
Extended Data Fig. 8. 3-IAA and FIRINOX treatment decreases autophagy in vivo.
a, Normalized expression of ROS-producing or degrading enzymes found in mRNA sequencing data of tumours obtained from mice treated with FIRINOX compared to tumours treated with FIRINOX + 3-IAA (n = 3 biological replicates each; p values: GPX3 (0.00012), GPX7 (1.2*10−8), NOX4 (0.023)). b, KPC tumour cells were cultured in the presence of FIRINOX (3.2 μM Oxaliplatin, 5.6 μM Irinotecan and 19.2 μM 5-FU) +/− 10 μM of 3-IAA and 400 mU/ml MPO (n = 4 biological replicates). RNA expression of GPX 3 and 7 was measured using qPCR after 24 h of treatment. Expression is depicted as relative to a housekeeping gene. c, Scramble control-transfected cells, Gpx3 or Gpx7 knockdown cells were treated with +/− FIRINOX (3.2 μM Oxaliplatin, 5.6 μM Irinotecan and 19.2 μM 5-FU) +/− 10 μM of 3-IAA and MPO and ROS was assessed using flow cytometry (n = 3 or 4 biological replicates). d, as in c, except cell numbers were calculated using flow cytometry (n = 4 biological replicates). e, SPF mice were injected with orthotopic tumours using scramble control or GPX3 KD cells and were treated with +/− FIRINOX at day eleven of the experiment (n = 5 or 6). Tumour size was measured at day eight after FIRINOX treatment. f, GSEA enrichment plot depicting positive enrichment of reactome pathway autophagy in total tumours obtained from mice treated with FIRINOX compared to tumours treated with FIRINOX and 3-IAA (n = 3 biological replicates). g, KPC tumour cells were orthotopically injected into SPF mice and mice were treated with either 3-IAA and FIRINOX or FIRINOX alone (n = 3 each). One day after FIRINOX treatment, intratumoral proteins were analysed and compared. Proteins downregulated in tumours from 3-IAA and FIRINOX-treated mice were analysed for enriched KEGG pathways. The top 10 pathways are depicted and the full list of proteins and up- or downregulated pathways is provided in SI tables 1 to 3. h, KPC tumour cells were orthotopically injected into SPF mice. Mice were treated +/− FIRINOX (d11), +/− 3-IAA (d9–13) and p62/SQSTM1 staining was analysed at day three after treatment. Statistics show the number of p62/SQSTM1high cells per field (n = 5 each). Representative pictures are shown. The scale bar represents 100 μm. i,j, KPC tumour cells were orthotopically injected into gnotobiotic mice colonized with R or NR microbiota (n = 3 or 4). Mice were treated +/− FIRINOX and LC3-l/ll (i) or p62/SQSTM1 (j) staining was analysed at day 20 of the experiment. Statistics show the number of LC3-l/llhigh or p62/SQSTM1high cells per field (n = 4). Tumours were pooled from three individual experiments with different donors each. Representative pictures are shown. The scale bar represents 100 μm. k, KPC tumour cells were orthotopically injected into SPF mice and treated and analysed as in h, except that staining for cleaved caspase-3 (CC3, apoptosis) was applied. The scale bar represents 50 μm. l, SPF mice were orthotopically injected with GFP-LC3B-RFP reporter cells and treated with FIRINOX + 3-IAA, trehalose or FIRINOX + 3-IAA + trehalose (n = 5 each). Tumours were analysed for GFP/RFP ratios via bright field imaging. The GFP/RFP ratio is shown for each respective group. m, SPF mice were injected with (mST-ATG4B) or mSt control cells. Mice received either doxycycline treatment via diet for seven days (d5 to d12) or standard food and were treated +/− FIRINOX (n = 4 or 5 each). Tumour size at day 18 of the experiment is depicted. Representative pictures show tumours at the end of the experiment. Scale bar shows one centimetre. One (a,fk) or one out of two independent experiments (be,l) or three independent experiments with different lengths of doxycycline treatment (m) are shown. Each symbol represents one mouse or one in vitro replicate. Bars indicate SEM (ae,m) or median (hl), significant p-values are indicated and were determined as indicated in the methods section (a,f,g), by two-tailed Mann–Whitney test (b) one-way ANOVA followed by Dunnett’s (c, l) or Tukey’s (d, e, i, j, m) post-hoc test or by Kruskal–Wallis test followed by Dunn’s (h,k) post-hoc test. Source data
Extended Data Fig. 9
Extended Data Fig. 9. A 3-IAA and chemotherapy combination is effective in the treatment of colorectal and lung cancer cell lines.
a,b, The MC38 colorectal cancer cell line (n = 5 or 6; a) or LLC lung cancer cell line (n = 4 or 5; b) was subcutaneously injected and mice were treated +/− FIRINOX and +/− 3-IAA (500 mg/kg) orally. Tumours were measured every other day and tumour weight was scaled to day 17 of experiment. c, Orthotopic KPC tumours were established and SPF mice were treated with GNP once +/− 3-IAA (500 mg/kg; n = 4 each). Tumour weight was assessed seven days after chemotherapy (d18). d, Statistics show the event of neutropenia (<1,5*109/l) during the first 6 cycles of chemotherapy in patients from the Hamburg cohort responding or not responding to the chemotherapy (n = 11 R and 12 NR). e, DCA concentration was measured after two to three chemotherapy cycles in the serum of patients from the Hamburg cohort and was correlated with PFS (n = 20) or overall survival (n = 18). Each symbol represents one patient. f, Univariate Cox proportional hazard models were used to determine the effects of indicated variables on PFS in the Hamburg cohort. One experiment (b) or one out of two individual experiments (a) is shown. Error bars indicate SEM, significant p-values are indicated and were determined by one-way ANOVA followed by Dunnett’s post-hoc test (a, left statistic), Kruskal–Wallis test followed by Dunn’s (b, left statistic) post-hoc test, mixed-effects analysis followed by Dunnett’s post-hoc test (a and b, right statistic), two-tailed t-test (c), two-sided chi-square test (d), simple linear regression and Pearson’s r (e) or Cox regression (f). Source data

Comment in

References

    1. Nevala-Plagemann, C., Hidalgo, M. & Garrido-Laguna, I. From state-of-the-art treatments to novel therapies for advanced-stage pancreatic cancer. Nat. Rev. Clin. Oncol.17, 108–123 (2020). - PubMed
    1. Rahib, L., Wehner, M. R., Matrisian, L. M. & Nead, K. T. Estimated projection of US cancer incidence and death to 2040. JAMA Netw. Open4, e214708 (2021). - PMC - PubMed
    1. Von Hoff, D. D. et al. Increased survival in pancreatic cancer with nab-paclitaxel plus gemcitabine. N. Engl. J. Med.369, 1691–1703 (2013). - PMC - PubMed
    1. Conroy, T. et al. FOLFIRINOX or gemcitabine as adjuvant therapy for pancreatic cancer. N. Engl. J. Med.379, 2395–2406 (2018). - PubMed
    1. Raghavan, S. et al. Microenvironment drives cell state, plasticity, and drug response in pancreatic cancer. Cell184, 6119–6137 (2021). - PMC - PubMed

Publication types

MeSH terms