. 2023 Mar;615(7951):305-314.
doi: 10.1038/s41586-023-05736-y. Epub 2023 Feb 22.

Autoimmunity in Down's syndrome via cytokines, CD4 T cells and CD11c+ B cells

Affiliations

Autoimmunity in Down's syndrome via cytokines, CD4 T cells and CD11c+ B cells

Louise Malle et al. Nature. 2023 Mar.

Abstract

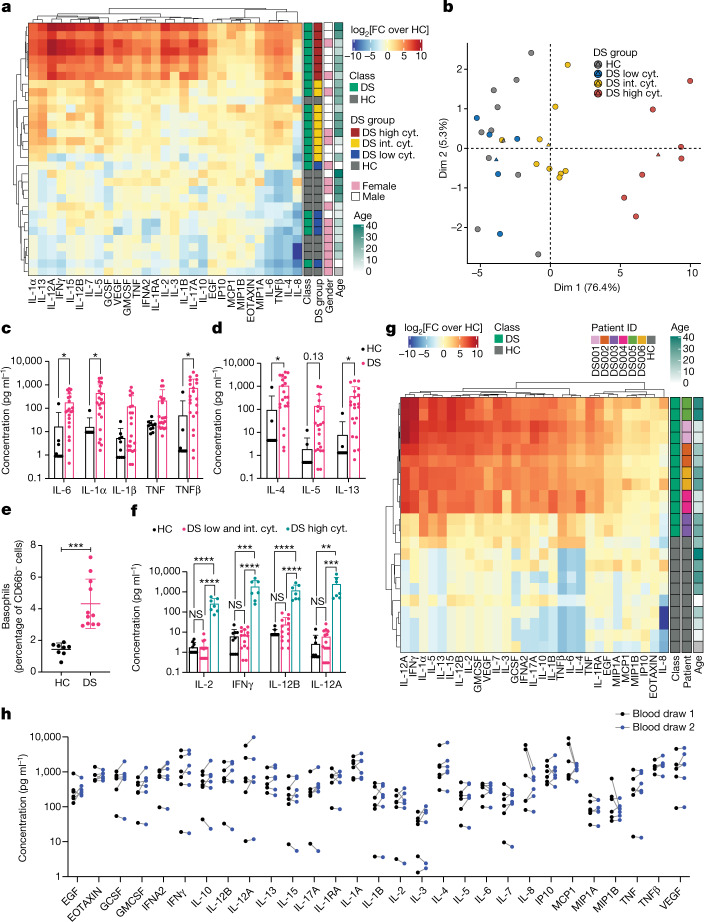
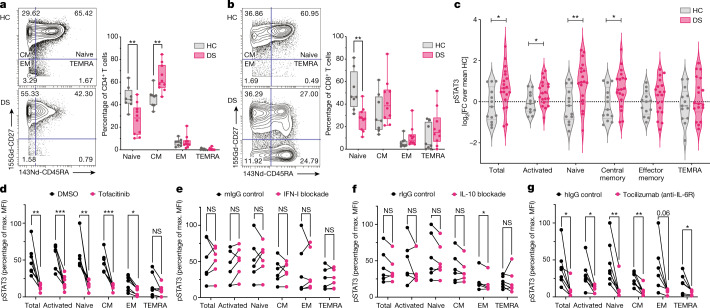
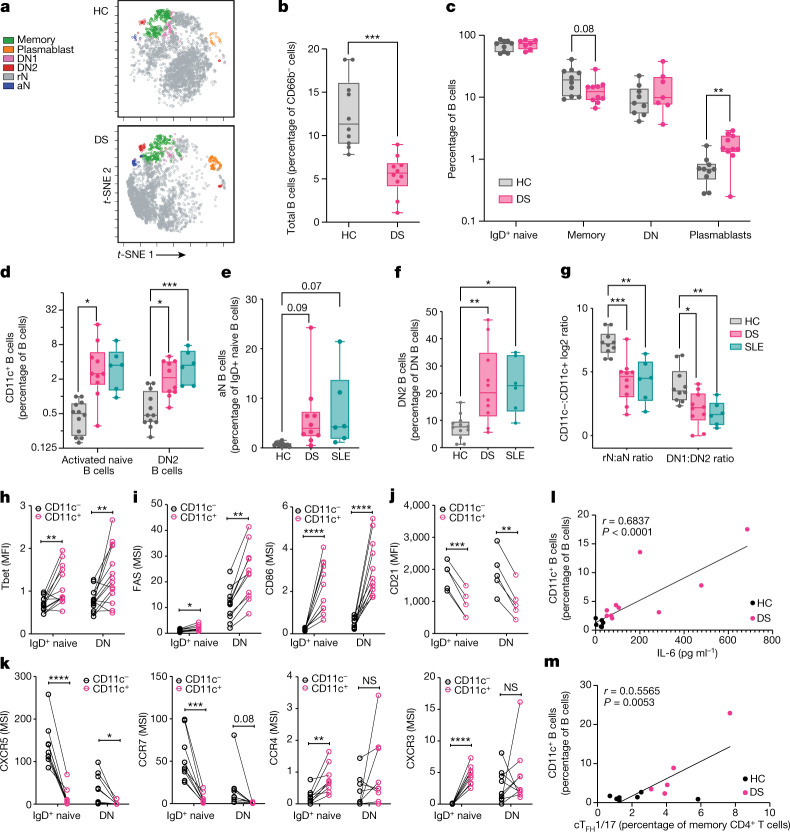
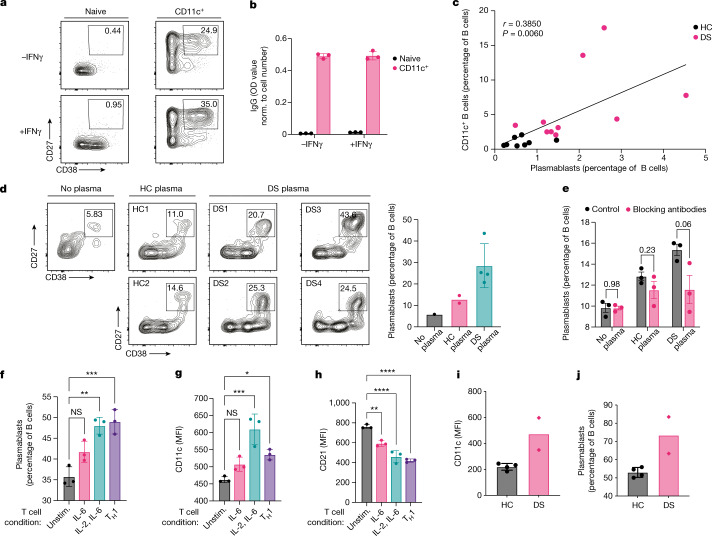
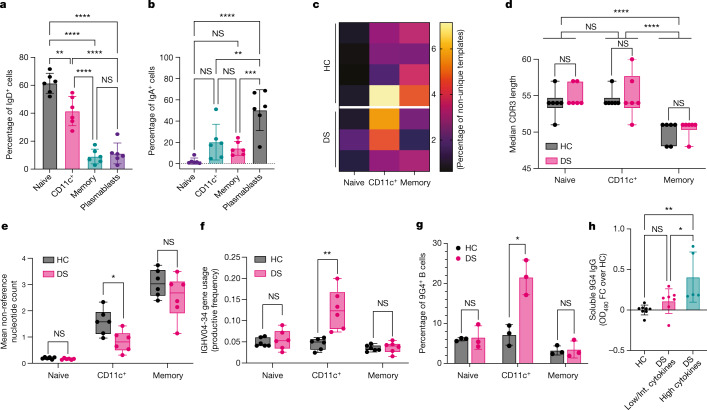
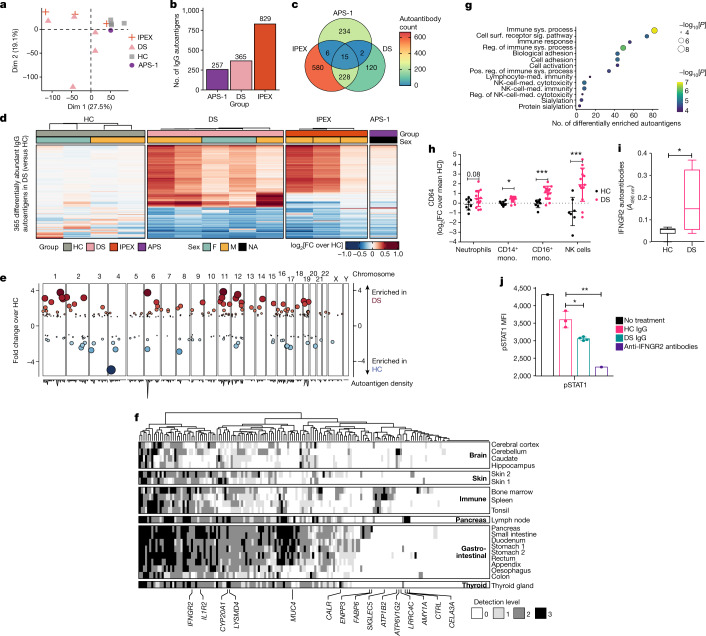
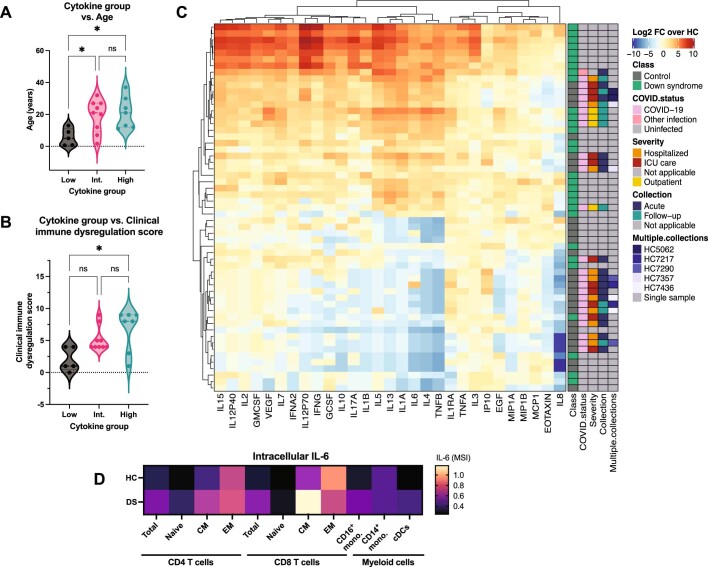
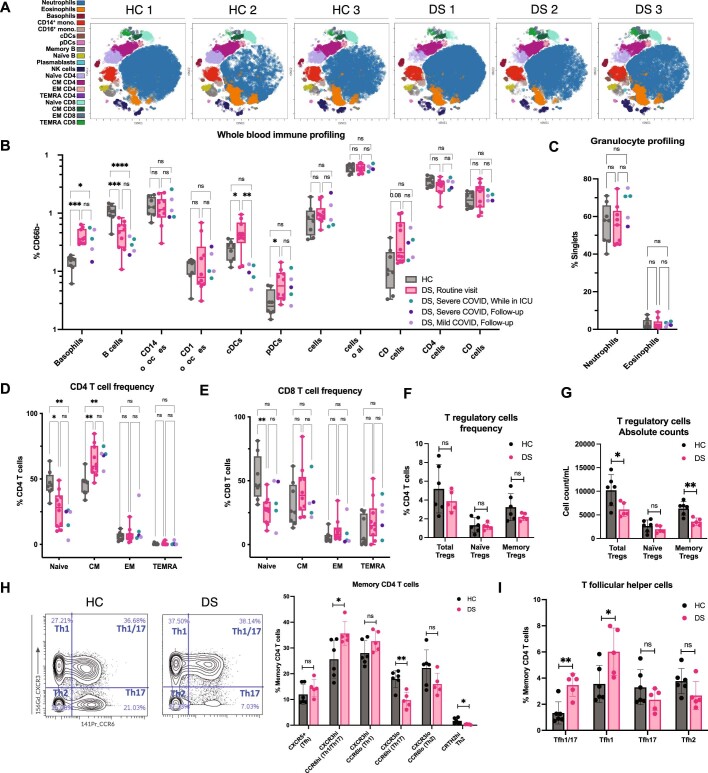
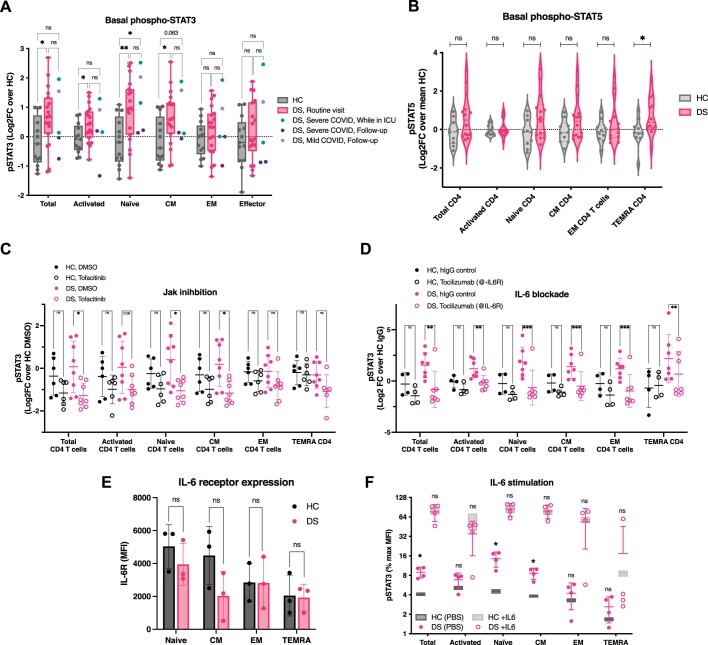
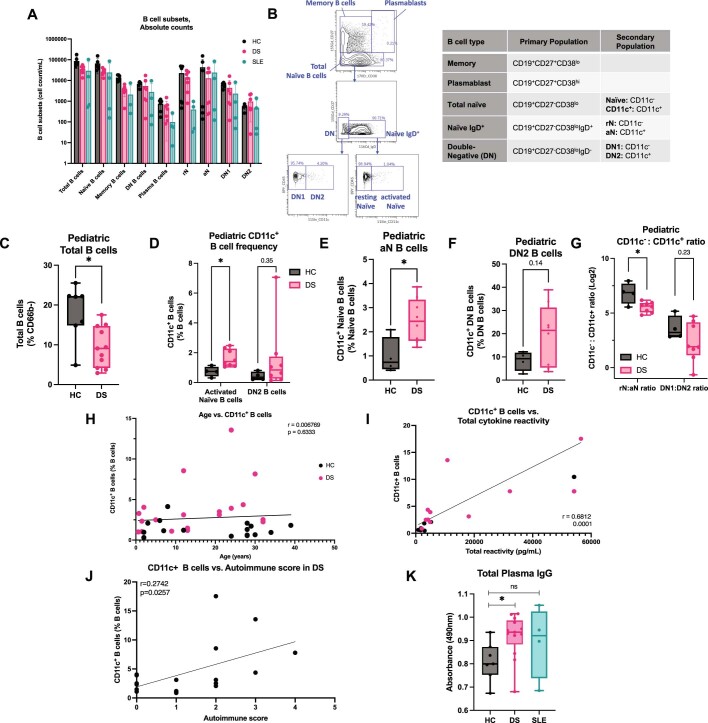
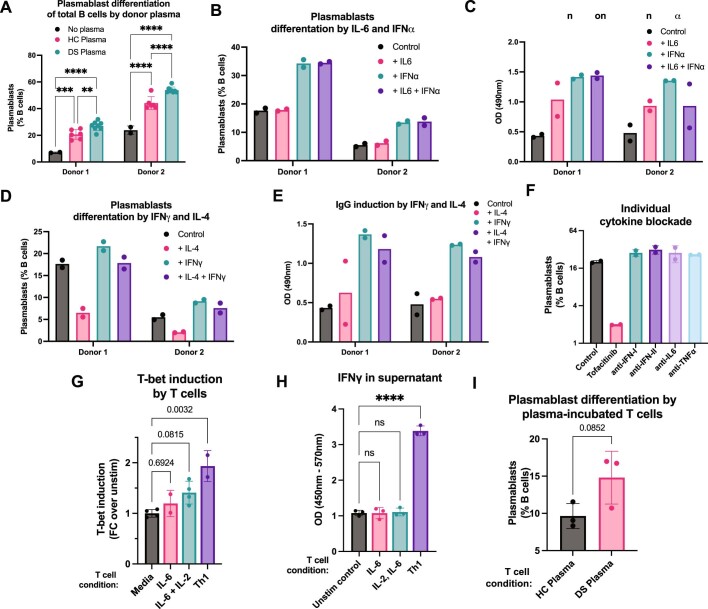
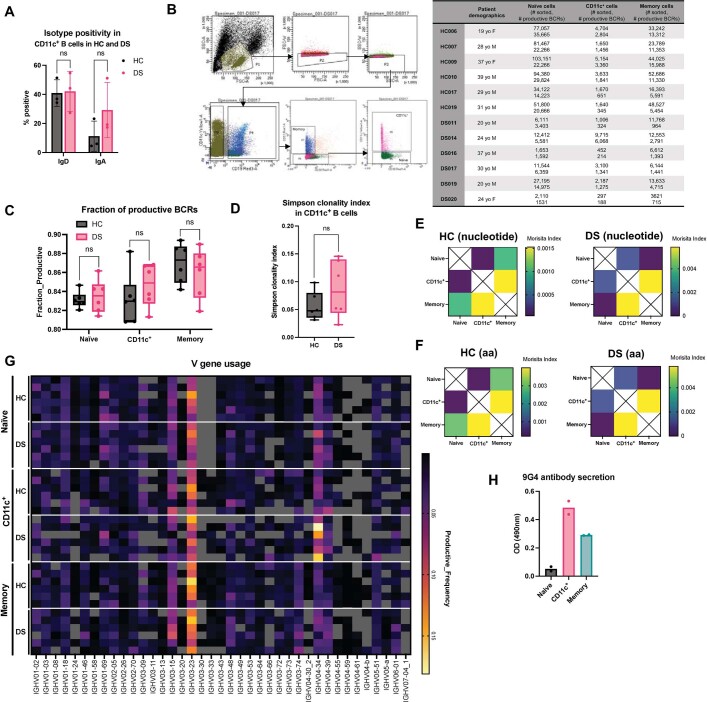
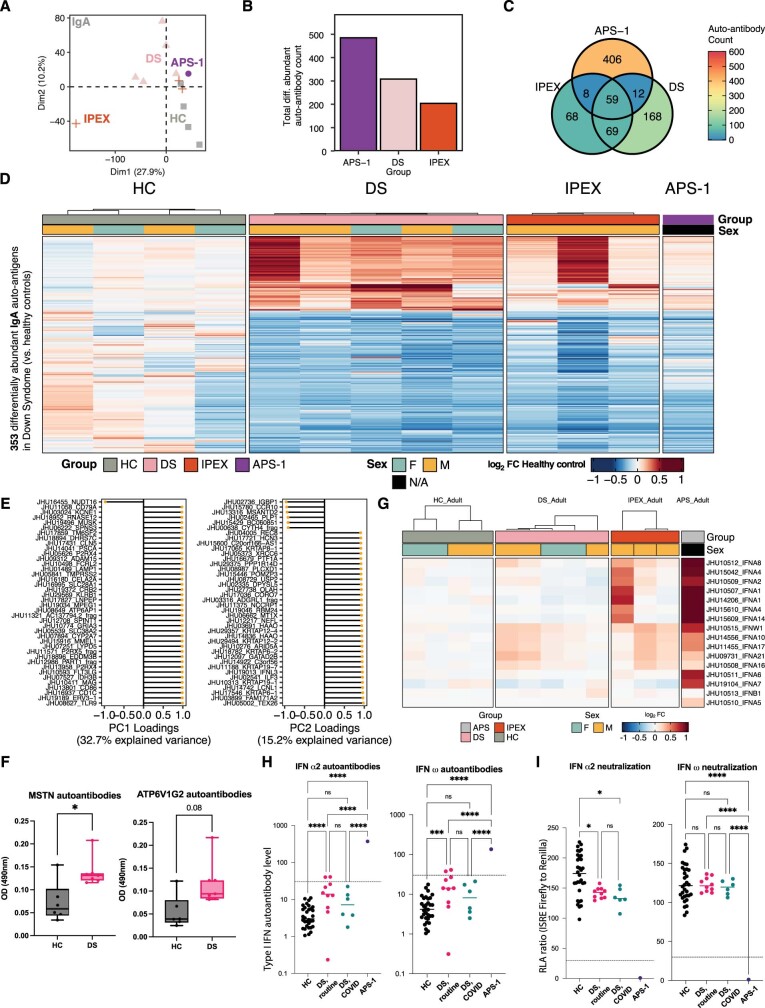
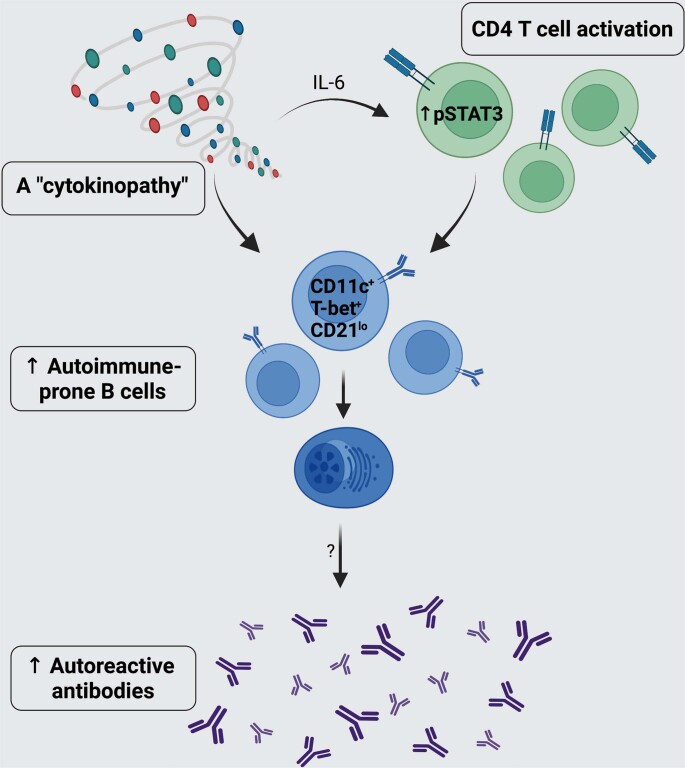
Down's syndrome (DS) presents with a constellation of cardiac, neurocognitive and growth impairments. Individuals with DS are also prone to severe infections and autoimmunity including thyroiditis, type 1 diabetes, coeliac disease and alopecia areata1,2. Here, to investigate the mechanisms underlying autoimmune susceptibility, we mapped the soluble and cellular immune landscape of individuals with DS. We found a persistent elevation of up to 22 cytokines at steady state (at levels often exceeding those in patients with acute infection) and detected basal cellular activation: chronic IL-6 signalling in CD4 T cells and a high proportion of plasmablasts and CD11c+TbethighCD21low B cells (Tbet is also known as TBX21). This subset is known to be autoimmune-prone and displayed even greater autoreactive features in DS including receptors with fewer non-reference nucleotides and higher IGHV4-34 utilization. In vitro, incubation of naive B cells in the plasma of individuals with DS or with IL-6-activated T cells resulted in increased plasmablast differentiation compared with control plasma or unstimulated T cells, respectively. Finally, we detected 365 auto-antibodies in the plasma of individuals with DS, which targeted the gastrointestinal tract, the pancreas, the thyroid, the central nervous system, and the immune system itself. Together, these data point to an autoimmunity-prone state in DS, in which a steady-state cytokinopathy, hyperactivated CD4 T cells and ongoing B cell activation all contribute to a breach in immune tolerance. Our findings also open therapeutic paths, as we demonstrate that T cell activation is resolved not only with broad immunosuppressants such as Jak inhibitors, but also with the more tailored approach of IL-6 inhibition.


Conflict of interest statement

D.B. is the founder and part owner of Lab11 Therapeutics. S.G. reports other research funding from Genentech, Boehringer-Ingelheim, Celgene, Takeda, and Regeneron.

Figures

Fig. 1
Fig. 1. Cytokine profiling indicates broad immune dysregulation in most individuals with DS.
a, Multiplex cytokine analysis using the magnetic Luminex assay of plasma from individuals with DS (n = 21) and HC individuals (n = 10), expressed as the log2-transformed fold change (FC) over the mean HC per cytokine (cyt.). Unsupervised clustering of samples and cytokines using the complete method (distance metric, Euclidean). Int., intermediate. b, PCA analysis of serum cytokines from the samples. c,d, Raw values of acute phase proteins (c) and TH2 cytokines (d) in the plasma of individuals with DS (n = 21) and HC individuals (n = 10) measured using the magnetic Luminex assay. e, The frequency of basophils expressed as the percentage of CD66b cells (non-granulocytes) from adults with DS (n = 11) and age-matched HC individuals (n = 8). f, Raw values of IL-2 and TH1 cytokines in the plasma of individuals with DS (n = 21) and HC individuals (n = 10) measured using the magnetic Luminex assay. g,h, Multiplex cytokine analysis using the magnetic Luminex assay of plasma from blood drawn at separate timepoints from individuals with DS (n = 6) expressed as log2-transformed fold change over the mean HC individuals per cytokine followed by unsupervised clustering (g) and as raw values (h). No significant differences were detected on the basis of paired t-tests between blood draws for each individual for each cytokine (P > 0.05 for all pairs). For cf, data are mean ± s.d. Significance was assessed using two-tailed unpaired t-tests (ce) and ANOVA with Tukey’s post hoc analysis (f); *P ≤ 0.05; **P ≤ 0.005; ***P ≤ 0.0005; ****P ≤ 0.0001.
Fig. 2
Fig. 2. T cell activation in DS is rescued by Jak inhibition or IL-6 blockade.
a,b, Representative plots and calculated frequencies of CD4+ (a) and CD8+ T cell naive, central memory (CM), effector memory (EM) and terminally differentiated effector memory (TEMRA) (b) subsets in whole blood from adults with DS (n = 10) and age-matched HC individuals (n = 8). c, Basal STAT3 phosphorylation in CD4+ T cell subsets from individuals with DS (n = 19) and age-matched HC individuals (n = 13) and expressed as the log2-transformed fold change over the mean of HC individuals per subset. dg, STAT3 phosphorylation in CD4+ T cell subsets from individuals with DS, normalized to the maximum value per experiment after ex vivo whole-blood treatment for 4 h with JAK inhibition (tofacitinib) (500 nM) (n = 7) (d); IFN blockade (anti-IFNAR2 (5 μg ml−1), anti-IFNα (0.2 μg ml−1) and anti-IFNβ (0.2 μg ml−1) antibodies) (n = 6) (e); IL-10 blockade (anti-IL-10 (5 μg ml−1) and anti-IL-10R (5 μg ml−1) antibodies) (n = 6) (f) or IL-6 blockade (tocilizumab, 50 μg ml−1) (n = 7) (g). In a and b, the whiskers denote the minimum and maximum values, the box limits denote quartiles 1–3, and the centre bar denotes the mean. For ag, significance was assessed using two-tailed unpaired t-tests; NS, not significant (P > 0.05).
Fig. 3
Fig. 3. Increased frequency of CD11c+TbethighCD21low B cells in DS.
a, Representative t-distributed stochastic neighbour embedding (t-SNE) analysis of a fixed number of B cells to illustrate subset distribution in whole blood from adults with DS and age-matched HC individuals. b,c, The frequency in adults with DS (n = 10) and age-matched HC individuals (n = 10) of total B cells expressed as the percentage of CD66b cells (non-granulocytes) (b) and B cell subsets expressed as the percentage of total B cells (c). dg, The frequency in HC adults (n = 10), adults with DS (n = 10) and patients with SLE (n = 6) of CD11c+ B cells in the IgD+ naive (CD27CD38lowIgD+) or DN (CD27CD38lowIgD) compartments expressed as the percentage of total (d), IgD+ naive (e) or DN (f) B cells, and the log2-transformed ratios of CD11c+ subsets to CD11c subset (rN:aN and DN2:DN1) (g). hk, Intracellular Tbet expression (h), and surface expression of FAS and CD86 (i), CD21 (j) and CXCR5, CCR7, CCR4 and CXCR3 (k) in naive and DN B cells from both HC individuals (n = 2–4) and individuals with DS (n = 3–10). MSI, mean signal intensity; MFI, mean fluorescence intensity. l,m, Correlation of CD11c+ B cells and circulating IL-6 (l) and cTFH1/17 (m). r, Pearson correlation coefficient. In bg, the whiskers denote the minimum and maximum values, the box limits denote quartile 1 to quartile 3, and the centre bar denotes the mean. Significance was assessed using two-tailed unpaired t-tests (b and hk) and one-way ANOVA with Tukey’s post hoc analysis (dg).
Fig. 4
Fig. 4. B cell activation by DS plasma and stimulated T cells.
a,b, Plasma cell differentiation (a) and secreted IgG in the supernatant (b) after culture for 4 days of sorted HC naive or CD11c+ B cells in the presence of BAFF, IL-2, IL-10, IL-21, the TLR7/8 ligand R848 with or without IFNγ. n = 3 biologically independent samples. Norm., normalized. c, Correlation of CD11c+ B cell and plasmablast frequencies in adults DS (n = 12) and age-matched HC individuals (n = 8). d, Plasma cell differentiation after culture for 6 days of sorted HC naive B cells in the presence of BAFF, IL-2, IL-10, IL-21, R848 and IgG-depleted plasma from HC individuals (n = 2) or individuals with DS (n = 4). e, Magnetic-activated cell sorting (MACS)-isolated naive B cells from a healthy donor were cultured for 3 days with BAFF, IL-2, IL-21, R848, anti-IgM and plasma of HC individuals or individuals with DS in the presence of a combination of antibodies blocking IFN-I, IFN-II, IL-6 and TFNα signalling, in triplicates. Significance was assessed using two-tailed unpaired t-tests. Data are mean ± s.e.m. The results are representative of two independent experiments with n = 2 donors per group. fh, Co-cultures containing T cells activated with IL-6, IL-2, both or polarized into TH1 cells with IL-2, IL-12 and anti-IL-4 together with MACS-isolated naive B cells from the same donor, run in triplicates. The frequency of plasmablasts (f) and extracellular CD11c induction (g) and downregulation of CD21 expression (h) in non-plasmablast B cells after co-culture for 3–6 days. Significance was assessed using one-way ANOVA with Tukey’s post hoc analysis. i,j, CD11c induction (i) and plasmablast differentiation (j) in naive CD11c B cells isolated from controls (n = 4) or individuals with DS (n = 2) after 3 days of co-culture with CD4 T cells isolated from the same donors (syngeneic cultures). For b, d and fj, data are mean ± s.d.
Fig. 5
Fig. 5. CD11c+ B cells from individuals with DS are more prone to autoreactivity.
a,b, Expression of IgD (a) and IgA (b) in naive, CD11c+ and memory B cells and plasmablasts from adults with DS and age-matched HC individuals. n = 3 each. ch, BCR sequencing analysis of genomic DNA isolated from sorted naive, CD11c+ and memory B cells from controls (n = 6) and individuals with DS (n = 6). c, The fraction of productive BCRs represented more than once in each sample. Individuals from whom a sample had fewer than 1,000 productive templates were excluded. d, CDR3 length of productive BCRs in B cells subsets in HC and DS, expressed as the number of nucleotides (nt). e, The mean number of nucleotides different from reference in the V gene of productive BCRs in B cells subsets in HC and DS. f, The frequency of productive BCRs that were aligned to the IGHV4-34 gene in each sample. g, 9G4 surface expression in naive, CD11c+ and memory B cells from HC individuals (n = 3) and individuals with DS (n = 3). h, ELISA quantification of 9G4 antibodies in the plasma of HC individuals (n = 8), and individuals with DS in the low/medium (n = 7) and high (n = 5) cytokine groups, expressed as the fold change over HC individuals. OD490, optical density at 490 nm. For a, b, g and h, data are mean ± s.d. For df, the whiskers denote the minimum and maximum values, the box limits denote quartile 1 to quartile 3, and the centre bar denotes the mean. Significance in a and h and significance between cell subsets in d was assessed using one-way ANOVA with Tukey’s post-hoc analysis. Significance in dg between the HC and DS groups was assessed using two-tailed paired t-tests.
Fig. 6
Fig. 6. Autoantibody repertoire in individuals with DS.
a, PCA analysis of the HuProt IgG dataset for adults with DS (n = 5), age-matched HC individuals (n = 4), and patients with IPEX (n = 3) and APS-1 (n = 1). b, The number of IgG autoantigens enriched at least twofold in individuals with DS, IPEX and APS-1 compared with HC individuals. c, Enriched IgG autoantigens overlapping between disease groups. d, Enriched IgG autoantigens in HC individuals and in individuals with DS, IPEX and APS-1. The colour intensity corresponds to the log2-transformed fold change expression value relative to the mean of healthy adult controls. F, female; M, male; NA, unknown. e, Chromosomal expression pattern of IgG autoantigens enriched in DS. f, Gene expression pattern of IgG autoantigens enriched in DS (n = 5) according to the Human Protein Atlas. g, GO analysis of IgG autoantigens enriched in DS ranked by the number of autoantigens found to be enriched in the associated gene set. The dot size and colour intensity correspond to the FDR-adjusted P value. Med., mediated; NK, natural killer; reg., regulation; sig, signalling; surf, surface; sys., system. h, The surface expression of CD64 in monocytes, natural killer cells from individuals with DS (n = 14) and age-matched HC individuals (n = 8). Mono, monocytes. i, ELISA analysis of anti-IFNGR2 autoantibodies in the plasma from adults with DS (n = 4) and age-matched HC individuals (n = 7). j, Neutralizing IFNγ signalling in THP-1 cells by IgG fraction of plasma from adults with DS (n = 3), age-matched HC individuals (n = 3) or recombinant anti-IFNGR2 antibody. Significance was assessed using one-way ANOVA with Tukey’s post hoc analysis. For h and i, significance was assessed using two-tailed unpaired t-tests. For h and j, data are mean ± s.d. For i, the whiskers denote the minimum and maximum values, the box limits denote quartile 1 to quartile 3, and the centre bar denotes the mean.
Extended Data Fig. 1
Extended Data Fig. 1. Global cytokine dysregulation in DS.
(A-B) Correlation between cytokine group and (A) Age and (B) Clinical Immune Dysfunction score (determined according to reported clinical history, see Methods) and Age in individuals with DS. Significance assessed by one-way ANOVA with Tukey’s post-hoc analysis, ns denotes p > 0.05, *p ≤ 0.05; **p ≤ 0.005, ***p ≤ 0.0005. (C) Multiplex cytokine analysis by Magnetic Luminex assay of plasma from HCs (n = 10), uninfected individuals with DS (n = 21), and individual with acute respiratory infection (n = 1), or individuals with DS and COVID-19 (n = 7) with severity and time of sampling as indicated, expressed as log2FC over the mean HC per cytokine. Unsupervised clustering of samples and cytokines using the complete method (distance metric: Euclidean). (D) Intracellular staining of IL-6 in CD4 T cells, CD8 T cells, and Myeloid cells from HCs (n = 4) and individuals with DS (n = 5).
Extended Data Fig. 2
Extended Data Fig. 2. Cellular immune landscape in DS.
(A) Representative t-SNE of agranulocytes adults with DS (n = 3) and age-matched HCs (n = 3) illustrating the immune cell distribution in whole blood. (B-E) Frequencies of (B) agranulocyte subsets, (C) granulocyte subsets, and (D) CD4 and (E) CD8 T cell subsets in whole blood from adults with DS (n = 10), adults with DS and COVID-19 (n = 5), and age-matched HCs (n = 8). (F-G) Frequencies (F) and absolute counts (G) of T regulatory (Treg) cells (CD4+CD25+CD127) and naive (CD45RA+) and memory (CD45RA) subsets in whole blood from adults with DS (n = 5) and age-matched HCs (n = 5). (H-I) Representative plots and calculated frequencies of (H) T helper (Th) and (I) T follicular helper (Tfh) cell subsets in whole blood from adults with DS (n = 5) and age-matched HCs (n = 5), expressed as percent of memory CD4 T cells. In (B-E), whiskers denote min and max values, bounds of box denote Q1–Q3, and centre bar denotes mean. (F-I) Error bars denote SD. (B-E) Significance assessed by one-way ANOVA with Tukey’s post-hoc analysis, ns denotes p > 0.05, *p ≤ 0.05; **p ≤ 0.005, ***p ≤ 0.0005. (F-I) Significance assessed by two-tailed paired t tests, ns denotes p > 0.05, *p ≤ 0.05; **p ≤ 0.005, ***p ≤ 0.0005.
Extended Data Fig. 3
Extended Data Fig. 3. Basal signalling in CD4 T cells in DS.
(A) Basal STAT3 phosphorylation in CD4 T cell subsets from HCs (n = 13), individuals with DS (n = 19), and adults with DS and COVID-19 (n = 5) expressed as Log2FC over the mean HCs per subset. Significance assessed by one-way ANOVA with Tukey’s post-hoc analysis, ns denotes p > 0.05, *p ≤ 0.05; **p ≤ 0.005, ***p ≤ 0.0005. Whiskers denote min and max values, bounds of box denote Q1–Q3, and centre bar denotes mean. (B) Basal STAT5 phosphorylation in CD4 T cell subsets from individuals with DS (n = 14) and age-matched controls (n = 10), expressed as Log2FC over the mean HCs per subset. (C-D) STAT3 phosphorylation in CD4 T cell subsets expressed as Log2FC over the mean mock-treated HCs per subset after ex vivo whole blood treatment for 4 h with (C) Tofacitinib (500nM) (n = 6 HC, n = 7 DS), (D) Tocilizumab (50 μg ml−1) (n = 4 HC, n = 7 DS). (E) Surface expression of IL-6R in CD4 T cells from adults with DS (n = 3) and age-matched HCs (n = 3). (F) STAT3 phosphorylation in CD4 T cell subsets induced by stimulation of whole blood with recombinant IL-6 (50 ng ml−1) for 15 min, expressed as Log2FC over the mean mock-treated HCs (n = 2 HC, n = 4 DS). Box plots denote min and max values for HCs, error bars indicate SD and centre denotes mean for DS. (C-E) Error bars denote SD. (B-F) Significance assessed by two-tailed paired t tests, ns denotes p > 0.05, *p ≤ 0.05; **p ≤ 0.005, ***p ≤ 0.0005.
Extended Data Fig. 4
Extended Data Fig. 4. Abnormal B cell subsets in DS.
(A) Raw B cell counts in HCs (n = 6) and adults with DS (n = 7) or patients with SLE (n = 4). Error bars denote SD. (B) Gating scheme of B cells subtypes. (C) Frequency in children with DS (n = 11) and age-matched HCs (n = 7) of total B cells expressed as percent of CD66b cells (non-granulocytes), Significance assessed by two-tailed unpaired t tests, *p ≤ 0.05. (D-F) Frequency in children with DS (n = 8) and age-matched HCs (n = 4) of CD11c+ B cells in the IgD+ naive or DN compartments, expressed as percent of (D) total, (E) IgD+ naïve, or (F) DN B cells. (G) Ratios of CD11c+ subsets to CD11c subset (rN:aN and DN2:DN1) in HC and DS groups, Log2-transformed. Significance assessed by two-tailed unpaired t tests, *p ≤ 0.05. (H-I) Correlation of CD11c+ B cell frequency and (H) age and (I) total cytokines (calculated as the sum of all circulating cytokines, pg ml−1) in individuals (H) or adults (I) with DS and age-matched controls. (r: Pearson correlation coefficient). (J) Correlation of CD11c+ B cell frequency and autoimmune score (calculated as the sum of autoimmune diseases) in individuals with DS. (r: Pearson correlation coefficient). (K) Total IgG in the plasma of HCs (n = 7) and individuals with DS (n = 12) or SLE (n = 6) assessed by ELISA. Significance assessed by one-way ANOVA with Tukey’s post-hoc analysis, ns denotes p > 0.05, *p ≤ 0.05. In (C-F, K), whiskers denote min and max values, bounds of box denote Q1–Q3, and centre bar denotes mean.
Extended Data Fig. 5
Extended Data Fig. 5. Atypical activation of naive B cells by cytokines and activated T cells.
(A Plasmablast differentiation of MACS-isolated total B cells from 2 healthy donors after 3-day culture in the presence of BAFF (10 ng ml−1), IL-2 (50 ng ml−1), IL-21 (50 ng ml−1), R848 (1 μg ml−1), anti-IgM (1 μg ml−1), and IgG-depleted plasma from HCs (n = 3) or individuals with DS (n = 3), run in duplicates. (B-C) MACS-isolated total B cells from 2 healthy donors were cultured in the presence of BAFF, IL-2, IL-21, R848, anti-IgM (same concentrations as A), in the presence of IL-6 (100 ng ml−1), IFN-α2b (100 U ml−1), or both, run in duplicates. After 3 days, cells were washed and cultured for another 3 days in media with anti-IgM. (B) Plasmablast differentiation at day 3 and (C) ELISA for total IgG in supernatant at day 6. (D-E) MACS-isolated total B cells from 2 healthy donors were cultured for 3-days in the presence of BAFF, IL-2, IL-21, R848, anti-IgM (same concentrations as A), and IL-4 (20 ng ml−1), IFN-ɣ (20 ng ml−1), or both, run in duplicates. Cells were then washed and cultured for another 3 days in media with anti-IgM. (D) Plasmablast differentiation at day 3 and (E) ELISA for total IgG in supernatant at day 6. (F) Plasmablast differentiation of MACS-isolated naive B cells from a healthy donor after 3-day culture in the presence of BAFF, IL-2, IL-21, R848, anti-IgM (same concentrations as J), and IgG-depleted DS plasma in the presence of Tofacitinib (500nM) or antibodies blocking IFN-I, IFN-II, IL-6, and TFN-ɑ signalling, run in duplicates. (G-H) Co-cultures containing T cells activated with IL-6, IL-2, both, or polarized into “Th1 cells” together with MACS-isolated naive B cells from the same donor, run in triplicates. (G) Intracellular T-bet expression in non-plasmablast B cells and (H) quantification of IFN-g in the supernatant after 3-6 days of co-culture. (I) Frequency of plasmablasts in co-cultures containing T cells previously polarized with serum from HCs (n = 3) or individuals with DS (n = 3) together with MACS-isolated naive B cells from the same donor. Significance assessed by two-tailed unpaired t-test. (A-I) Error bars denote SD. (A,H) Significance assessed by One-way ANOVA with Tukey’s post-hoc analysis, ns denotes p > 0.05; **p ≤ 0.005; ***p ≤ 0.0005; ****p ≤ 0.0001.
Extended Data Fig. 6
Extended Data Fig. 6. Receptor sequencing in atypical B cells.
(A) Expression of IgD and IgA in CD11c+ B cells from adults with DS (n = 3) and age-matched HCs (n = 3). Significance assessed by unpaired t-tests, ns denotes p > 0.05. Error bars denote SD. (B-F) BCR sequencing from gDNA isolated from sorted naïve, CD11c+ and memory B cells from controls (n = 6) and individuals with DS (n = 6). (B) Sorting scheme for naïve, CD11c+ and memory B cells (left) and number of cells sorted and number of productive BCRs obtained by sequencing for each cell type (right). (C) Fraction of in-frame BCRs containing no stop codons (“productive BCRs”) in naïve, CD11c+ and memory B cells from controls (n = 6) and individuals with DS (n = 6). (D) Simpson clonality in productive BCRs from CD11c+ B cells from controls (n = 6) and individuals with DS (n = 6). In (C-D), significance assessed by two-tailed unpaired t-test (ns denotes p > 0.05) and whiskers denote min and max values, bounds of box denote Q1–Q3, and centre bar denotes mean. (E-F) Representative heatmaps of Morisita index indicating overlap between B cell subsets in HC and DS at the (E) nucleotide and (F) amino acid levels. (G) Heatmap of IGHV gene frequency in HC and DS. Only genes that occurred at higher than 0.1% frequency in more than 10 samples are shown. (H) 9G4 IgG antibodies in supernatant after 4-day culture of sorted HC naïve, CD11c+ or memory B cells in the presence of BAFF, IL-2, IL-10, IL-21, the TLR7/8 ligand R848 with or without IFN-ɣ. Results representative of 2 independent experiments.
Extended Data Fig. 7
Extended Data Fig. 7. Autoantibodies in DS plasma.
(A) Principal component analysis of HuProt IgA dataset for adult HCs (n = 4), adults with DS (n = 5), and patients, Immunodysregulation polyendocrinopathy enteropathy X-linked syndrome (IPEX) (n = 3) and Autoimmune polyglandular syndrome type 1 (APS-1) (n = 1). (B) Number of IgA autoantigens enriched at least 2-fold in DS, IPEX, and APS-1 compared to HCs. (C) Venn diagram of enriched IgA autoantigens overlapping between disease groups. (D) Heatmap of enriched IgA autoantigens in HCs, DS, IPEX, and APS-1. Colour intensity corresponds to the log2FC expression value relative to the mean of healthy adult controls. (E) Component loadings (PC1 and PC2) from Principal component analysis of HuProt IgG dataset for adults with DS (n = 5) and age-matched HCs (n = 4). (F) ELISA of anti-MSTN and anti-ATP6V1G2 autoantibodies in plasma from HCs (n = 6) and individuals with DS (n = 6). Significance assessed by two-tailed unpaired t tests, * denotes p ≤ 0.05. Whiskers denote min and max values, bounds of box denote Q1–Q3, and centre bar denotes mean. (G) Heatmap of IgG type I IFN autoantigens in HCs, DS, IPEX, and APS-1. Colour intensity corresponds to the log2FC expression value relative to the mean of healthy adult controls. (H) Quantification of antibodies against IFNα2 and IFNω in serum from HCs (n = 32), DS without COVID-19 (n = 10), DS with COVID-19 (n = 6), and APS-1 (n = 1) by Gyros assay. (I) Neutralization of IFNα2 and IFNω activity by serum from HCs (n = 32), DS without COVID-19 (n = 10), DS with COVID-19 (n = 6), and APS-1 (n = 1) by Gyros assay. (H-I) Significance assessed by One-way ANOVA with Tukey’s post-hoc analysis, ns denotes p > 0.05, *p ≤ 0.05; **p ≤ 0.005; ***p ≤ 0.0005; ****p ≤ 0.0001.
Extended Data Fig. 8
Extended Data Fig. 8. Graphical abstract.
Breaking Immune Tolerance in Down Syndrome: A Triad of Cytokines, Activated T cells and CD11c+ B Cells. Created with BioRender.

Comment in

References

    1. Bull MJ. Down syndrome. N. Engl. J. Med. 2020;382:2344–2352. doi: 10.1056/NEJMra1706537. - DOI - PubMed
    1. Ryan, C., Vellody, K., Belazarian, L. & Rork, J. F. Dermatologic conditions in Down syndrome. Pediatr. Dermatol.38, 14731 (2021). - PubMed
    1. Down, J. L. H. Observations on an ethnic classification of idiots. Lond. Hosp. Rep.3, 259–262 (1866).
    1. Mai CT, et al. National population-based estimates for major birth defects, 2010–2014. Birth Defects Res. 2019;111:1420–1435. doi: 10.1002/bdr2.1589. - DOI - PMC - PubMed
    1. Antonarakis SE, et al. Down syndrome. Nat. Rev. Dis. Prim. 2020;6:9. doi: 10.1038/s41572-019-0143-7. - DOI - PMC - PubMed

Publication types