. 2023 Apr;616(7955):104-112.
doi: 10.1038/s41586-023-05737-x. Epub 2023 Feb 22.

Four ways blue foods can help achieve food system ambitions across nations

Affiliations

Four ways blue foods can help achieve food system ambitions across nations

Beatrice I Crona et al. Nature. 2023 Apr.

Abstract

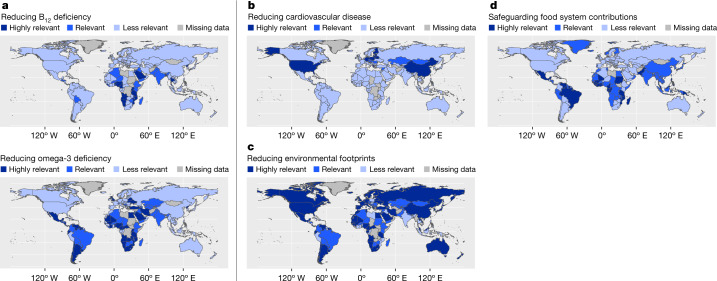
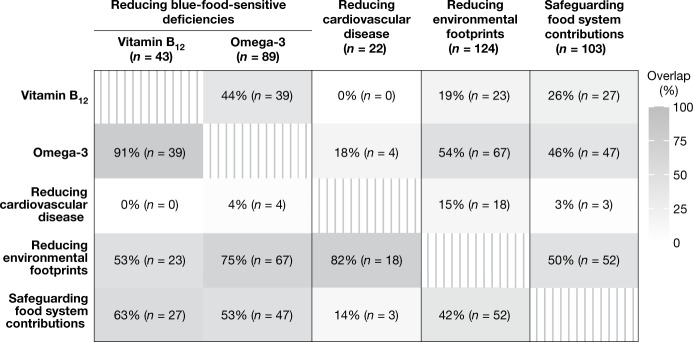
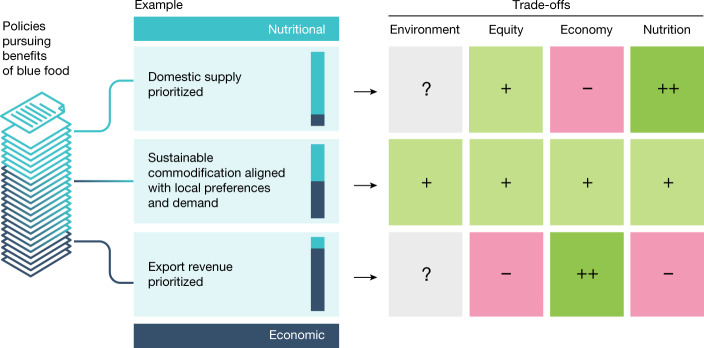
Blue foods, sourced in aquatic environments, are important for the economies, livelihoods, nutritional security and cultures of people in many nations. They are often nutrient rich1, generate lower emissions and impacts on land and water than many terrestrial meats2, and contribute to the health3, wellbeing and livelihoods of many rural communities4. The Blue Food Assessment recently evaluated nutritional, environmental, economic and justice dimensions of blue foods globally. Here we integrate these findings and translate them into four policy objectives to help realize the contributions that blue foods can make to national food systems around the world: ensuring supplies of critical nutrients, providing healthy alternatives to terrestrial meat, reducing dietary environmental footprints and safeguarding blue food contributions to nutrition, just economies and livelihoods under a changing climate. To account for how context-specific environmental, socio-economic and cultural aspects affect this contribution, we assess the relevance of each policy objective for individual countries, and examine associated co-benefits and trade-offs at national and international scales. We find that in many African and South American nations, facilitating consumption of culturally relevant blue food, especially among nutritionally vulnerable population segments, could address vitamin B12 and omega-3 deficiencies. Meanwhile, in many global North nations, cardiovascular disease rates and large greenhouse gas footprints from ruminant meat intake could be lowered through moderate consumption of seafood with low environmental impact. The analytical framework we provide also identifies countries with high future risk, for whom climate adaptation of blue food systems will be particularly important. Overall the framework helps decision makers to assess the blue food policy objectives most relevant to their geographies, and to compare and contrast the benefits and trade-offs associated with pursuing these objectives.


Conflict of interest statement

R.S. sits on the board of Oceana, and C.D.G., R.L.N. and J.A.G. serve as scientific advisers to the same organization. S.R.B. has unpaid advisory roles on the International Advisory Board for Aquaculture Investments of the Sustainable Trade Initiative (IDH), Utrecht, The Netherlands; and on the Standards Oversight Committee of the Global Seafood Alliance, United States; and is part of the Seafood Watch Aquaculture Multi Stakeholder Group at Monterey Bay Aquarium, CA, USA. B.C., M. Troell, E.R.S. and C.C.C.W. provide occasional voluntary and unpaid scientific support to the Seafood Business for Ocean Stewardship initiative (https://seabos.org/). None of the non-academic actors mentioned has had any input to the study design, analysis, interpretation of data or conclusions drawn.

Figures

Fig. 1
Fig. 1. National relevance of blue food in supporting four policy objectives.
Policy objective relevance is based on how well each nation matched the conditions for when blue foods could be expected to contribute to achieving food system ambitions (see Supplementary Table 2 for formalized inclusion criteria). ad, The national relevance of the policies relating to reducing blue-food-sensitive deficiencies (vitamin B12 (top) and omega-3 (bottom); a), reducing the burden of cardiovascular disease (b), reducing environmental footprints of food consumption and production (c) and safeguarding blue food contributions under climate change (d). Readers can examine the detailed objectives matching individual countries, and explore effects of different cutoffs at https://gedb.shinyapps.io/BFA_synthesis/.
Fig. 2
Fig. 2. Overlap in relevance between different policy objectives.
The numbers in parentheses in the top row represent the total number of countries for which each policy is relevant. Each cell shows the number of countries (in parentheses) for which both column- and row-heading policies are relevant, as a proportion of countries for which the column-heading policy is relevant. Relevance in this figure indicates countries categorized as ‘highly relevant’ or ‘relevant’ for a given policy.
Fig. 3
Fig. 3. Example of hypothetical trade-offs associated with policies pursuing economic and/or nutritional benefits of blue food.
The figure illustrates one set of trade-offs in policy outcomes that may result across the dimensions of environment, equity, economy and nutrition, depending on the degree of prioritization of either increasing domestic blue food supplies for nutritional outcome, or maximizing monetary value through exports of blue foods. The degree of emphasis placed on either policy goal is represented by the blue bars. Likely outcomes for each dimension are represented by coloured boxes and the strength of outcome is represented by plus and minus symbols; with positive outcomes depicted in green, and negative in pink. Sustainable commodification aligned with local preferences and demand represents an example of how a balance could be struck to optimize positive environmental, inclusive, economic and nutritional outcomes. Unknown impacts, or where policy objectives are judged to not have a strong impact, are depicted in grey. E. Wikander/Azote.
Extended Data Fig. 1
Extended Data Fig. 1. Underlying distribution of variables.
Red line indicates selected cut-offs used in our analysis. In cases where many countries have data close to the cutoff – a change in threshold value will greatly impact the outcomes, thus explaining some of the results of the sensitivity analyses (see Extended Data Figs. 2–6).
Extended Data Fig. 2
Extended Data Fig. 2. Sensitivity analysis of policy “Reducing blue food sensitive nutrient deficiencies” – for vitamin B12.
Shows number of countries in each category of policy relevance (highly relevant, relevant, less relevant), under all possible values of the threshold. Blue food variable is shown both in its full extent and in a cropped version to highlight the variability around the selected threshold. Red vertical line indicates selected threshold in analysis.
Extended Data Fig. 3
Extended Data Fig. 3. Sensitivity analysis of policy “Reducing blue food sensitive nutrient deficiencies” – for omega-3.
Shows number of countries in each category of policy relevance (highly relevant, relevant, less relevant), under all possible values of the threshold. Blue food variable is shown both in its full extent and in a cropped version to highlight the variability around the selected threshold. Red vertical line indicates selected threshold in analysis.
Extended Data Fig. 4
Extended Data Fig. 4. Sensitivity analysis of policy “Reducing cardiovascular disease risk”.
Shows number of countries in each category of policy relevance (highly relevant, relevant, less relevant), under all possible values of the threshold. Blue food variable is shown both in its full extent and in a cropped version to highlight the variability around the selected threshold. Red vertical line indicates selected threshold in analysis.
Extended Data Fig. 5
Extended Data Fig. 5. Sensitivity analysis of policy “Reducing environmental footprints of food consumption and production”.
Shows number of countries in each category of policy relevance (highly relevant, relevant, less relevant), under all possible values of the threshold. Blue food variable is shown both in its full extent and in a cropped version to highlight the variability around the selected threshold. Red vertical line indicates selected threshold in analysis.
Extended Data Fig. 6
Extended Data Fig. 6. Sensitivity analysis of policy “Safeguarding food system contributions under climate change”.
Shows number of countries in each category of policy relevance (highly relevant, relevant, less relevant), under all possible values of the threshold. Red vertical line indicates selected threshold in analysis.

Comment in

References

    1. Golden CD, et al. Aquatic foods for nourishing nations. Nature. 2021;598:315–320. doi: 10.1038/s41586-021-03917-1. - DOI - PMC - PubMed
    1. Gephart JA, et al. Environmental performance of blue foods. Nature. 2021;597:360–365. doi: 10.1038/s41586-021-03889-2. - DOI - PubMed
    1. Continuous Update Project Expert Report 2018. Meat, Fish and Dairy Products and the Risk of Cancer (World Cancer Research Fund/American Institute for Cancer Research, 2018).
    1. Cisneros-Montemayor AM, Pauly D, Weatherdon LV, Ota Y. A global estimate of seafood consumption by coastal Indigenous peoples. PLoS ONE. 2016;11:e0166681. doi: 10.1371/journal.pone.0166681. - DOI - PMC - PubMed
    1. Halpern BS, et al. Opinion: Putting all foods on the same table: achieving sustainable food systems requires full accounting. Proc. Natl Acad. Sci. USA. 2019;116:18152–18156. doi: 10.1073/pnas.1913308116. - DOI - PMC - PubMed

Publication types

MeSH terms

Substances