. 2023 Feb 22;23(1):178.
doi: 10.1186/s12885-023-10560-8.

Is obesity a risk factor for melanoma?

Affiliations

Is obesity a risk factor for melanoma?

Yuval Arbel et al. BMC Cancer. .

Abstract

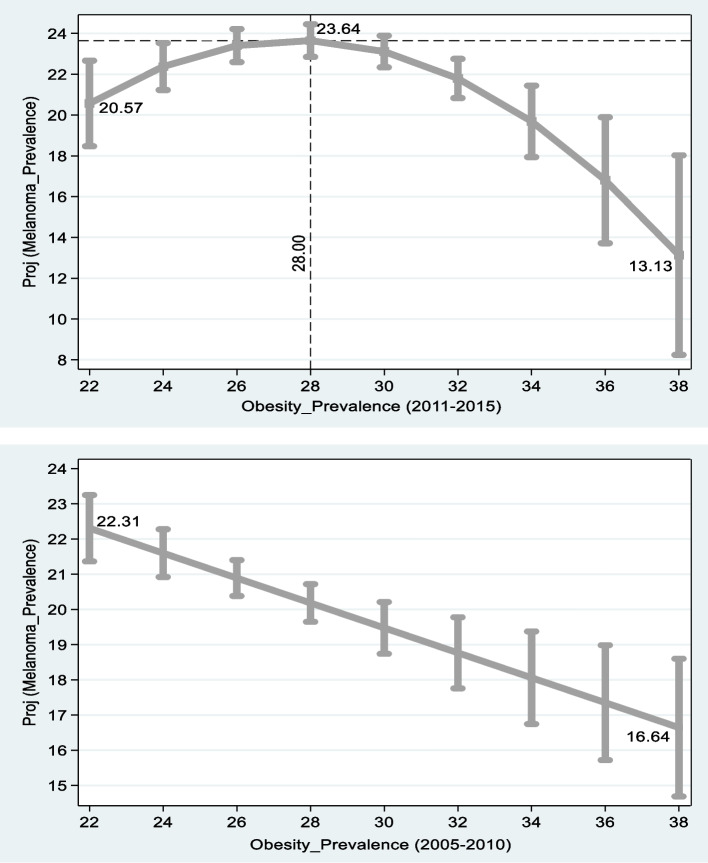
Objectives: Are twofold: 1) to estimate the relationship between obesity (BMI ≥30) and the prevalence of melanoma in different US states and 2) to examine the possibility of defining a new risk group. This might enhance the possibility of detection, which in turn, might increase the survival rates of patients.

Study design: A cohort Study, based on data at the US statewide level in 2011-2017, where the dependent variable (the annual new melanoma cases per 100,000 persons) is adjusted for age.

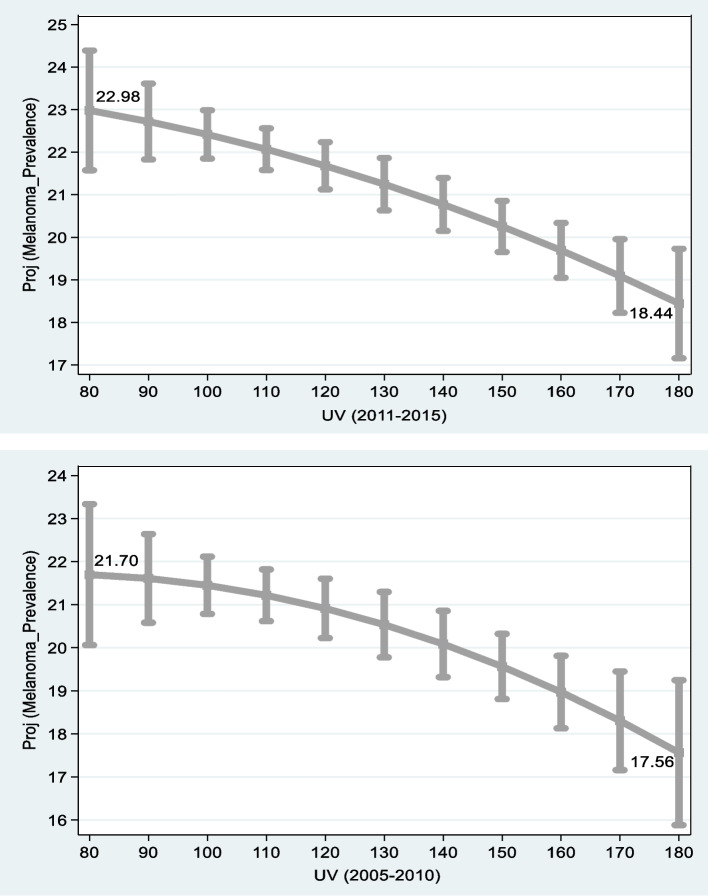
Method: Quadratic regression analysis. This model permits a non-monotonic variation of obesity with new melanoma cases adjusted for age, where the control variable is the level of UV radiation.

Results: Demonstrate a negative correlation between obesity and incidence of melanoma. This outcome is further corroborated for Caucasians.

Conclusions: We should continue to establish primary prevention of melanoma by raising photo protection awareness and secondary prevention by promoting skin screening (by physician or self) among the entire population group in all BMI ranges. Advanced secondary melanoma prevention including noninvasive diagnosis strategies including total body photography, confocal microscopy, AI strategies should focus the high-risk sub group of Caucasians with BMI < 30.

Keywords: Melanoma; Obesity; Risk factor.


Conflict of interest statement

Not Applicable.

Figures

Fig. 1
Fig. 1
Projected Rates of New Melanoma Cases vs. Prevalence of Obesity in US States. Notes: Sources: 1) Center for Disease Control and Prevention (CDC) [5]: Overweight & Obesity, Available at: https://www.cdc.gov/obesity/data/prevalence-maps.html 2) Center for Disease Control and Prevention (CDC) [6]: United States Cancer Statistics, available at: https://www.cdc.gov/cancer/uscs/ 3) [19], available at: https://www.cpc.ncep.noaa.gov/. Melanoma Prevalence = annual new melanoma cases per 100,000 persons adjusted for age. The graphs are based on the middle [right] columns of Table 4. The difference between the lower and upper graph emanates from the methodological changes in obesity measurement by the CDC starting from 2011
Fig. 2
Fig. 2
Projected Rates of New Melanoma Cases vs. UV wavelet in US States. Notes: Sources: 1) Center for Disease Control and Prevention (CDC) [5]: Overweight & Obesity, Available at: https://www.cdc.gov/obesity/data/prevalence-maps.html 2) Center for Disease Control and Prevention (CDC) [6]: United States Cancer Statistics, available at: https://www.cdc.gov/cancer/uscs/ 3) [19], available at: https://www.cpc.ncep.noaa.gov/. Melanoma Prevalence = annual new melanoma cases per 100,000 persons adjusted for age. The shorter the wavelet the higher the level of UV radiation. The graphs are based on the middle and right columns of Table 4
Fig. 3
Fig. 3
Melanoma and Obesity Prevalence: White vs. Black Population. Notes: Based on the right column of Table 5. The vertical axis at the top figure reflects the projected melanoma prevalence adjusted for age. The vertical axis at the bottom figure measures the white, black projected melanoma prevalence differences adjusted for age and their 95% confidence intervals for the same obesity prevalence. The horizontal axes in both figures measure obesity prevalence at the statewide level

References

    1. Arbel Y, Fialkoff C, Kerner A, Kerner M. Can reduction in infection and mortality rates from coronavirus be explained by an obesity survival paradox? An analysis at the US statewide level. Int J Obes. 2020;44(11):2339. doi: 10.1038/s41366-020-00680-7. - DOI - PMC - PubMed
    1. Arbel Y, Fialkoff C, Kerner A. The chicken and egg problem: obesity and the urban monocentric model. The J Real Estate Financ Econ. 2020;61(4):576. doi: 10.1007/s11146-019-09737-5. - DOI
    1. Asmaa MSG, Abd El-Aziz EA. Vitamin D reduces high-fat diet induced weight gain and C-reactive protein, increases interleukin-10, and reduces CD86 and caspase-3. Pathophysiology. 2017;24(1):31–37. doi: 10.1016/j.pathophys.2017.01.003. - DOI - PubMed
    1. Baldwin J, Janitz AE, Erb-Alvarez J, Snider C, Campbell JE. Prevalence and mortality of melanoma in Oklahoma among racial groups, 2000-2008. J Oklahoma State Med Assoc. 2016;109(7–8):311–316. - PMC - PubMed
    1. Center for Disease Control and Prevention (CDC) (n.d.-a): Overweight & Obesity, Available at: https://www.cdc.gov/obesity/data/prevalence-maps.html Accessed 22 Dec 2022.