. 2023 Feb 22;10(1):7.
doi: 10.1186/s40779-023-00441-3.

Single-cell transcriptomic dissection of the cellular and molecular events underlying the triclosan-induced liver fibrosis in mice

Affiliations

Single-cell transcriptomic dissection of the cellular and molecular events underlying the triclosan-induced liver fibrosis in mice

Yun-Meng Bai et al. Mil Med Res. .

Abstract

Background: Triclosan [5-chloro-2-(2,4-dichlorophenoxy) phenol, TCS], a common antimicrobial additive in many personal care and health care products, is frequently detected in human blood and urine. Therefore, it has been considered an emerging and potentially toxic pollutant in recent years. Long-term exposure to TCS has been suggested to exert endocrine disruption effects, and promote liver fibrogenesis and tumorigenesis. This study was aimed at clarifying the underlying cellular and molecular mechanisms of hepatotoxicity effect of TCS at the initiation stage.

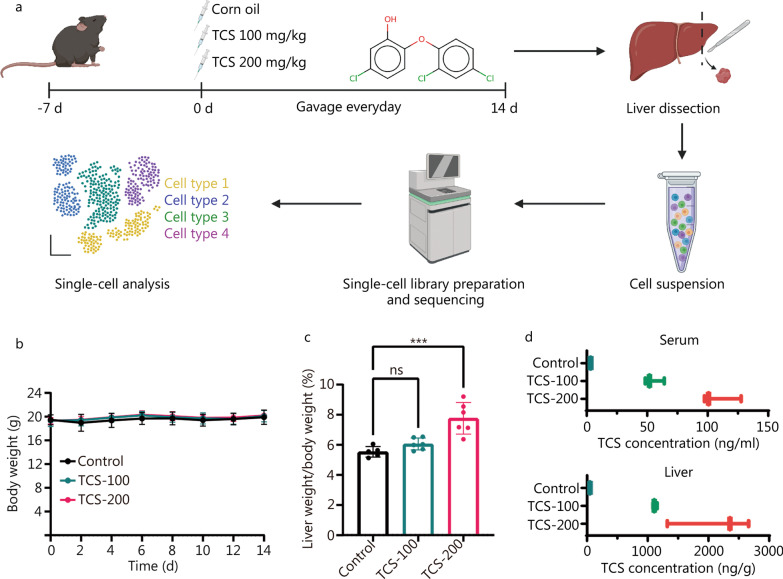
Methods: C57BL/6 mice were exposed to different dosages of TCS for 2 weeks and the organ toxicity was evaluated by various measurements including complete blood count, histological analysis and TCS quantification. Single cell RNA sequencing (scRNA-seq) was then carried out on TCS- or mock-treated mouse livers to delineate the TCS-induced hepatotoxicity. The acquired single-cell transcriptomic data were analyzed from different aspects including differential gene expression, transcription factor (TF) regulatory network, pseudotime trajectory, and cellular communication, to systematically dissect the molecular and cellular events after TCS exposure. To verify the TCS-induced liver fibrosis, the expression levels of key fibrogenic proteins were examined by Western blotting, immunofluorescence, Masson's trichrome and Sirius red staining. In addition, normal hepatocyte cell MIHA and hepatic stellate cell LX-2 were used as in vitro cell models to experimentally validate the effects of TCS by immunological, proteomic and metabolomic technologies.

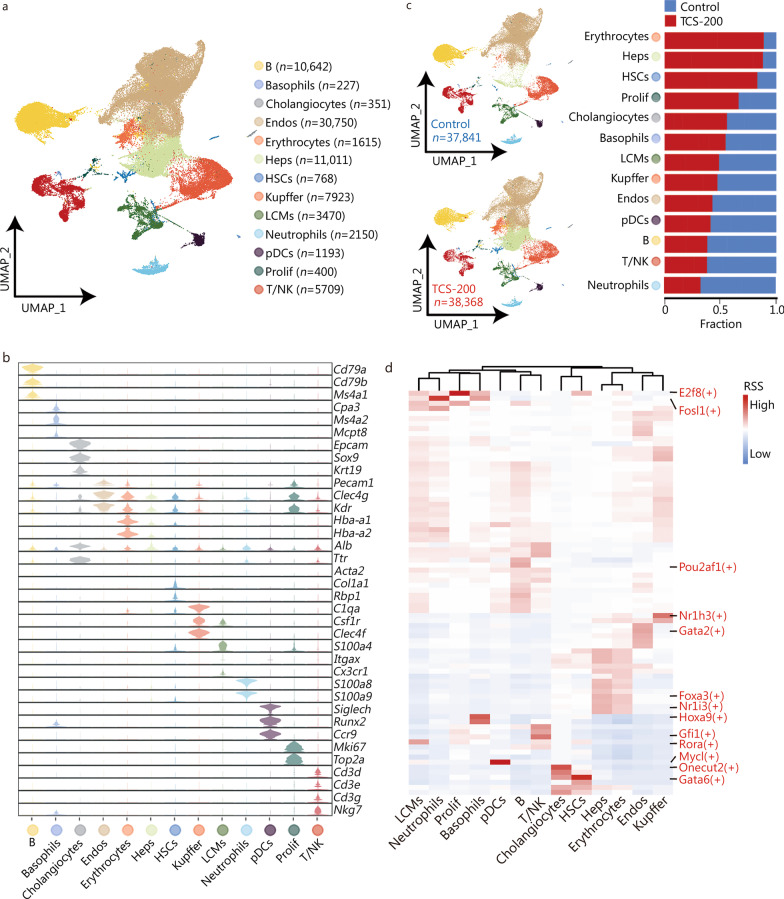
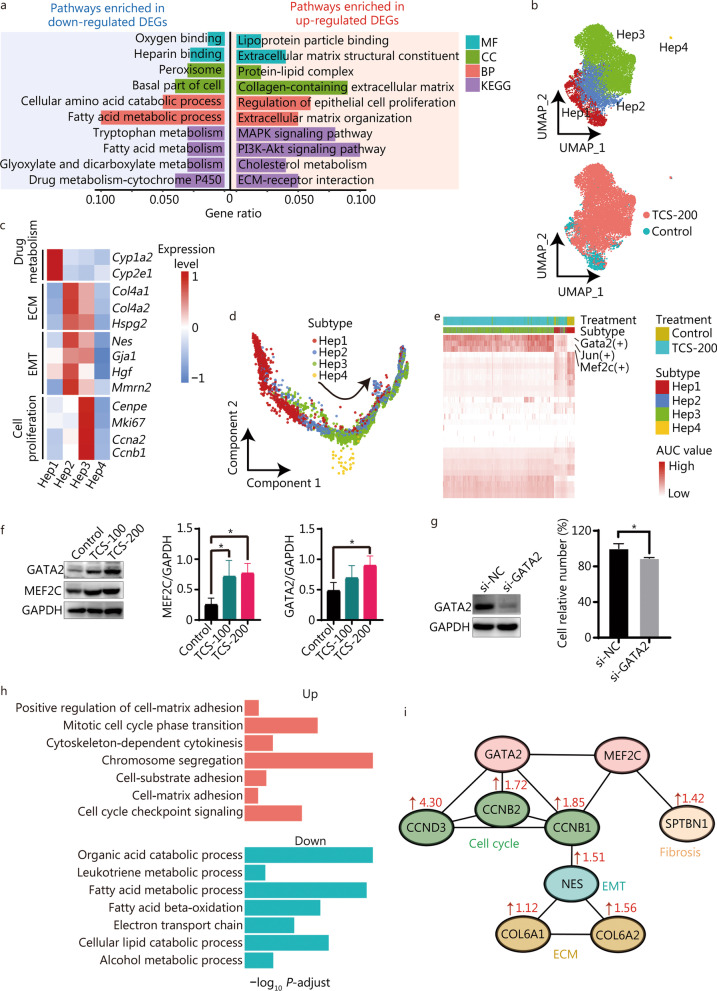
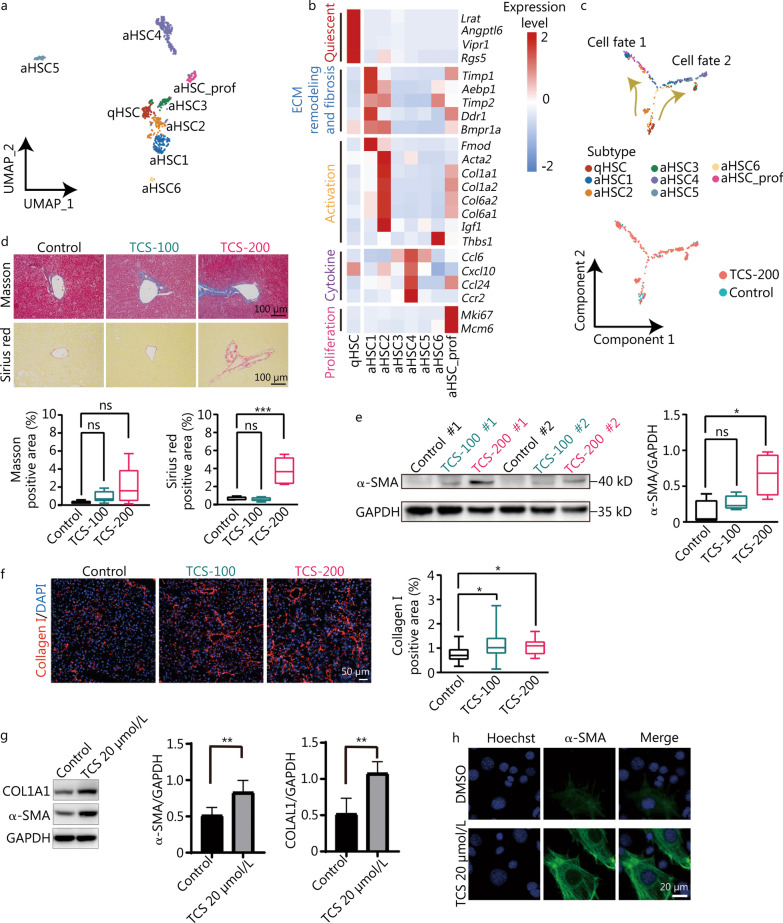
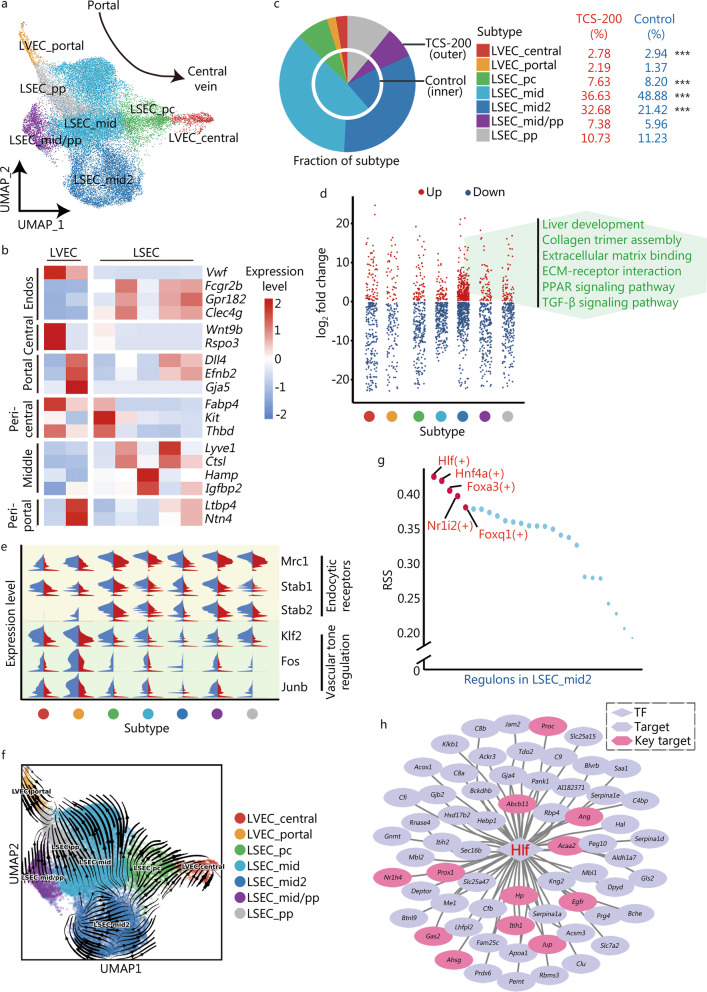
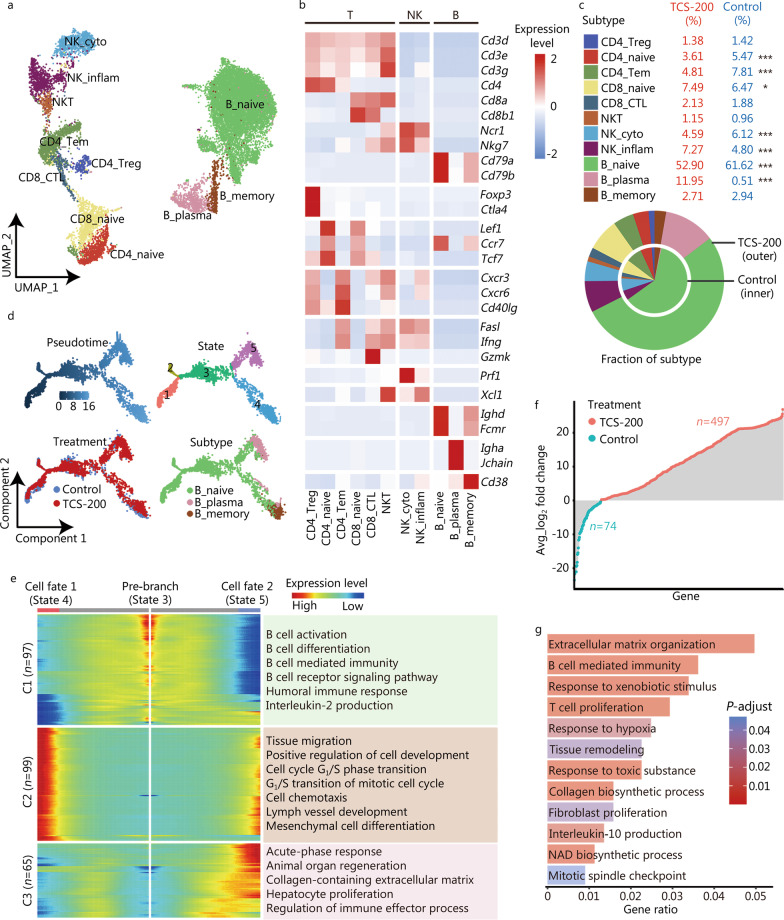
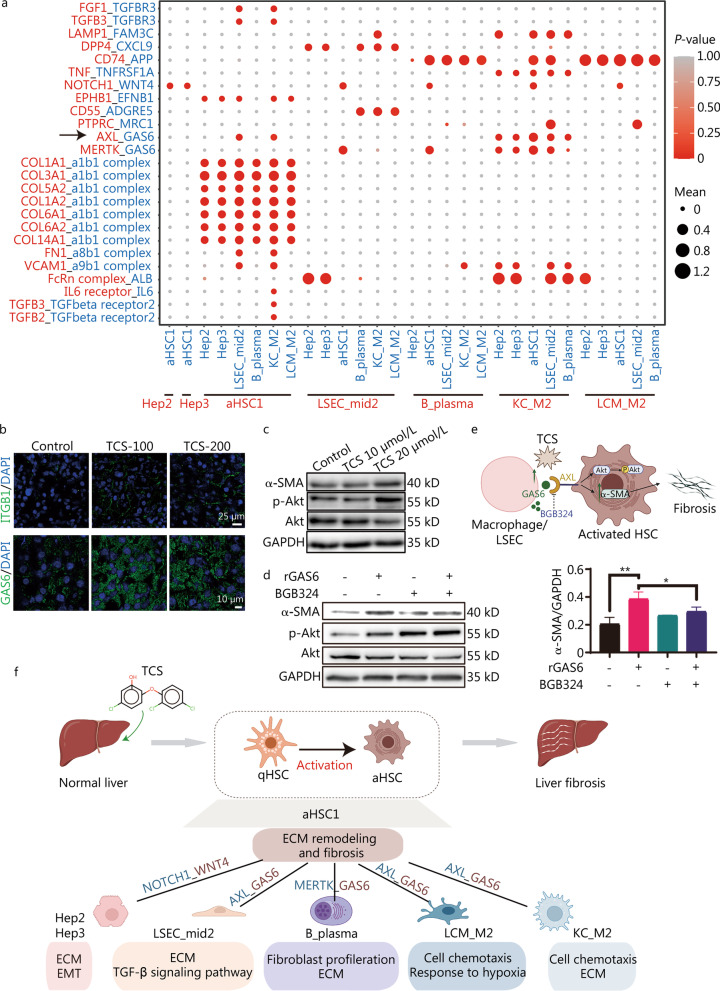
Results: We established a relatively short term TCS exposure murine model and found the TCS mainly accumulated in the liver. The scRNA-seq performed on the livers of the TCS-treated and control group profiled the gene expressions of > 76,000 cells belonging to 13 major cell types. Among these types, hepatocytes and hepatic stellate cells (HSCs) were significantly increased in TCS-treated group. We found that TCS promoted fibrosis-associated proliferation of hepatocytes, in which Gata2 and Mef2c are the key driving TFs. Our data also suggested that TCS induced the proliferation and activation of HSCs, which was experimentally verified in both liver tissue and cell model. In addition, other changes including the dysfunction and capillarization of endothelial cells, an increase of fibrotic characteristics in B plasma cells, and M2 phenotype-skewing of macrophage cells, were also deduced from the scRNA-seq analysis, and these changes are likely to contribute to the progression of liver fibrosis. Lastly, the key differential ligand-receptor pairs involved in cellular communications were identified and we confirmed the role of GAS6_AXL interaction-mediated cellular communication in promoting liver fibrosis.

Conclusions: TCS modulates the cellular activities and fates of several specific cell types (including hepatocytes, HSCs, endothelial cells, B cells, Kupffer cells and liver capsular macrophages) in the liver, and regulates the ligand-receptor interactions between these cells, thereby promoting the proliferation and activation of HSCs, leading to liver fibrosis. Overall, we provide the first comprehensive single-cell atlas of mouse livers in response to TCS and delineate the key cellular and molecular processes involved in TCS-induced hepatotoxicity and fibrosis.

Keywords: Hepatic stellate cell; Liver fibrogenesis; Triclosan; scRNA-seq.


Conflict of interest statement

The authors declare that they have no competing interests.

Figures

Fig. 1
Fig. 1
TCS induced hepatocyte hypertrophy in mice liver. a Experimental scheme and workflow diagram. b Body weight of mice in different groups. c The liver/body weight ratio in different groups (n = 6). d The TCS concentrations in mice serum and liver tissues after 14 d treatment (n = 3). TCS triclosan, ns non-significant, ***P < 0.001
Fig. 2
Fig. 2
Cell diversity in mice liver cells delineated by single-cell transcriptome. a UMAP visualization of 13 cell types based on 76,209 single-cell transcriptomes. Cell counts for each individual cell type are indicated in parentheses. Each dot represents a single cell. b Violin plots showing the expression levels of representative markers in each cell type. c Distribution of each cell type in control and TCS-200 groups. The bar chart showed the relative fraction of each cell type in different groups. d Heatmap of transcription factor (TF) activities in each cell type. UMAP Uniform Manifold Approximation and Projection for Dimension Reduction, Endos endothelial cells, Heps hepatocytes, HSCs hepatic stellate cells, LCMs liver capsular macrophages, pDCs plasmacytoid dendritic cells, Prolif proliferative cells, T/NK T/natural killer cells, TCS triclosan, RSS regulon specificity score
Fig. 3
Fig. 3
Heterogeneity of hepatocytes (Heps) and their differentiation states. a Functional enrichment in the down-regulated (left) and up-regulated (right) DEGs of TCS-200 group vs. control group. b UMAP visualization of distinct subtypes of Heps and their distributions in different groups. c Heatmap of expression levels of representative markers involved in drug metabolism, ECM, EMT and cell proliferation. d Pseudotime trajectory indicating the development of four subtypes, rooting from Hep1. e Heatmap showing AUC values of the expression levels of TFs in different subtypes. f The protein level of GATA2 and MEF2C in mice liver were detected by Western blotting. g Cell viability measured by CCK-8 assay after 72 h after transfection with si-NC for NC (normal control) or si-GATA2. h Bar plots showing the biological processes enrich up- and down-regulated DEPs after TCS treatment. i The potential regulatory relationship of GATA2 and MEF2C controlled downstream proteins leading to cell proliferation, ECM reorganization and liver fibrosis. Numbers indicate the fold change of protein between TCS-200 and control groups from proteomics dataset. TCS triclosan, DEGs differentially expressed genes, ECM extracellular matrix, MF molecular function, CC cellular component, BP biological process, KEGG Kyoto Encyclopedia of Genes and Genomes, AUC area under the curve, TF transcription factor, UMAP uniform manifold approximation and projection for dimension reduction, EMT epithelial-mesenchymal transition
Fig. 4
Fig. 4
Transcriptomic roadmap of HSCs activation. a UMAP visualization of eight distinct subtypes of HSCs. b Heatmap of expression levels of representative markers related to cell quiescence, ECM remodeling and fibrosis, activation, cytokine and proliferation. c Pseudotime trajectory indicating the development of HSCs subtypes. Cell fate 1 represents trajectory from qHSC to aHSC1, cell fate 2 represents from qHSC to aHSC4. d Masson and Sirius red staining and the corresponding quantification of Masson- and Sirius red-positive areas (n = 5). Scale bar = 1000 μm. e Western blotting analysis of α-SMA expression levels in mice liver with or without TCS treatment, and the corresponding quantification of α-SMA protein expression levels, relative to GADPH loading control (n = 4). f Immunofluorescence staining of collagen I on mouse liver frozen sections (n = 4). The collagen I positive area was analyzed by ImageJ. Scale bar = 50 μm. g The protein expression of COL1A1 and α-SMA in LX-2 cells after TCS treatment. h Immunofluorescence staining of α-SMA in LX-2 cells after TCS or DMSO treatment. Scale bar = 20 μm. HSCs hepatic stellate cells, UMAP uniform manifold approximation and projection for dimension reduction, qHSC quiescent hepatic stellate cells, aHSC activated hepatic stellate cells, ECM extracellular matrix, TCS triclosan, α-SMA alpha smooth muscle actin, ns non-significant; *P < 0.05, **P < 0.01
Fig. 5
Fig. 5
Distinct endothelial cells according to the spatial locations. a UMAP visualization of the 7 distinct subtypes of Endos based on spatial distribution. b Heatmap of the expression levels of representative markers indicating generalized Endos as well as central, pericentral, middle, periportal and portal position. c Pie chart showing the fraction of each endothelial subtype. d Strip chart showing DEGs of each subtype after TCS-200 treatment. The texts in green color represents the pathways enriched in the up-regulated DEGs in LSEC_mid2. e Split violin plot of the expression levels of genes associated with endocytic receptors and vascular tone regulation. f RNA velocity analysis of different subtypes of Endos, indicating LSEC capillarization. g Scatter diagram showing RSS of TFs in LSEC_mid2 subtype. The top 5 TFs ordered by scores were listed. h Transcription regulatory network constructed by Hlf and its target genes. Red text represents TFs, black text for targets (target), pink hexagon for genes related to ECM, tissue remodeling and response to hypoxia (key target). Endos endothelial cells, LVEC liver vascular endothelial cells, LSEC liver sinusoidal endothelial cells, UMAP uniform manifold approximation and projection for dimension reduction, DEGs differentially expressed genes, TCS triclosan, ECM extracellular matrix, RSS regulon specificity score, TFs transcription factors; ***P < 0.001
Fig. 6
Fig. 6
Dynamic regulation of lymphocytes after TCS treatment. a UMAP visualization of distinct subtypes of lymphocytes including B, T and NK cells. b Heatmap of the expression levels of representative markers indicating lymphocytes, regulatory, naive, memory, effector, cytotoxic, and inflammatory functions. c Pie chart showing the relative fraction of each lymphocyte subtype. d Pseudotime trajectory indicating the development of B cell subtypes. The different color schemes represent the segregation based on pseudotime, cell state, treatment and subtype, respectively. e BEAM showing genes involved in the differential development of cell fate 1 (State 4) and cell fate 2 (State 5), and the enriched GO terms were listed at right. f Lollipop chart depicting the DEGs of B plasma cells after the TCS-200 treatment. Red represents up-regulated and blue represents down-regulated genes. g Bar graph showing the functions enriched in up-regulated DEGs of B plasma cells after the TCS-200 treatment. Length represents gene ratio and color represents adjusted P value. UMAP uniform manifold approximation and projection for dimension reduction, NK natural killer cells, C1 cluster 1, C2 cluster 2, C3 cluster 3, BEAM branched expression analysis modeling, GO Gene Ontology, DEGs differentially expressed genes, TCS triclosan; *P < 0.05, ***P < 0.001
Fig. 7
Fig. 7
Cell–cell communication crosstalk of different cell types. a Dot plot depicting ligand-receptor pairs within different subtypes. Circle sizes indicate mean expression of pairs and colors indicated enrichment of P-values in the two subtypes. b Immunofluorescence staining of ITGB1 (top) and GAS6 (bottom) on mouse liver frozen sections. Scale bar = 25 μm (top) and scale bar = 10 μm (bottom). c LX-2 cells were treated with indicated concentration of TCS for 24 h, and the expression of α-SMA, p-Akt and total Akt were examined with Western blotting, GAPDH was used as loading control. d LX-2 cells were incubated with 500 ng/ml rGAS6 for 30 min and/or pre-incubated with BGB324 (1 μmol/L, 30 min), and the expression of α-SMA, p-Akt and total Akt were examined with Western blotting, GAPDH was used as loading control. e Scheme showing the potential fibrosis-related mechanism caused by the combination of GAS6 and AXL in HSCs. f Summary and inference of cellular communication induced by TCS on mice liver. ITGB1 integrin beta 1, TCS triclosan, α-SMA alpha smooth muscle actin, p-Akt phosphorylated Akt, rGAS6 recombinant GAS6, HSCs hepatic stellate cells, LSEC liver sinusoidal endothelial cells, qHSC quiescent hepatic stellate cells, aHSC activated hepatic stellate cells, ECM extracellular matrix, EMT epithelial-mesenchymal transition; *P < 0.05, **P < 0.01

References

    1. Yueh MF, Tukey RH. Triclosan: a widespread environmental toxicant with many biological effects. Annu Rev Pharmacol Toxicol. 2016;56:251–272. doi: 10.1146/annurev-pharmtox-010715-103417. - DOI - PMC - PubMed
    1. Rodricks JV, Swenberg JA, Borzelleca JF, Maronpot RR, Shipp AM. Triclosan: a critical review of the experimental data and development of margins of safety for consumer products. Crit Rev Toxicol. 2010;40(5):422–484. doi: 10.3109/10408441003667514. - DOI - PubMed
    1. FDA. FDA issues final rule on safety and effectiveness of consumer hand sanitizers. 2019. https://www.fda.gov/news-events/press-announcements/fda-issues-final-rul....
    1. Lee JD, Lee JY, Kwack SJ, Shin CY, Jang HJ, Kim HY, et al. Risk assessment of triclosan, a cosmetic preservative. Toxicol Res. 2019;35(2):137–154. doi: 10.5487/TR.2019.35.2.137. - DOI - PMC - PubMed
    1. Weatherly LM, Gosse JA. Triclosan exposure, transformation, and human health effects. J Toxicol Environ Health B Crit Rev. 2017;20(8):447–469. doi: 10.1080/10937404.2017.1399306. - DOI - PMC - PubMed

Publication types