

Super-exponential growth and stochastic size dynamics in rod-like bacteria
- PMID: 36814380
- PMCID: PMC10111284
- DOI: 10.1016/j.bpj.2023.02.015
Super-exponential growth and stochastic size dynamics in rod-like bacteria
Abstract
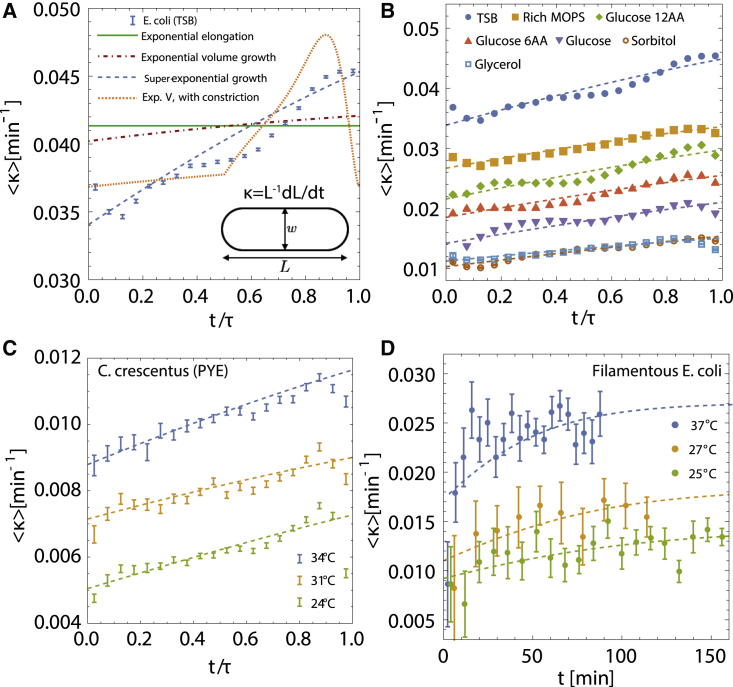
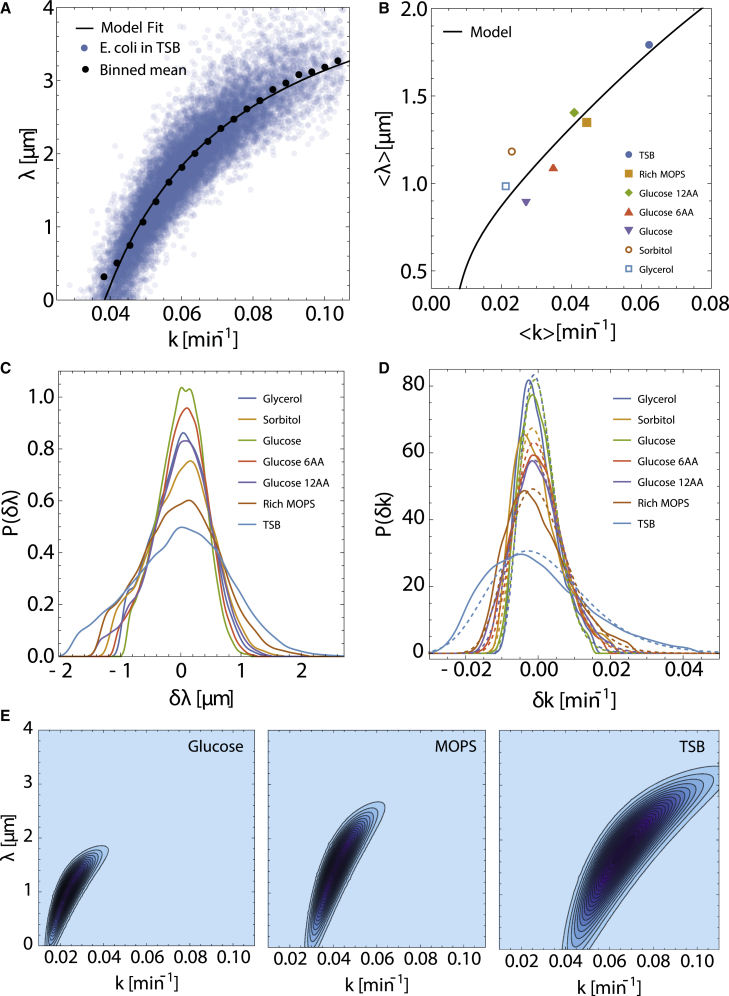
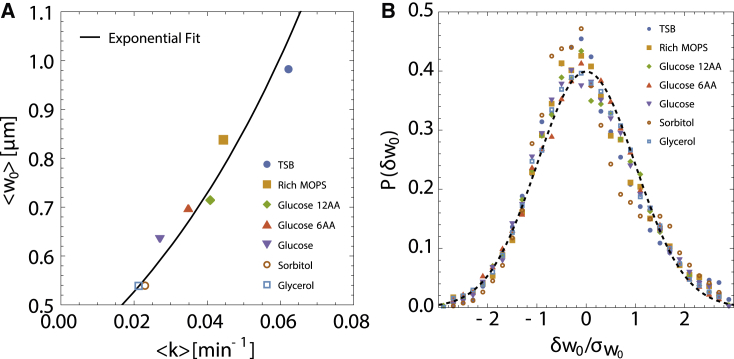
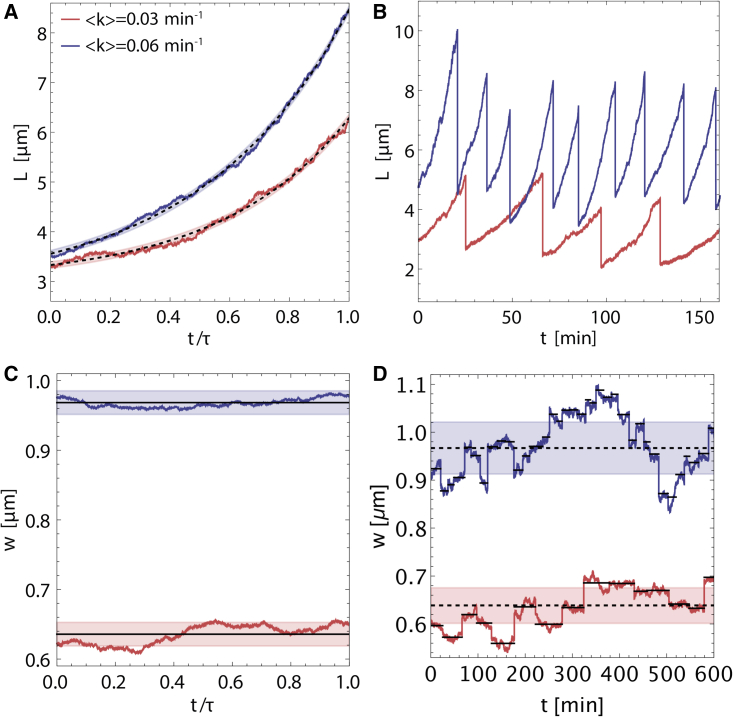
Proliferating bacterial cells exhibit stochastic growth and size dynamics, but the regulation of noise in bacterial growth and morphogenesis remains poorly understood. A quantitative understanding of morphogenetic noise control, and how it changes under different growth conditions, would provide better insights into cell-to-cell variability and intergenerational fluctuations in cell physiology. Using multigenerational growth and width data of single Escherichia coli and Caulobacter crescentus cells, we deduce the equations governing growth and size dynamics of rod-like bacterial cells. Interestingly, we find that both E. coli and C. crescentus cells deviate from exponential growth within the cell cycle. In particular, the exponential growth rate increases during the cell cycle irrespective of nutrient or temperature conditions. We propose a mechanistic model that explains the emergence of super-exponential growth from autocatalytic production of ribosomes coupled to the rate of cell elongation and surface area synthesis. Using this new model and statistical inference on large datasets, we construct the Langevin equations governing cell growth and size dynamics of E. coli cells in different nutrient conditions. The single-cell level model predicts how noise in intragenerational and intergenerational processes regulate variability in cell morphology and generation times, revealing quantitative strategies for cellular resource allocation and morphogenetic noise control in different growth conditions.
Copyright © 2023 Biophysical Society. Published by Elsevier Inc. All rights reserved.
Conflict of interest statement
Declaration of interests The authors declare no competing interests.
Figures
Similar articles
-
Scaling laws governing stochastic growth and division of single bacterial cells.Proc Natl Acad Sci U S A. 2014 Nov 11;111(45):15912-7. doi: 10.1073/pnas.1403232111. Epub 2014 Oct 27. Proc Natl Acad Sci U S A. 2014. PMID: 25349411 Free PMC article.
-
Biphasic growth dynamics control cell division in Caulobacter crescentus.Nat Microbiol. 2017 Jul 24;2:17116. doi: 10.1038/nmicrobiol.2017.116. Nat Microbiol. 2017. PMID: 28737755
-
Scaling of stochastic growth and division dynamics: A comparative study of individual rod-shaped cells in the Mother Machine and SChemostat platforms.Mol Biol Cell. 2024 Jun 1;35(6):ar78. doi: 10.1091/mbc.E23-11-0452. Epub 2024 Apr 10. Mol Biol Cell. 2024. PMID: 38598301 Free PMC article.
-
Shapeshifting to Survive: Shape Determination and Regulation in Caulobacter crescentus.Trends Microbiol. 2017 Aug;25(8):673-687. doi: 10.1016/j.tim.2017.03.006. Epub 2017 Mar 27. Trends Microbiol. 2017. PMID: 28359631 Free PMC article. Review.
-
Spatial regulation in Caulobacter crescentus.Curr Opin Microbiol. 2009 Dec;12(6):715-21. doi: 10.1016/j.mib.2009.09.013. Epub 2009 Oct 23. Curr Opin Microbiol. 2009. PMID: 19854671 Review.
Cited by
-
Differential growth regulates asymmetric size partitioning in Caulobacter crescentus.Life Sci Alliance. 2024 May 28;7(8):e202402591. doi: 10.26508/lsa.202402591. Print 2024 Aug. Life Sci Alliance. 2024. PMID: 38806218 Free PMC article.
-
A Generalized Adder mechanism for Cell Size Homeostasis: Implications for Stochastic Dynamics of Clonal Proliferation.bioRxiv [Preprint]. 2024 Sep 19:2024.09.13.612972. doi: 10.1101/2024.09.13.612972. bioRxiv. 2024. PMID: 39345437 Free PMC article. Preprint.
-
Coupling of cell growth modulation to asymmetric division and cell cycle regulation in Caulobacter crescentus.Proc Natl Acad Sci U S A. 2024 Oct 8;121(41):e2406397121. doi: 10.1073/pnas.2406397121. Epub 2024 Oct 3. Proc Natl Acad Sci U S A. 2024. PMID: 39361646 Free PMC article.
-
Dynamic proteome trade-offs regulate bacterial cell size and growth in fluctuating nutrient environments.Commun Biol. 2023 May 5;6(1):486. doi: 10.1038/s42003-023-04865-4. Commun Biol. 2023. PMID: 37147517 Free PMC article.
-
Single-cell imaging of the Mycobacterium tuberculosis cell cycle reveals linear and heterogenous growth.Nat Microbiol. 2024 Dec;9(12):3332-3344. doi: 10.1038/s41564-024-01846-z. Epub 2024 Nov 15. Nat Microbiol. 2024. PMID: 39548343 Free PMC article.
References
-
- Wang P., Robert L., et al. Jun S. Robust growth of Escherichia coli. Curr. Biol. 2010;20:1099–1103. https://www.sciencedirect.com/science/article/pii/S0960982210005245 - PMC - PubMed
-
- Taheri-Araghi S., et al. Jun S. Cell-size control and homeostasis in bacteria. Curr. Biol. 2015;25:385–391. https://www.sciencedirect.com/science/article/pii/S0960982214015735 - PMC - PubMed
Publication types
MeSH terms
Grants and funding
LinkOut - more resources
Full Text Sources
