. 2023 May;98(5):770-783.
doi: 10.1002/ajh.26889. Epub 2023 Mar 9.

Phenotypic characterization of disease-initiating stem cells in JAK2- or CALR-mutated myeloproliferative neoplasms

Affiliations

Phenotypic characterization of disease-initiating stem cells in JAK2- or CALR-mutated myeloproliferative neoplasms

Daniel Ivanov et al. Am J Hematol. 2023 May.

Abstract

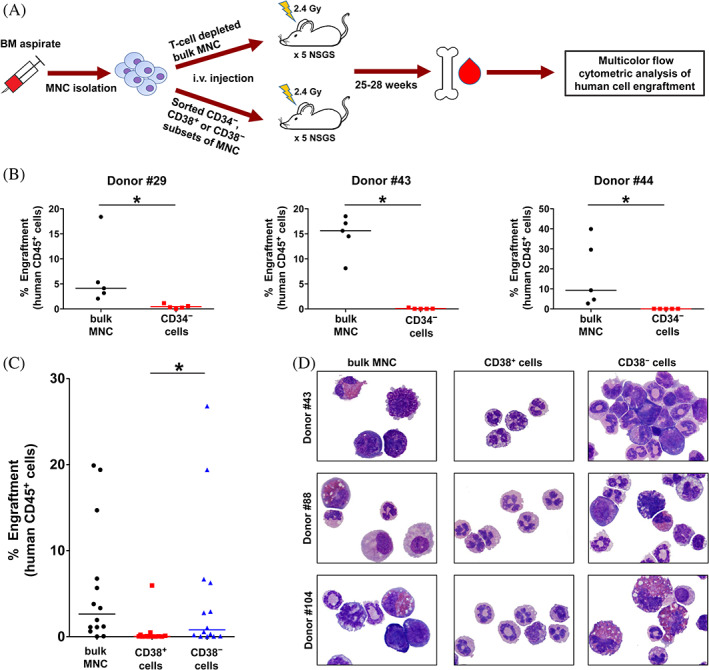
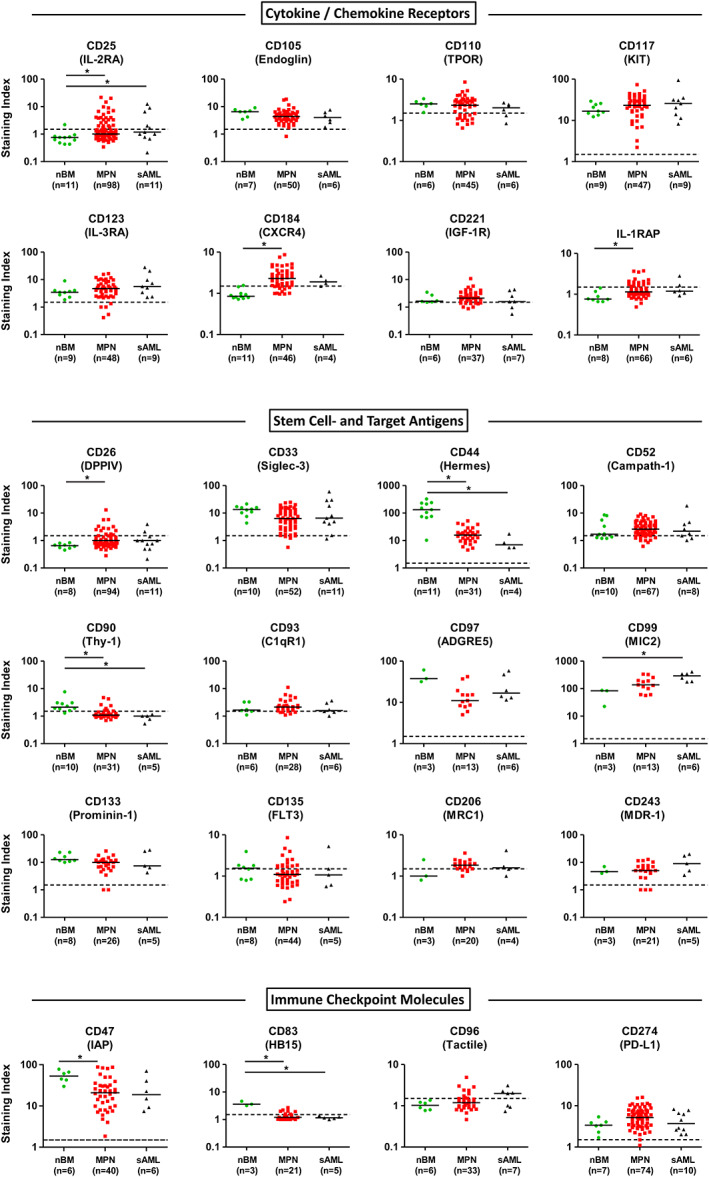
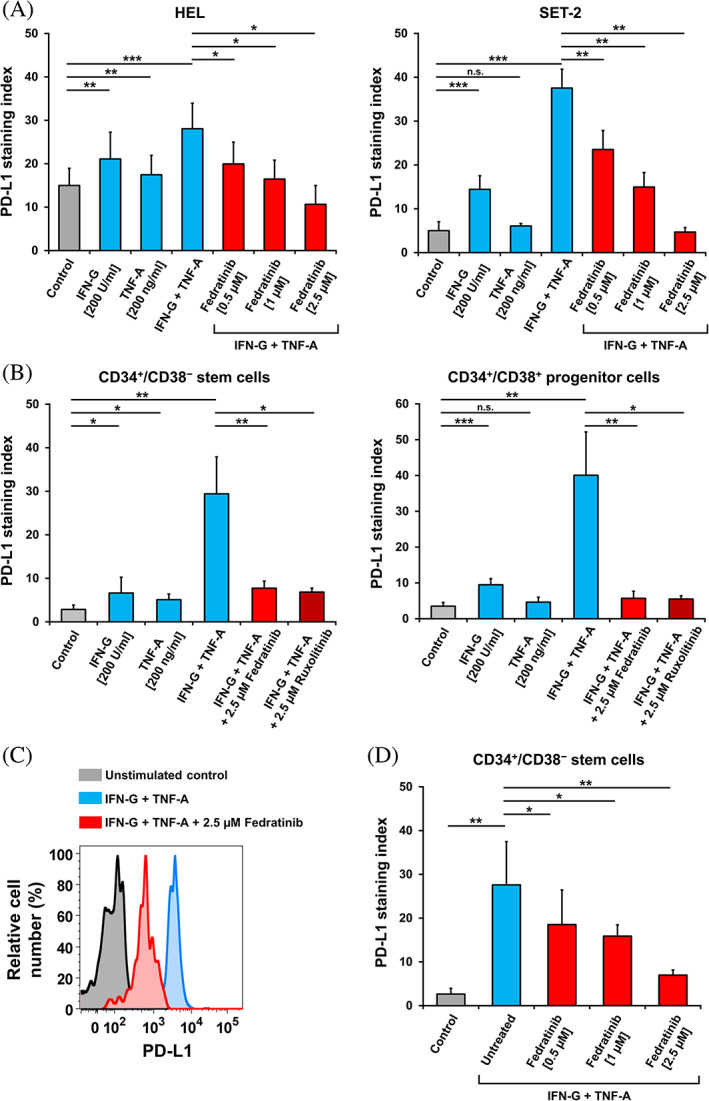
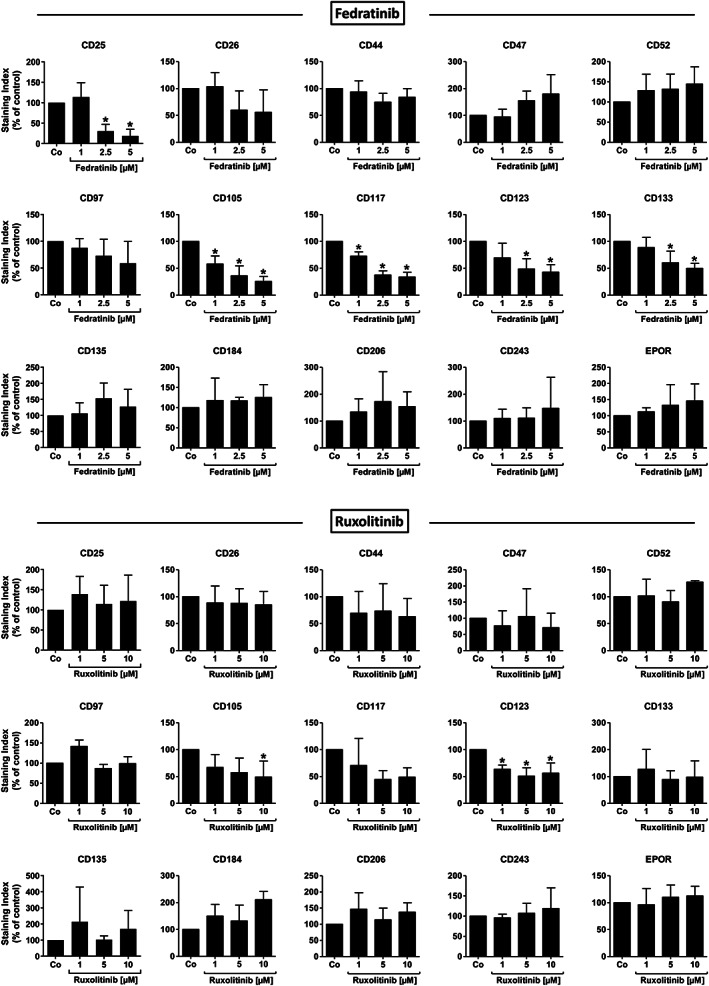
Myeloproliferative neoplasms (MPN) are characterized by uncontrolled expansion of myeloid cells, disease-related mutations in certain driver-genes including JAK2, CALR, and MPL, and a substantial risk to progress to secondary acute myeloid leukemia (sAML). Although behaving as stem cell neoplasms, little is known about disease-initiating stem cells in MPN. We established the phenotype of putative CD34+ /CD38- stem cells and CD34+ /CD38+ progenitor cells in MPN. A total of 111 patients with MPN suffering from polycythemia vera, essential thrombocythemia, or primary myelofibrosis (PMF) were examined. In almost all patients tested, CD34+ /CD38- stem cells expressed CD33, CD44, CD47, CD52, CD97, CD99, CD105, CD117, CD123, CD133, CD184, CD243, and CD274 (PD-L1). In patients with PMF, MPN stem cells often expressed CD25 and sometimes also CD26 in an aberrant manner. MPN stem cells did not exhibit substantial amounts of CD90, CD273 (PD-L2), CD279 (PD-1), CD366 (TIM-3), CD371 (CLL-1), or IL-1RAP. The phenotype of CD34+ /CD38- stem cells did not change profoundly during progression to sAML. The disease-initiating capacity of putative MPN stem cells was confirmed in NSGS mice. Whereas CD34+ /CD38- MPN cells engrafted in NSGS mice, no substantial engraftment was produced by CD34+ /CD38+ or CD34- cells. The JAK2-targeting drug fedratinib and the BRD4 degrader dBET6 induced apoptosis and suppressed proliferation in MPN stem cells. Together, MPN stem cells display a unique phenotype, including cytokine receptors, immune checkpoint molecules, and other clinically relevant target antigens. Phenotypic characterization of neoplastic stem cells in MPN and sAML should facilitate their enrichment and the development of stem cell-eradicating (curative) therapies.


Conflict of interest statement

P.V. received research grants from Celgene/BMS and AOP Orphan, and received consultancy honoraria from Novartis, Celgene/BMS, Pfizer, Incyte, and AOP Orphan. S.M.S. received travel support from Kite/Gilead and honoraria from Novartis, Jazz Pharmaceutics, Amgen, Celgene/BMS, Gilead, Servier, and AbbVie. M.F. received honoraria from Novartis, Amgen, Takeda, Celgene/BMS, Sanofi‐Aventis, Diagnosia, Sobi, MedAHEAD. T.S. received honoraria from Novartis, AbbVie, and Celgene/BMS. M.K. received honoraria from Amgen, Celgene/BMS, Janssen, Takeda, Pfizer, Sanofi, GSK, AbbVie, Novartis, and AOP Orphan. W.R.S. received honoraria from Novartis, Pfizer, AbbVie, Daiichi Sankyo, Stem line, Thermo Fisher, Deciphera, Celgene/BMS, and Jazz. E.K. received consultancy honoraria from AbbVie, Astellas, Jazz, Servier, and Celgene/BMS. M.P. received honoraria from Celgene/BMS, AbbVie, Jazz, Novartis, Sobi, and Takeda. The other authors declare no conflict of interest.

Figures

FIGURE 1
FIGURE 1
NSGS‐engrafting NSC preferentially reside in a CD34+/CD38 MPN cell fraction. (A) Experimental design: BM derived MNC were T cell‐depleted and then sorted to obtain CD34 cells (stem/progenitor cell‐depleted), CD38+ cells (progenitor enriched), and CD38 cells (stem cell‐containing and progenitor‐depleted). Sorted cells were injected i.v. into sublethally irradiated NSGS mice. After 25–28 weeks, mice were sacrificed and engraftment of human cells in the BM of NSGS mice was evaluated by multicolor flow cytometry (Figure S2). (B) T cell‐depleted bulk MNC or purified CD34 cells obtained from patients with ET (#29) or PV (#43 and #44) were i.v. injected into NSGS mice. After 28 weeks, mice were sacrificed and engraftment of human CD45+ cells (expressed as percentage of all BM cells) was evaluated by multicolor flow cytometry. Each dot represents the engraftment level in an individual mouse. The horizontal lines show the median of the percentage of engrafted human CD45+ cells. (C) Engraftment of human CD45+ cells from 3 MPN donors (#43, #88, and #104) in the BM of NSGS mice. T cell‐depleted bulk MNC or purified CD38+ and CD38 cells were i.v. injected into irradiated NSGS mice. After 25 weeks, mice were sacrificed and engraftment of human CD45+ cells (expressed as percentage of all BM cells) was evaluated by multicolor flow cytometry. Each dot represents the engraftment level in an individual mouse. The horizontal lines show the median of the percentage of engrafted human CD45+ cells. Statistical significance of differences in engraftment rates in various cohorts of NSGS mice was calculated using Mann–Whitney U‐test (*p < .05). (D) Cytospin preparations of BM cells obtained from the injected mice were stained with Wright‐Giemsa and then examined under a light microscope (magnification, ×100). The figure shows engrafted human MPN cells (left and right columns) or lack of engraftment of human cells (only small murine neutrophilic granulocytes, middle column). Patient numbers (#) refer to Table S2. BM, bone marrow; ET, essential thrombocythemia; Gy, gray; i.v., intravenous; MNC, mononuclear cells; MPN, myeloproliferative neoplasm; NSC, neoplastic stem cells; PV, polycythemia vera. [Color figure can be viewed at wileyonlinelibrary.com]
FIGURE 2
FIGURE 2
Expression of cell surface markers and targets on MPN NSC and sAML LSC. Samples from patients with MPN, sAML or healthy control samples were stained with fluorochrome‐labeled antibodies and stem cells were identified as CD34+/CD38 cells (Figure S1). Expression of markers and targets on nBM HSC (green dots), MPN NSC (red squares) and post‐MPN sAML LSC (black triangles) was analyzed by multicolor flow cytometry. Results are expressed as staining index (median fluorescence intensity of the indicated marker divided by the median fluorescence intensity of the isotype control). Each symbol represents a single donor. Horizontal lines show the median expression level in each cohort. Dotted horizontal lines represent the cut‐off values for negativity (staining index <1.5). Significance levels of differences in expression of markers and targets on CD34+/CD38 stem cells between healthy controls, MPN patients and post‐MPN sAML patients were analyzed by Kruskal–Wallis test followed by Dunn's multiple comparisons post hoc test (*p < .05). C1qR1, complement C1q receptor; CD, cluster of differentiation; CXCR4, chemokine C‐X‐C motif receptor 4; DPPIV, dipeptidyl peptidase IV; FLT3, FMS‐like tyrosine kinase 3; HSC, hematopoietic stem cells; IAP, integrin associated protein; IGF‐1R, insulin‐like growth factor 1 receptor; IL‐1RAP, interleukin‐1 receptor accessory protein; IL‐3RA, interleukin‐3 receptor alpha chain; LSC, leukemic stem cells; MDR‐1, multidrug resistance protein 1; MPN, myeloproliferative neoplasm; MRC1, mannose receptor C‐type 1; nBM, normal bone marrow; NSC, neoplastic stem cells; sAML, post‐MPN secondary acute myeloid leukemia; TPOR, thrombopoietin receptor. [Color figure can be viewed at wileyonlinelibrary.com]
FIGURE 3
FIGURE 3
JAK2 inhibitors downregulate cytokine‐induced PD‐L1 expression on MPN cells. (A) JAK2V617F+ cell lines HEL and SET‐2 were incubated in control medium or medium containing either IFN‐G (200 U/mL), TNF‐A (200 ng/mL) or combination of both cytokines with or without fedratinib (0.5–2.5 μM) at 37°C for 24 h. Expression of PD‐L1 was determined by flow cytometry and presented as staining index (median fluorescence intensity of PD‐L1 divided by the median fluorescence intensity of the isotype control). Results represent the mean ± SD from at least three independent experiments. (B) Primary MNC from JAK2V617F+ MPN patients were incubated in control medium or medium containing either IFN‐G (200 U/mL), TNF‐A (200 ng/mL) or combination of both cytokines at 37°C and treated with fedratinib or ruxolitinib for 24 h. Expression of PD‐L1 levels on MPN CD34+/CD38 stem cells and CD34+/CD38+ progenitor cells was evaluated by flow cytometry and shown as staining index. Results represent the mean ± SD from five JAK2V617F+ MPN patients. (C) Representative histograms, showing the cytokine‐induced expression of PD‐L1 on MPN CD34+/CD38 stem cells (blue histogram) and the followed downregulation (red histogram) of PD‐L1 expression upon incubation with fedratinib. (D) Primary MNC from JAK2V617F+ MPN patients were incubated in control medium or medium containing combination of IFN‐G (200 U/mL) and TNF‐A (200 ng/mL) at 37°C and treated with fedratinib (0.5–2.5 μM) for 24 h. Expression of PD‐L1 levels on MPN CD34+/CD38 stem cells was evaluated by flow cytometry and shown as staining index. Results represent the mean ± SD from three JAK2V617F+ MPN patients. Significance levels of differences in expression of PD‐L1 between the different conditions were analyzed by Student's t‐test (*p < .05; **p < .01; ***p < .001). IFN‐G, interferon‐gamma; MNC, mononuclear cells; MPN, myeloproliferative neoplasm; n.s., not significant; PD‐L1, programmed cell death ligand‐1; TNF‐A, tumor necrosis factor‐alpha. [Color figure can be viewed at wileyonlinelibrary.com]
FIGURE 4
FIGURE 4
Effects of JAK2 inhibitors on expression of target antigens in MPN NSC. Primary MNC from JAK2V617F+ MPN patients were incubated in control medium (Co) or medium containing fedratinib (1–5 μM) or ruxolitinib (1–10 μM) at 37°C for 24 h. Expression of selected cell surface antigens (up‐ or down‐regulated on MPN stem cells) on CD34+/CD38 stem cells were evaluated by multicolor flow cytometry and shown as staining index (% of control). Results represent the mean ± SD from up to six JAK2V617F+ MPN patients. Significance levels of differences in expression of surface antigens between the different conditions were analyzed by one‐way analysis of variance (ANOVA) with Dunnett's post hoc test (*p < .05 compared to control). EPOR, erythropoietin receptor; MNC, mononuclear cells; MPN, myeloproliferative neoplasm; NSC, neoplastic stem cells.

References

    1. Campbell PJ, Green AR. The myeloproliferative disorders. N Engl J Med. 2006;355(23):2452‐2466. - PubMed
    1. Scott LM, Tong W, Levine RL, et al. JAK2 exon 12 mutations in polycythemia vera and idiopathic erythrocytosis. N Engl J Med. 2007;356(5):459‐468. - PMC - PubMed
    1. Kralovics R. Genetic complexity of myeloproliferative neoplasms. Leukemia. 2008;22(10):1841‐1848. - PubMed
    1. Skoda RC, Duek A, Grisouard J. Pathogenesis of myeloproliferative neoplasms. Exp Hematol. 2015;43(8):599‐608. - PubMed
    1. Spivak JL. Myeloproliferative neoplasms. N Engl J Med. 2017;376(22):2168‐2181. - PubMed

Publication types