

Shu-Xie decoction alleviates oxidative stress and colon injury in acute sleep-deprived mice by suppressing p62/KEAP1/NRF2/HO1/NQO1 signaling
- PMID: 36814500
- PMCID: PMC9939528
- DOI: 10.3389/fphar.2023.1107507
Shu-Xie decoction alleviates oxidative stress and colon injury in acute sleep-deprived mice by suppressing p62/KEAP1/NRF2/HO1/NQO1 signaling
Erratum in
-
Corrigendum: Shu-Xie decoction alleviates oxidative stress and colon injury in acute sleep-deprived mice by suppressing p62/KEAP1/NRF2/HO1/NQO1 signaling.Front Pharmacol. 2023 May 30;14:1199204. doi: 10.3389/fphar.2023.1199204. eCollection 2023. Front Pharmacol. 2023. PMID: 37324486 Free PMC article.
Abstract
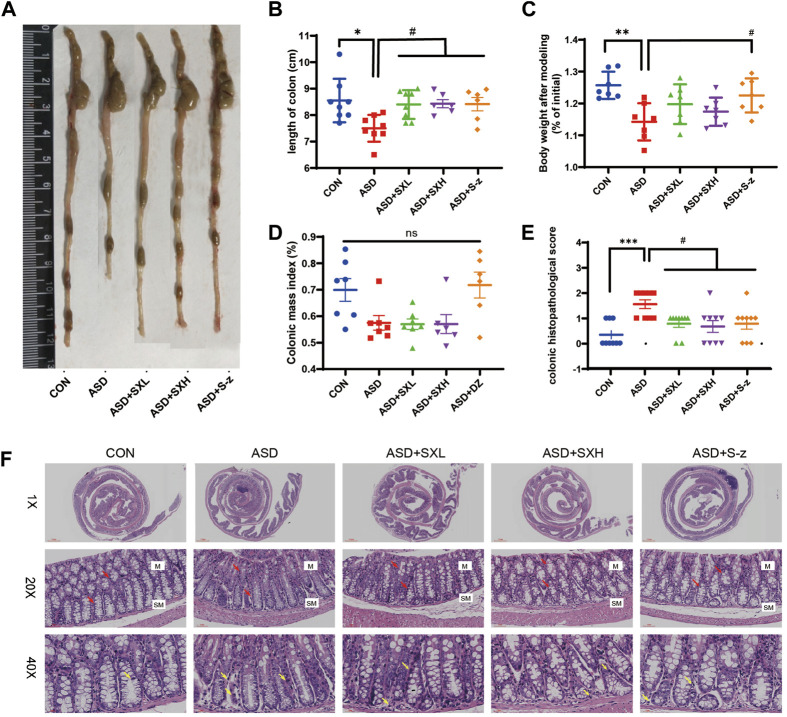
Introduction: Sleep disorders are common clinical psychosomatic disorders that can co-exist with a variety of conditions. In humans and animal models, sleep deprivation (SD) is closely related with gastrointestinal diseases. Shu-Xie Decoction (SX) is a traditional Chinese medicine (TCM) with anti-nociceptive, anti-inflammatory, and antidepressant properties. SX is effective in the clinic for treating patients with abnormal sleep and/or gastrointestinal disorders, but the underlying mechanisms are not known. This study investigated the mechanisms by which SX alleviates SD-induced colon injury in vivo. Methods: C57BL/6 mice were placed on an automated sleep deprivation system for 72 h to generate an acute sleep deprivation (ASD) model, and low-dose SX (SXL), high-dose SX (SXH), or S-zopiclone (S-z) as a positive control using the oral gavage were given during the whole ASD-induced period for one time each day. The colon length was measured and the colon morphology was visualized using hematoxylin and eosin (H&E) staining. ROS and the redox biomarkers include reduced glutathione (GSH), malondialdehyde (MDA), and superoxide dismutase (SOD) were detected. Quantitative real-time PCR (qRT-PCR), molecular docking, immunofluorescence and western blotting assays were performed to detect the antioxidant signaling pathways. Results: ASD significantly increased FBG levels, decreased colon length, moderately increased the infiltration of inflammatory cells in the colon mucosa, altered the colon mucosal structure, increased the levels of ROS, GSH, MDA, and SOD activity compared with the controls. These adverse effects were significantly alleviated by SX treatment. ASD induced nuclear translocation of NRF2 in the colon mucosal cells and increased the expression levels of p62, NQO1, and HO1 transcripts and proteins, but these effects were reversed by SX treatment. Conclusion: SX decoction ameliorated ASD-induced oxidative stress and colon injury by suppressing the p62/KEAP1/NRF2/HO1/NQO1 signaling pathway. In conclusion, combined clinical experience, SX may be a promising drug for sleep disorder combined with colitis.
Keywords: NRF2; ROS; oxidative stress; sleep deprivation; traditional Chinese medicine.
Copyright © 2023 Wang, Li, Liu, Zhang, Huang, Cai, Jia, Huang, Ke, Liu and Yang.
Conflict of interest statement
The authors declare that the research was conducted in the absence of any commercial or financial relationships that could be construed as a potential conflict of interest.
Figures


Similar articles
-
Corrigendum: Shu-Xie decoction alleviates oxidative stress and colon injury in acute sleep-deprived mice by suppressing p62/KEAP1/NRF2/HO1/NQO1 signaling.Front Pharmacol. 2023 May 30;14:1199204. doi: 10.3389/fphar.2023.1199204. eCollection 2023. Front Pharmacol. 2023. PMID: 37324486 Free PMC article.
-
[Intervention of curcumin and its analogue J7 on oxidative stress injury in testis of type 2 diabetic rats].Zhongguo Ying Yong Sheng Li Xue Za Zhi. 2019 Feb;35(2):145-149. doi: 10.12047/j.cjap.5783.2019.032. Zhongguo Ying Yong Sheng Li Xue Za Zhi. 2019. PMID: 31250606 Chinese.
-
S-allylmercaptocysteine ameliorates lipopolysaccharide-induced acute lung injury in mice by inhibiting inflammation and oxidative stress via nuclear factor kappa B and Keap1/Nrf2 pathways.Int Immunopharmacol. 2020 Apr;81:106273. doi: 10.1016/j.intimp.2020.106273. Epub 2020 Mar 5. Int Immunopharmacol. 2020. PMID: 32070920
-
Xiaojianzhong decoction attenuates gastric mucosal injury by activating the p62/Keap1/Nrf2 signaling pathway to inhibit ferroptosis.Biomed Pharmacother. 2022 Nov;155:113631. doi: 10.1016/j.biopha.2022.113631. Epub 2022 Sep 16. Biomed Pharmacother. 2022. PMID: 36122518 Review.
-
Activation of Nrf2/HO-1 signaling: An important molecular mechanism of herbal medicine in the treatment of atherosclerosis via the protection of vascular endothelial cells from oxidative stress.J Adv Res. 2021 Jul 6;34:43-63. doi: 10.1016/j.jare.2021.06.023. eCollection 2021 Dec. J Adv Res. 2021. PMID: 35024180 Free PMC article. Review.
Cited by
-
SCH58261 effectively prevents the reduction in excitability of striatal MSNs in mice following 20 h of sleep deprivation.Purinergic Signal. 2025 Feb 19. doi: 10.1007/s11302-025-10072-z. Online ahead of print. Purinergic Signal. 2025. PMID: 39969768
-
Enhancing radioprotection: exploring the impact of L-carnitine supplementation on the oxidative stress in the liver.Mol Biol Rep. 2024 Sep 26;51(1):1015. doi: 10.1007/s11033-024-09959-8. Mol Biol Rep. 2024. PMID: 39325219
-
Method of invigorating spleen and replenishing kidney and resolving phlegm for obesity-type polycystic ovary syndrome: a network meta-analysis and summary of herbal prescription regularity.Front Med (Lausanne). 2025 Jul 28;12:1609131. doi: 10.3389/fmed.2025.1609131. eCollection 2025. Front Med (Lausanne). 2025. PMID: 40792299 Free PMC article.
-
Mechanisms of Senegenin in Regulating Oxidative Stress and Mitochondria Damage for Neuroprotection in Insomnia: Evidence from In Vivo and In Vitro Models.Mol Neurobiol. 2025 Jul 4. doi: 10.1007/s12035-025-05170-3. Online ahead of print. Mol Neurobiol. 2025. PMID: 40614022
-
Protective Effect and Related Mechanism of Modified Danggui Buxue Decoction on Retinal Oxidative Damage in Mice based on Network Pharmacology.Curr Pharm Des. 2024;30(24):1912-1926. doi: 10.2174/0113816128293824240517113238. Curr Pharm Des. 2024. PMID: 38835123
References
LinkOut - more resources
Full Text Sources
Miscellaneous