. 2023 Feb 6:11:1085268.
doi: 10.3389/fbioe.2023.1085268. eCollection 2023.

Optogenetic control of beta-carotene bioproduction in yeast across multiple lab-scales

Affiliations

Optogenetic control of beta-carotene bioproduction in yeast across multiple lab-scales

Sylvain Pouzet et al. Front Bioeng Biotechnol. .

Abstract

Optogenetics arises as a valuable tool to precisely control genetic circuits in microbial cell factories. Light control holds the promise of optimizing bioproduction methods and maximizing yields, but its implementation at different steps of the strain development process and at different culture scales remains challenging. In this study, we aim to control beta-carotene bioproduction using optogenetics in Saccharomyces cerevisiae and investigate how its performance translates across culture scales. We built four lab-scale illumination devices, each handling different culture volumes, and each having specific illumination characteristics and cultivating conditions. We evaluated optogenetic activation and beta-carotene production across devices and optimized them both independently. Then, we combined optogenetic induction and beta-carotene production to make a light-inducible beta-carotene producer strain. This was achieved by placing the transcription of the bifunctional lycopene cyclase/phytoene synthase CrtYB under the control of the pC120 optogenetic promoter regulated by the EL222-VP16 light-activated transcription factor, while other carotenogenic enzymes (CrtI, CrtE, tHMG) were expressed constitutively. We show that illumination, culture volume and shaking impact differently optogenetic activation and beta-carotene production across devices. This enabled us to determine the best culture conditions to maximize light-induced beta-carotene production in each of the devices. Our study exemplifies the stakes of scaling up optogenetics in devices of different lab scales and sheds light on the interplays and potential conflicts between optogenetic control and metabolic pathway efficiency. As a general principle, we propose that it is important to first optimize both components of the system independently, before combining them into optogenetic producing strains to avoid extensive troubleshooting. We anticipate that our results can help designing both strains and devices that could eventually lead to larger scale systems in an effort to bring optogenetics to the industrial scale.

Keywords: DIY; Optogenetics; Saccharomyces cerevisiae; beta-carotene; bioproduction; metabolic engineering; synthetic biology; yeast.


Conflict of interest statement

The authors declare that the research was conducted in the absence of any commercial or financial relationships that could be construed as a potential conflict of interest.

Figures

FIGURE 1
FIGURE 1
Description of the four optogenetic devices used in this study. (A) The OptoBox (adapted from Gerhardt et al., 2016) can independently illuminate 1 mL cultures in a 24-well plate placed in a shaking incubator. Two LEDs (0–4 mW/cm2) illuminate each well from below and can be programmed. (B) The OptoTubes are used to illuminate 14 mL tubes (generally 3 mL cultures) using a LED (0–12 mW/cm2) placed at the bottom of each tube. The OptoTubes can be programmed with an Arduino (0–255 u.a.) and be placed in a shaking incubator thanks to a dedicated 3D printed opaque holder. (C) The eVOLVER culture platform adapted from Wong et al., 2018 uses a DIY “sleeve” (right) where a glass vial (center) can be inserted, all connected to an Arduino. We built 16 of these units, and the temperature, stirring and illumination (via an additional side-LED: 6 mW/cm2) can be controlled for each unit, while the growth rate and production of beta-carotene can be monitored. The lid of the glass vial was adapted to accommodate the input of more light using additional LEDs (12 mW/cm2 each). (D) The OptoFlasks, in which custom-made illumination stands were built to hold different numbers of LEDs (12 mW/cm2 each), on top of which the flasks (indented/baffled or flat) are positioned and can hold 25–50 mL cultures.
FIGURE 2
FIGURE 2
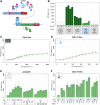
Optogenetic activation in different devices. (A) The EL222 optogenetic system responds to blue light which activates the transcription of genes under the control of the pC120 promoter (here a GFP, in the OPTO-EXP strain). Adapted from (Zhao et al., 2018). (B) Fluorescence GFP levels of the background strain CEN.PK2-1C; strains carrying GFP under the strong pTDH3 and medium pADH1 constitutive promoters; and highest levels of fluorescence reached with the OPTO-EXP strain in the light and in the dark in each the four different illumination devices (BOX: OptoBox, TUB: OptoTubes, EVO: eVOLVER, FLA: OptoFlasks). (C) OPTO-EXP optogenetic activation in the OptoBox. Cumulative LED intensities from 0 to 8000 u.a. correspond to 0–4 mW/cm2 per LED. (D) OPTO-EXP optogenetic activation in the OptoTubes. LED intensities from 0 to 255 u.a. correspond to 0–12 mW/cm2 (Supplementary Figure S1) (E) OPTO-EXP optogenetic activation in the eVOLVER, with variation of illumination (number of LEDs: s+2 corresponds to the side-LED and 2 additional LEDs inserted via the lid), volume (mL) and stirring (u.a., 0–255). The side-LED corresponds to 6 mW/cm2, and 1, 2, 3, and 4 additional LEDs add 6.7, 8.3, 9,3 and 9.4 mW/cm2 of intensity in the medium. (F) OPTO-EXP optogenetic activation in OptoFlasks. Illumination (0, 4, 8, 12, 16 or 20 LEDs on the illumination stand, 12 mW/cm2 each). Volume (25 and 50 mL) and the presence of indentation in the 250 mL flask (+ is indented, - is flat) were tested. For all measures, the levels of GFP were determined using cytometry (n > 3); error bars represent the standard deviation.
FIGURE 3
FIGURE 3
Constitutive beta-carotene production and analysis of the effect of light on beta-carotene accumulation in yeast. (A) Beta-carotene pathway. Arrows point to chemical species (see Supplementary Figure S8 for more details), genes names are indicated in capital letters beside arrows. The large grey arrow represents the carbon flux leading to beta-carotene production. Orange: heterologous genes inserted under constitutive promoters. Red: endogenous gene deletion. (B) Microscopic observations and corresponding cell pellets. CEN.PK2-1C (top) strain and constitutive beta-carotene production (yPH_554—middle and bottom). Growth in YPD at 30°C for 24 h with low stirring (100—middle) versus high stirring (255—bottom). Bright field images and GFP images showing beta-carotene localized in lipid droplets and emitting in the GFP channel (100X objective). See also Supplementary Figure S5. (C) Constitutive beta-carotene production (content—µg beta-carotene/g cell dry weight) measured after growth in the different devices (see Methods). Volume (mL), stirring/shaking (rpm except for eVOLVER, which is given in arbitrary units, + and - in OptoFlasks represent the presence or absence of indentation, respectively). In this panel, all experiments were performed in the dark (non-optogenetic strain). The WT non-producer strain is CEN.PK2-1C. Sample numbers indicated in circled numbers in (C) match images in (B). (D) Effect of light on constitutive beta-carotene production in the different devices. Dark-orange bars are cultures kept in the dark, light-orange bars are illuminated cultures. Volume (mL), stirring (rpm or u.a. and indentation presence) are the same as in (C) and light (u.a.) as in Supplementary Figure S2.
FIGURE 4
FIGURE 4
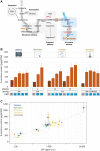
Light-activated beta-carotene production. (A) Design leading to light controlled beta-carotene production: in the optogenetic strain, only CrtYB is under the control of the pC120 promoter (yPH_551). Blue arrows represent light-induced enzymatic reactions. Orange: heterologous carotenogenic genes inserted under constitutive promoters. Red: deleted endogenous genes. Blue: optogenetically controlled reaction. (B) Beta-carotene production quantification from the different devices. Dark-orange bars correspond to cultures in the dark, light-orange bars correspond to illuminated cultures. Volumes (mL), stirring (rpm except u.a. for eVOLVER) and illumination (u.a.) are indicated (n > 3). (C) Light-activated beta-carotene production (Figure 4B) versus corresponding optogenetic activation (from Figures 2C–F—note the log10 scale) in the different devices. Grey dashes represent the linear regression fit (adjusted R 2 = 0.81). The black point represents the pTDH3 promoter GFP signal and production by the constitutive beta-carotene production strain (yPH_554—Figure 3C). Error bars are standard deviations.

References

    1. Aw R., Polizzi K. M. (2013). Can too many copies spoil the broth? Microb. Cell Fact. 12 (1), 128. 10.1186/1475-2859-12-128 - DOI - PMC - PubMed
    1. Benzinger D., Khammash M. (2018). Pulsatile inputs achieve tunable attenuation of gene expression variability and graded multi-gene regulation. Nat. Commun. 9 (1), 3521. 10.1038/s41467-018-05882-2 - DOI - PMC - PubMed
    1. Benzinger D., Ovinnikov S., Khammash M. (2022). Synthetic gene networks recapitulate dynamic signal decoding and differential gene expression. Cell Syst. 13 (5), 353–364.e6. 10.1016/j.cels.2022.02.004 - DOI - PubMed
    1. Bogacz-Radomska L., Harasym J. (2018). β-Carotene-properties and production methods. Food Qual. Saf. 2 (2), 69–74. 10.1093/fqsafe/fyy004 - DOI
    1. Bugaj L. J., Lim W. A. (2019). High-throughput multicolor optogenetics in microwell plates. Nat. Protoc. 14 (7), 2205–2228. 10.1038/s41596-019-0178-y - DOI - PubMed