. 2023 Feb 3:21:1272-1282.
doi: 10.1016/j.csbj.2023.01.046. eCollection 2023.

TCR_Explore: A novel webtool for T cell receptor repertoire analysis

Affiliations

TCR_Explore: A novel webtool for T cell receptor repertoire analysis

Kerry A Mullan et al. Comput Struct Biotechnol J. .

Abstract

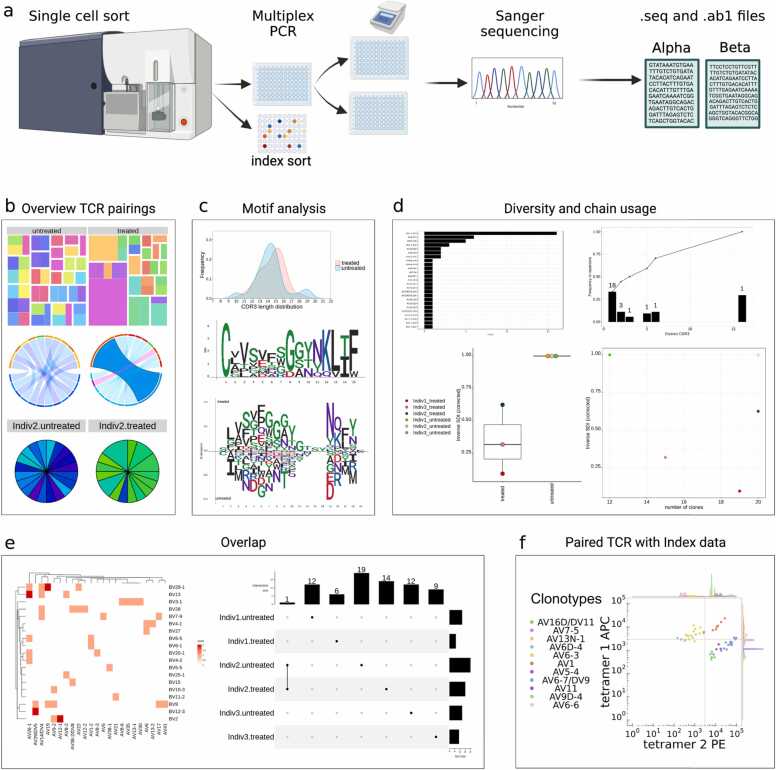
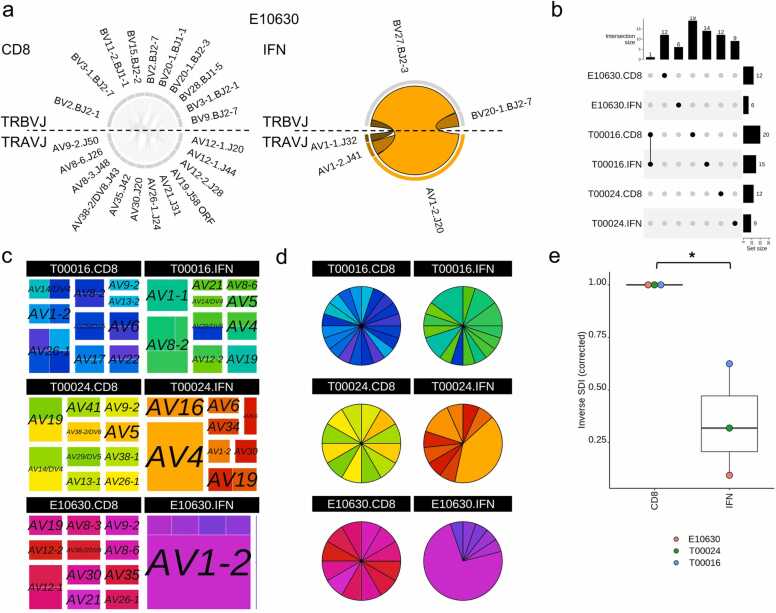
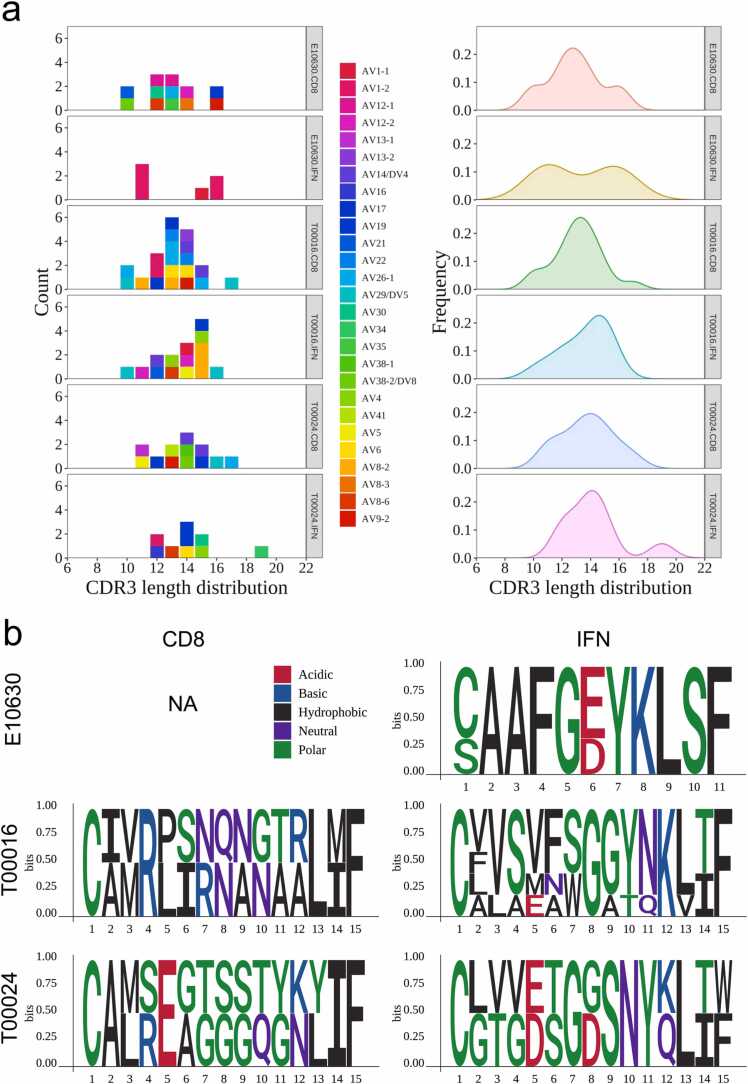
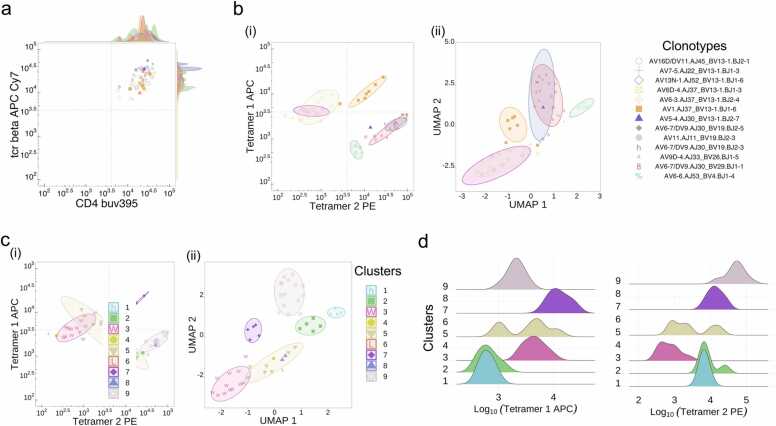
T cells expressing either alpha-beta or gamma-delta T cell receptors (TCR) are critical sentinels of the adaptive immune system, with receptor diversity being essential for protective immunity against a broad array of pathogens and agents. Programs available to profile TCR clonotypic signatures can be limiting for users with no coding expertise. Current analytical pipelines can be inefficient due to manual processing steps, open to data entry errors and have multiple analytical tools with unique inputs that require coding expertise. Here we present a bespoke webtool designed for users irrespective of coding expertise, coined 'TCR_Explore', enabling analysis either derived via Sanger sequencing or next generation sequencing (NGS) platforms. Further, TCR_Explore incorporates automated quality control steps for Sanger sequencing. The creation of flexible and publication ready figures are enabled for different sequencing platforms following universal conversion to the TCR_Explore file format. TCR_Explore will enhance a user's capacity to undertake in-depth TCR repertoire analysis of both new and pre-existing datasets for identification of T cell clonotypes associated with health and disease. The web application is located at https://tcr-explore.erc.monash.edu for users to interactively explore TCR repertoire datasets.

Keywords: APC, antigen presenting cells; CDR, complementarity determining region; HLA, human leukocyte antigen; NGS, next generation sequencing; QC, quality control; Shiny R application; T cell receptor; T cells; TCR repertoire; TCR, T cell receptor.


Conflict of interest statement

The authors declare that they have no competing interests.

Figures

Fig. 1
Fig. 1
Traditional Sanger sequencing pipeline. (A) Targeted T cells are single-cell sorted into 96 well plates by flow cytometry. Single cells undergo reverse transcription to cDNA that is then used as the template for amplification of selected TCR genes by multiplex nested PCR. Following a PCR clean-up step and fluorescent labelling of dNTPs, the amplified DNA undergoes Sanger sequencing, which produces two output files (.seq and .ab1). (B) ‘Overview of TCR pairing’ panel; (top) treemap, (middle) chord diagram, (bottom) pie chart. (C) ‘Motif analysis’ panel; (top) length distribution, (middle), single length motif plot, (bottom) aligned motif plot. (D) ‘Diversity and chain usage’ panel; (top left) chain usage, (top right) frequency of each clonotype, (bottom left) inverse Simpson diversity index (SDI), (bottom right) total number of clones. (E) ‘Overlap’ group comparison panel; (left) heatmap or (right) upset plot. (F) ‘Paired TCR with Index data’ panel; overlaid dot plot with histograms of the functional TCR sequence and two immunophenotyping markers. Figure created using BioRender (BioRender.com).
Fig. 2
Fig. 2
TCR_Explore analysis of a pre-existing TCR repertoire dataset. TCR repertoire data derived from in vitro expanded carbamazepine-induced T cells derived from patients with Stevens-Johnson Syndrome (T00016, T00024 and E10630), with CD8 and IFN representing the non-activated and drug-activated subsets, respectively. (a) E10630, chord diagram of drug-induced αβTCR repertoire for CD8 and IFN subsets. No overlapping sequences between the CD8 (grey) and IFN (orange) subsets. (b) Upset plot representing αβTCR CDR3 region overlap. Dots represent the presence of a clonal sequence and lines connect overlapping samples. (c) treemap coloured by AVJ_aCDR3_BVJ_bCDR3 and separated by the TRAV genes (size of the square indicate proportion of each TCR relative to the individual sample; colour represents a unique clone). (d) pie chart coloured by AVJ_aCDR3_BVJ_bCDR3 (size of the segment is proportional to the percentage of each clone; colour represents a unique clone). Same colours were used for both the (c) treemap and (d) pie chart. (e) Inverse Simpson index vs condition to measure change in diversity following drug exposure. Paired Students t-test, *p < 0.05. Dots represent each individual.
Fig. 3
Fig. 3
TCR_Explore reveals CDR3α motif nuances. TCR repertoire data from patients with Stevens-Johnson Syndrome (T00016, T00024 and E10630), with CD8 and IFN representing the non-activated and drug-activated subsets, respectively. (a) CDR3α length distribution coloured by individual or density plot of CD8 non-activated vs IFN activated group. (b) CDR3α motif plot showcasing CD8 non-activated (left) vs IFN activated (right) for (top) E10630 (11mers), (middle) T00016 (15mers) and (bottom) T00024 (15mers). Note, no E10630 CD8 motif shown due to the absence of 11mers for CDR3 length (NA).
Fig. 4
Fig. 4
Linking TCR clonotype with immunophenotype. CD4+ T cells harvested from draining lymph nodes of an HLA-DR4 mouse immunised with Fibβ-72,74cit69–81 peptide. (a) Dot plot with overlaid histograms depicting CD4 expression of different TCR sequences. Co-staining of CD4+ T cells with HLA-DRB1 * 04:01Fibβ−72,74cit69–81 (tetramer 1 APC) and HLA-DRB1*04:01Fibβ−74cit69–81 (tetramer 2 PE) showing (b) TCR gene analysis and (c) clustering analysis. Visual interrogation can be either the (i) tetramer 1 APC vs tetramer 2 PE and (ii) dimensional reduction of UMAP 1 vs UMAP 2. (d) Ridges plot represents a single fluorochrome marker for each group in the clustering analysis.

References

    1. Kumar B.V., Connors T.J., Farber D.L. Human T cell development, localization, and function throughout life. Immunity. 2018;48:202–213. - PMC - PubMed
    1. Vantourout P., Hayday A. Six-of-the-best: unique contributions of gammadelta T cells to immunology. Nat Rev Immunol. 2013;13:88–100. - PMC - PubMed
    1. Davey M.S., Willcox C.R., Baker A.T., et al. Recasting Human Vdelta1 Lymphocytes in an Adaptive Role. Trends Immunol. 2018;39:446–459. - PMC - PubMed
    1. Lefranc M.P., Giudicelli V., Duroux P., et al. IMGT(R), the international ImMunoGeneTics information system(R) 25 years on. Nucleic Acids Res. 2015;43:D413–D422. - PMC - PubMed
    1. Legut M., Cole D.K., Sewell A.K. The promise of gammadelta T cells and the gammadelta T cell receptor for cancer immunotherapy, Cellular and Molecular Immunology. 2015;12:656–668. - PMC - PubMed