

Axonal and myelin changes and their inter-relationship in the optic radiations in people with multiple sclerosis
- PMID: 36814811
- PMCID: PMC9940187
- DOI: 10.1177/20552173221147620
Axonal and myelin changes and their inter-relationship in the optic radiations in people with multiple sclerosis
Abstract
Background: The imaging g-ratio, estimated from axonal volume fraction (AVF) and myelin volume fraction (MVF), is a novel biomarker of microstructural tissue integrity in multiple sclerosis (MS).
Objective: To assess axonal and myelin changes and their inter-relationship as measured by g-ratio in the optic radiations (OR) in people with MS (pwMS) with and without previous optic neuritis (ON) compared to healthy controls (HC).
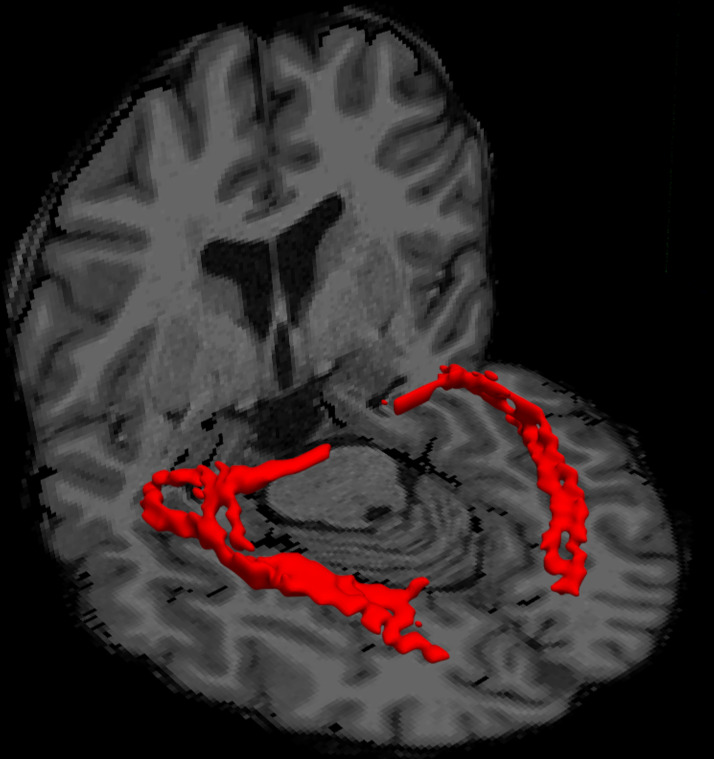
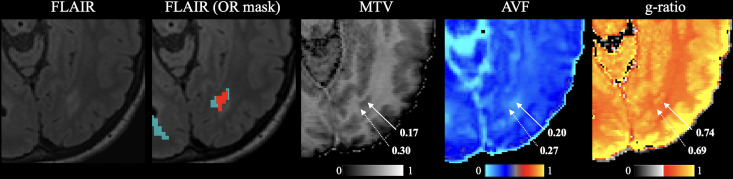
Methods: Thirty pwMS and 17 HCs were scanned on a 3Tesla Connectom scanner. AVF and MVF, derived from a multi-shell diffusion protocol and macromolecular tissue volume, respectively, were measured in normal-appearing white matter (NAWM) and lesions within the OR and used to calculate imaging g-ratio.
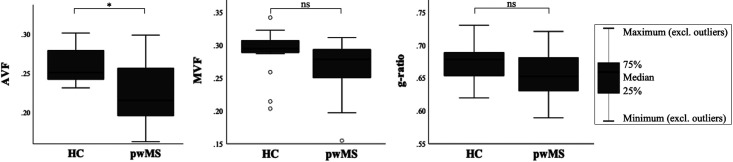
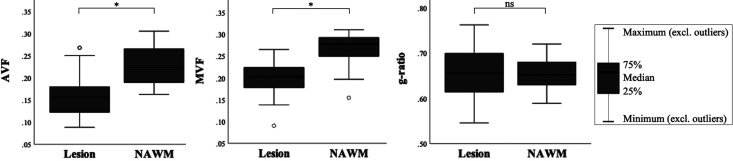
Results: OR AVF and MVF were decreased in pwMS compared to HC, and in OR lesions compared to NAWM, whereas the g-ratio was not different. Compared to pwMS with previous ON, AVF and g-ratio tended to be higher in pwMS without prior ON. AVF and MVF, particularly in NAWM, were positively correlated with retinal thickness, which was more pronounced in pwMS with prior ON.
Conclusion: Axonal measures reflect microstructural tissue damage in the OR, particularly in the setting of remote ON, and correlate with established metrics of visual health in MS.
Keywords: Optic neuritis; diffusion magnetic resonance imaging; diffusion tractography; multiple sclerosis; optical coherence tomography; white matter.
© The Author(s), 2023.
Conflict of interest statement
The author(s) declared the following potential conflicts of interest with respect to the research, authorship, and/or publication of this article: I.C.G. became employed by Biogen following her contributions to this research. S.Y.H. has received consulting fees and research grants from Siemens Healthineers. E.C.K. has received consulting fees from Banner Life Sciences, Galen/Atlantica, Genentech, Greenwich Biosciences and OM1, and research funds from Abbvie, Biogen, and Genentech. Other authors report no potential conflicts of interest with respect to the research, authorship, and/or publication of this article.
Figures
Similar articles
-
Axonal damage in the optic radiation assessed by white matter tract integrity metrics is associated with retinal thinning in multiple sclerosis.Neuroimage Clin. 2020;27:102293. doi: 10.1016/j.nicl.2020.102293. Epub 2020 May 26. Neuroimage Clin. 2020. PMID: 32563921 Free PMC article.
-
Perilesional neurodegenerative injury in multiple sclerosis: Relation to focal lesions and impact on disability.Mult Scler Relat Disord. 2021 Apr;49:102738. doi: 10.1016/j.msard.2021.102738. Epub 2021 Jan 5. Mult Scler Relat Disord. 2021. PMID: 33609957 Free PMC article.
-
Quantifying visual pathway axonal and myelin loss in multiple sclerosis and neuromyelitis optica.Neuroimage Clin. 2016 May 26;11:743-750. doi: 10.1016/j.nicl.2016.05.014. eCollection 2016. Neuroimage Clin. 2016. PMID: 27330974 Free PMC article.
-
Imaging G-Ratio in Multiple Sclerosis Using High-Gradient Diffusion MRI and Macromolecular Tissue Volume.AJNR Am J Neuroradiol. 2019 Nov;40(11):1871-1877. doi: 10.3174/ajnr.A6283. Epub 2019 Nov 6. AJNR Am J Neuroradiol. 2019. PMID: 31694819 Free PMC article.
-
Investigating Microstructural Changes in White Matter in Multiple Sclerosis: A Systematic Review and Meta-Analysis of Neurite Orientation Dispersion and Density Imaging.Brain Sci. 2021 Aug 29;11(9):1151. doi: 10.3390/brainsci11091151. Brain Sci. 2021. PMID: 34573172 Free PMC article. Review.
Cited by
-
In vivo evidence for cell body loss in cortical lesions in people with multiple sclerosis.Ann Clin Transl Neurol. 2025 Jan;12(1):4-16. doi: 10.1002/acn3.52237. Epub 2024 Dec 13. Ann Clin Transl Neurol. 2025. PMID: 39673156 Free PMC article.
References
-
- Stikov N, Campbell JS, Stroh T, et al. In vivo histology of the myelin g-ratio with magnetic resonance imaging. Research support, non-U.S. Gov't. NeuroImage 2015; 118: 397–405. - PubMed
-
- Frohman EM, Frohman TC, Zee DSet al. et al. The neuro-ophthalmology of multiple sclerosis. Lancet Neurol 2005; 4: 111–121. - PubMed
Grants and funding
LinkOut - more resources
Full Text Sources
Miscellaneous
