. 2023 Jan 16;3(1):100392.
doi: 10.1016/j.crmeth.2022.100392. eCollection 2023 Jan 23.

Identifying key multifunctional components shared by critical cancer and normal liver pathways via SparseGMM

Affiliations

Identifying key multifunctional components shared by critical cancer and normal liver pathways via SparseGMM

Shaimaa Bakr et al. Cell Rep Methods. .

Abstract

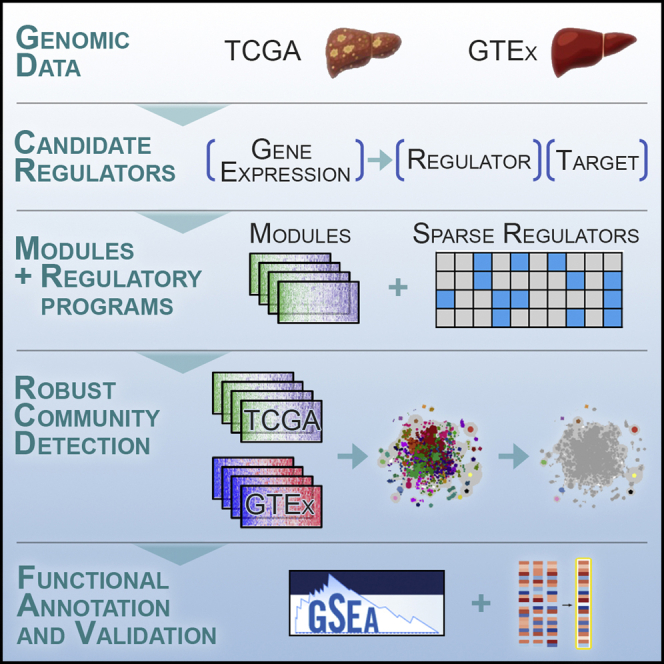
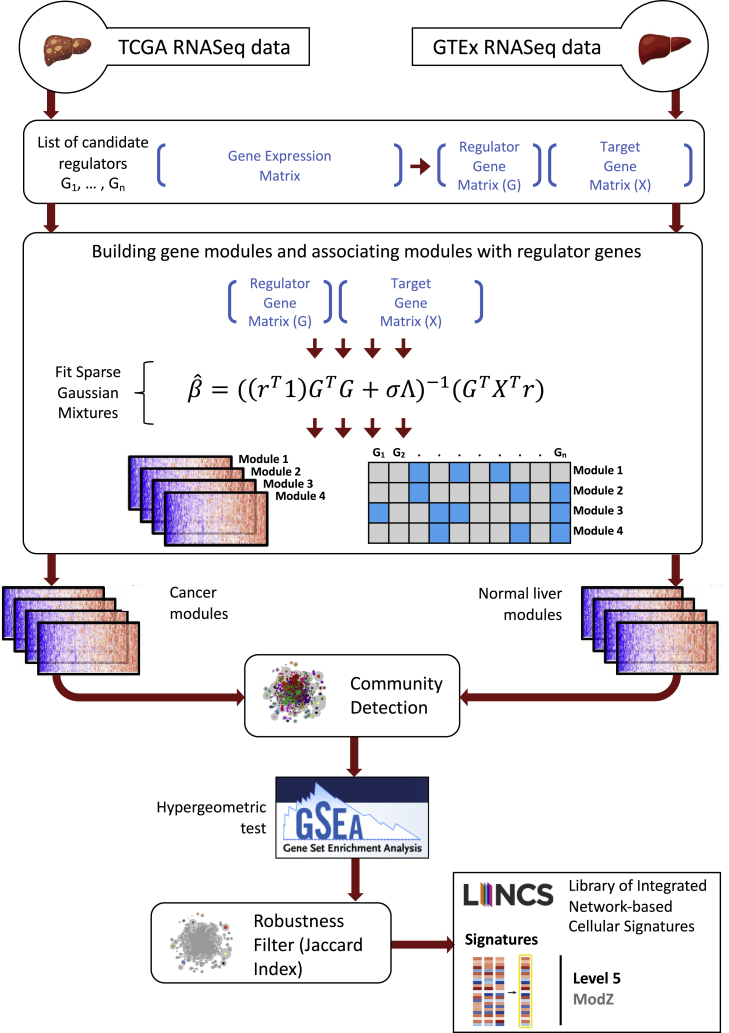
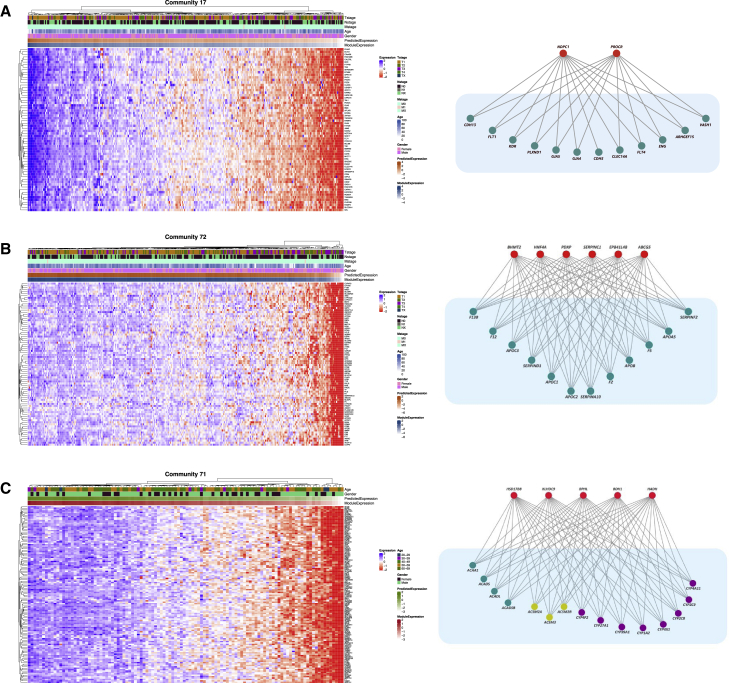
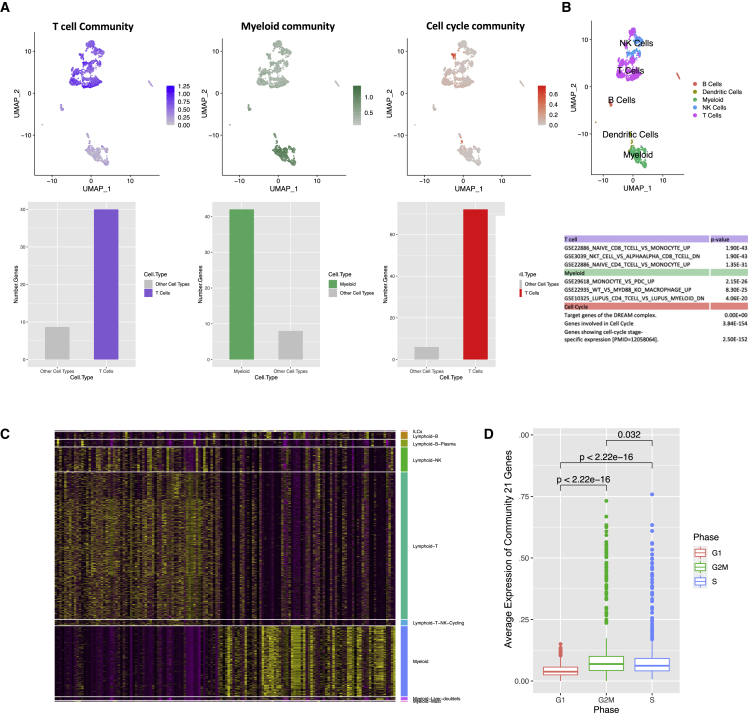
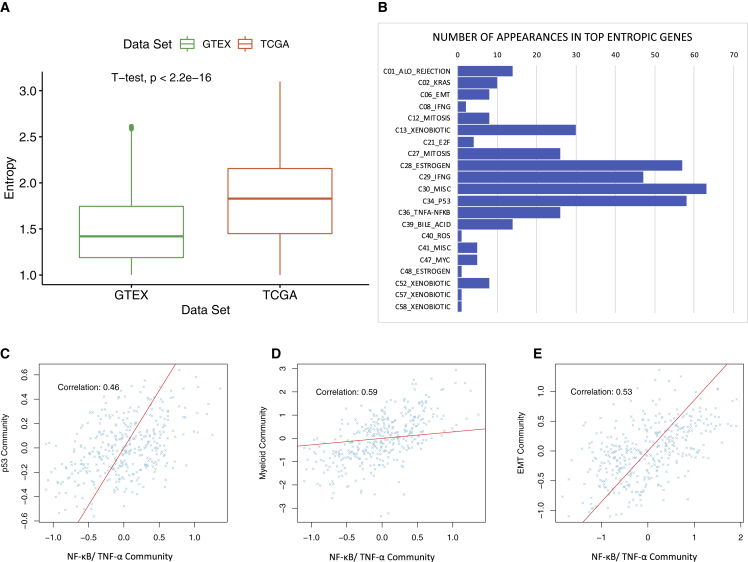
Despite the abundance of multimodal data, suitable statistical models that can improve our understanding of diseases with genetic underpinnings are challenging to develop. Here, we present SparseGMM, a statistical approach for gene regulatory network discovery. SparseGMM uses latent variable modeling with sparsity constraints to learn Gaussian mixtures from multiomic data. By combining coexpression patterns with a Bayesian framework, SparseGMM quantitatively measures confidence in regulators and uncertainty in target gene assignment by computing gene entropy. We apply SparseGMM to liver cancer and normal liver tissue data and evaluate discovered gene modules in an independent single-cell RNA sequencing (scRNA-seq) dataset. SparseGMM identifies PROCR as a regulator of angiogenesis and PDCD1LG2 and HNF4A as regulators of immune response and blood coagulation in cancer. Furthermore, we show that more genes have significantly higher entropy in cancer compared with normal liver. Among high-entropy genes are key multifunctional components shared by critical pathways, including p53 and estrogen signaling.


Conflict of interest statement

The authors declare no competing interests

Figures

None
Graphical abstract
Figure 1
Figure 1
Overview of study and the SparseGMM method SparseGMM uses a graph-based Bayesian framework combined with coexpression pattern to connect sparse sets of regulators to their downstream target gene modules. To measure robustness, we ran SparseGMM several times, generating multiple gene networks from each of two datasets with normal liver and liver cancer gene expression profiles. To screen for robust modules and identify normal-cancer shared biology, we ran a community detection algorithm to group robust modules that are consistently discovered in every run. Next, we performed functional gene set enrichment analysis using MSigDB gene collections. Finally, we used publicly available perturbation experiments that identify experimental targets to validate SparseGMM regulators.
Figure 2
Figure 2
Performance comparison between SparseGMM and AMARETTO at different regularization values Comparison shown for TCGA HCC (A–D) and GTEx (E–H) liver data. (A and E) Robustness of clustering is evaluated using adjusted Rand index. (B and F) Validation of regulators is represented by R-squared. (C and G) Degree of sparsity is evaluated using statistics on the number of drivers. (D and H) Module size informs the choice of regularization parameter value. See also Figure S1 and S2 and Table S1.
Figure 3
Figure 3
Sparse GMM module network Left: a sample module network obtained through community detection algorithm to cancer and normal liver modules after running SparseGMM with different initializations. Right: the community detection clusters robust modules together into distinct subnetworks. Subnetworks at the periphery represent robust modules. Subnetworks are then functionally annotated using gene set enrichments analysis applied to MSigDB gene sets. Highlighted here are robust modules from normal liver and liver cancer, as well as shared communities that contain modules occurring in normal and cancer tissue.
Figure 4
Figure 4
Heatmap of coexpression patterns in target genes of sample modules and graph of regulatory relationships Regulator genes are shown in red and target genes are shown in green. (A) Shared communtiy between HCC and normal liver: PROCR and NPDC1 regulate target genes of the angiogenesis community. (B) Liver cancer: HNF4A and other regulators control coagulation factors and apolipoproteins involved in blood coagulation community. (C) Normal liver community: BDH1 and HADH regulate a group of Acyl-CoA dehydrogenases and a group of cytochrome P450 enzymes involved in hepatic differentiation and metabolism. See also Figure S3 and Table S2, S3, and S4.
Figure 5
Figure 5
Single-cell evaluation of highly robust communities (A) Top, left to right: average expression of the T cell, myeloid, and cell-cycle community and cell types. Bottom, left to right: number of genes expressed in T cell, myeloid, and cell-cycle community in their corresponding cell type versus average number of genes expressed in other cell types. (B) Top: cell-type annotation. Bottom: most significant gene set enrichments for the three communities. (C) Heatmap of target genes of T cell and myeloid communities in different single-cell populations. (D) Boxplot of cell cycle phase versus expression of cell-cycle community target genes. Higher expression of cell-cycle genes corresponds to proliferative G2M and S phases. See also Figures S4 and S5.
Figure 6
Figure 6
Analysis of high-entropy genes (A) Boxplot showing difference in mean entropy distribution for high-entropy target genes in GTEx and TCGA, reflecting heterogeneity of cancer samples. Entropy is calculated from the posterior probability of target genes in each dataset, and the mean is calculated over several runs of SparseGMM on each dataset. (B) Distribution of communities of high-entropy genes. (C–E) Expression of communities with high-entropy genes.

References

    1. Cancer Genome Atlas Research Network Electronic address wheeler@bcmedu. Cancer Genome Atlas Research Network Comprehensive and Integrative Genomic Characterization of Hepatocellular Carcinoma. Cell. 2017;169:1327–1341.e23. - PMC - PubMed
    1. GTEx Consortium. Laboratory, Data Analysis & Coordinating Center (LDACC)—Analysis Working Group. Statistical Methods groups-Analysis Working Group. Enhancing GTEx (eGTEx) groups. NIH Common Fund. NIH/NCI. NIH/NHGRI. NIH/NIMH. NIH/NIDA Genetic effects on gene expression across human tissues. Nature. 2017;550:204–213. et al. - PMC - PubMed
    1. Xu S., Xu Y., Liu P., Zhang S., Liu H., Slavin S., Kumar S., Koroleva M., Luo J., Wu X., et al. The novel coronary artery disease risk gene JCAD/KIAA1462 promotes endothelial dysfunction and atherosclerosis. Eur. Heart J. 2019;40:2398–2408. - PMC - PubMed
    1. Mohammadi P., Castel S.E., Cummings B.B., Einson J., Sousa C., Hoffman P., Donkervoort S., Jiang Z., Mohassel P., Foley A.R., et al. Genetic regulatory variation in populations informs transcriptome analysis in rare disease. Science. 2019;366:351–356. - PMC - PubMed
    1. Wang J.D., Zhou H.S., Tu X.X., He Y., Liu Q.F., Liu Q., Long Z.J. Prediction of competing endogenous RNA coexpression network as prognostic markers in AML. Aging (Albany NY) 2019;11:3333–3347. - PMC - PubMed

Publication types