. 2023 Feb 6:17:1115703.
doi: 10.3389/fncel.2023.1115703. eCollection 2023.

Electrically-evoked responses for retinal prostheses are differentially altered depending on ganglion cell types in outer retinal neurodegeneration caused by Crb1 gene mutation

Affiliations

Electrically-evoked responses for retinal prostheses are differentially altered depending on ganglion cell types in outer retinal neurodegeneration caused by Crb1 gene mutation

Hyeonhee Roh et al. Front Cell Neurosci. .

Erratum in

Abstract

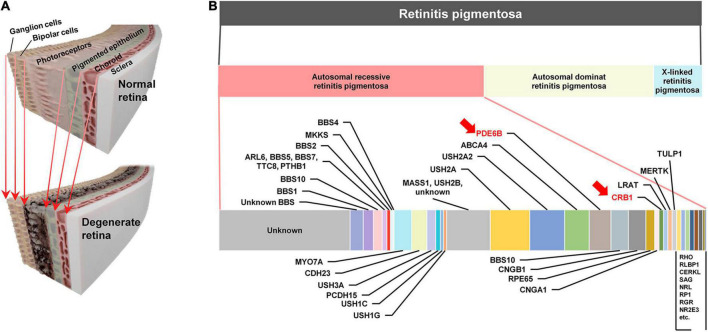
Background: Microelectronic prostheses for artificial vision stimulate neurons surviving outer retinal neurodegeneration such as retinitis pigmentosa (RP). Yet, the quality of prosthetic vision substantially varies across subjects, maybe due to different levels of retinal degeneration and/or distinct genotypes. Although the RP genotypes are remarkably diverse, prosthetic studies have primarily used retinal degeneration (rd) 1 and 10 mice, which both have Pde6b gene mutation. Here, we report the electric responses arising in retinal ganglion cells (RGCs) of the rd8 mouse model which has Crb1 mutation.

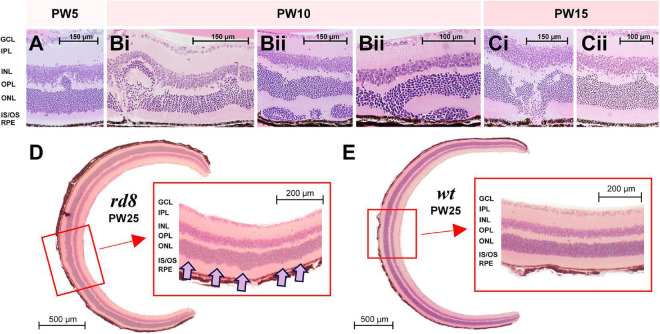
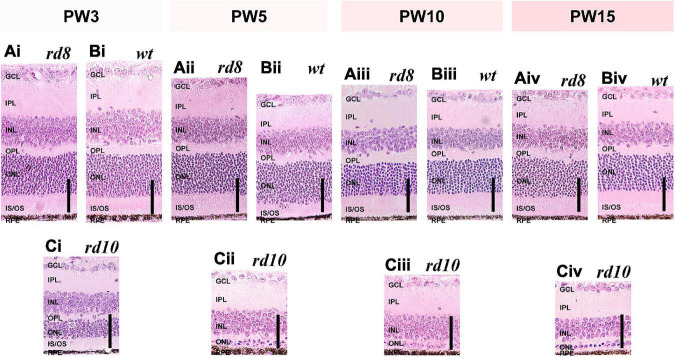
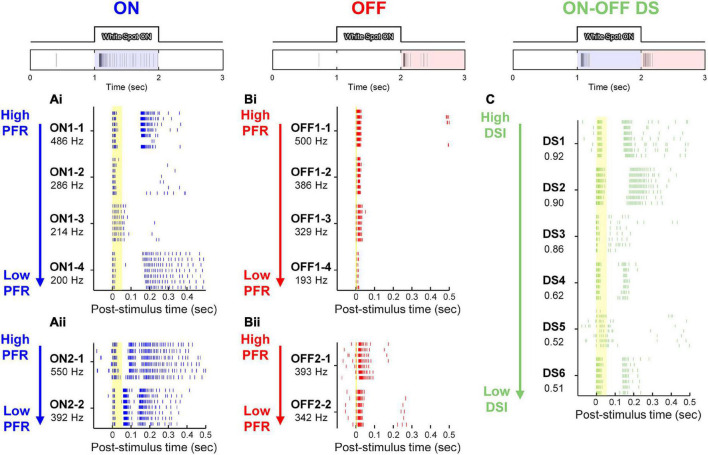
Methods: We first investigated age-dependent histological changes of wild-type (wt), rd8, and rd10 mice retinas by H&E staining. Then, we used cell-attached patch clamping to record spiking responses of ON, OFF and direction selective (DS) types of RGCs to a 4-ms-long electric pulse. The electric responses of rd8 RGCs were analyzed in comparison with those of wt RGCs in terms of individual RGC spiking patterns, populational characteristics, and spiking consistency across trials.

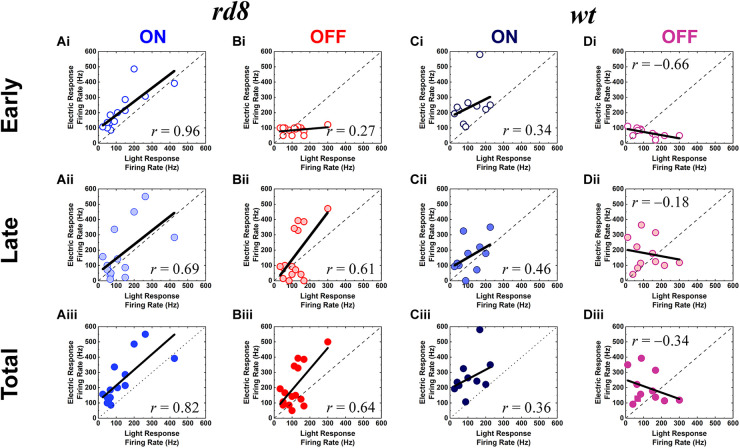
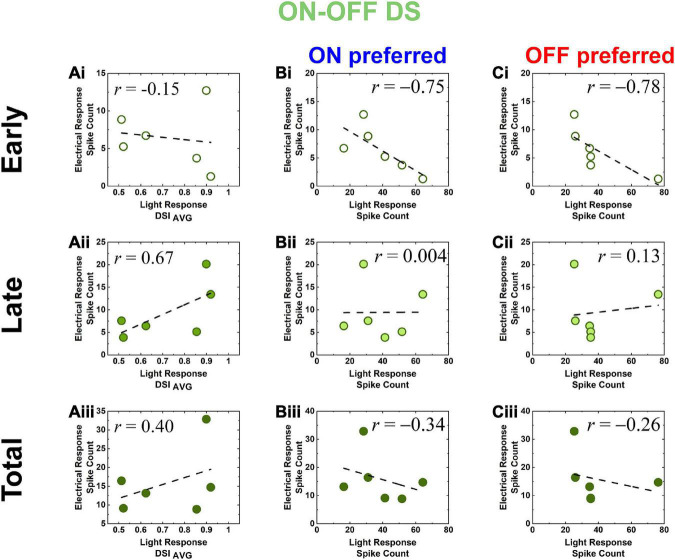
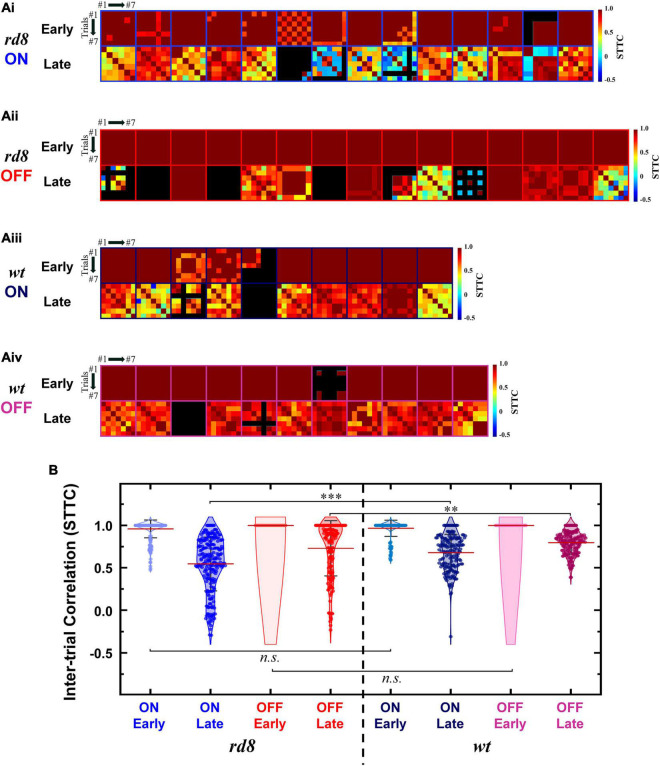
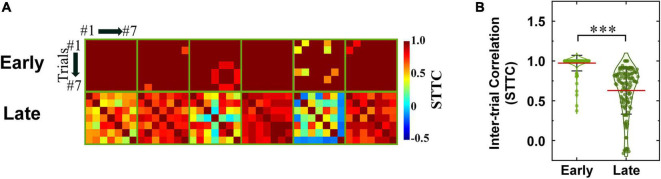
Results: In the histological examination, the rd8 mice showed partial retinal foldings, but the outer nuclear layer thicknesses remained comparable to those of the wt mice, indicating the early-stage of RP. Although spiking patterns of each RGC type seemed similar to those of the wt retinas, correlation levels between electric vs. light response features were different across the two mouse models. For example, in comparisons between light vs. electric response magnitudes, ON/OFF RGCs of the rd8 mice showed the same/opposite correlation polarity with those of wt mice, respectively. Also, the electric response spike counts of DS RGCs in the rd8 retinas showed a positive correlation with their direction selectivity indices (r = 0.40), while those of the wt retinas were negatively correlated (r = -0.90). Lastly, the spiking timing consistencies of late responses were largely decreased in both ON and OFF RGCs in the rd8 than the wt retinas, whereas no significant difference was found across DS RGCs of the two models.

Conclusion: Our results indicate the electric response features are altered depending on RGC types even from the early-stage RP caused by Crb1 mutation. Given the various degeneration patterns depending on mutation genes, our study suggests the importance of both genotype- and RGC type-dependent analyses for retinal prosthetic research.

Keywords: artificial vision; electrical stimulation; retinal degeneration; retinal prosthesis; retinitis pigmentosa.


Conflict of interest statement

The authors declare that the research was conducted in the absence of any commercial or financial relationships that could be construed as a potential conflict of interest.

Figures

FIGURE 1
FIGURE 1
(A) Schematic illustrations of the healthy retina (top) and the retina damaged by outer retinal degenerative diseases such as retinitis pigmentosa (bottom). As the retina degenerates, the photoreceptors are primarily damaged. (B) Spectrum of retinitis pigmentosa (RP) (second row) RP has three major types autosomal recessive retinitis pigmentosa (ARRP; 50–60%), autosomal dominant retinitis pigmentosa (ADRP; 30–40%), and X-linked RP (5–15%) (last row). Estimated relative contributions of various genes causing ARRP in human patients. The estimated proportions are from a previous work (Hartong et al., 2006). Among the causal genes listed in this horizontal bar chart, PDE6B and CRB1 are marked with red arrows, which are corresponding to murine mutation genes (i.e., Pde6b and Crb1) of retinal degeneration (rd) 10 and rd8 mouse models, respectively.
FIGURE 2
FIGURE 2
Diverse shapes of retinal folds were found in H&E staining images of rd8 retinas at various ages. (A) A retinal fold was observed from a retina of a rd8 mouse sacrificed in postnatal weeks (PW) 5. Scale bar is displayed on each panel. GCL, ganglion cell layer; IPL, inner plexiform layer; INL, inner nuclear layer; OPL, outer plexiform layer; ONL, outer nuclear layer; IS/OS, inner segment/outer segment of photoreceptor; RPE, retinal pigment epithelium. (B) Same as panel (A) but from rd8 animals sacrificed in PW10. Retinas shown in panels (Bi,Bii) are from two different animals. Two panels marked as (Bii) show different areas of the same retina. (C) Same as panel (A) but from an rd8 animal sacrificed in PW15. Retinas shown in panels (Ci,Cii) are from the same animal but two different retinas. (D) Cross-sectional image of the whole retina of a PW25 rd8 mouse. (inset) A magnified view showing a wiggly borderline between ONL and IS/OS layer. Wiggly spots are marked with pink arrows. (E) Same as D but from an age-matched wild-type (wt) mouse (PW25). Inset shows a clear borderline between ONL and IS/OS layer.
FIGURE 3
FIGURE 3
Histological analyses show similar thickness changes of retinal layers as a function of ages in rd8 and wild-type (wt) retinas while rd10 retinas show remarkably thickness decrement. (Ai–Aiv) H&E staining images of rd8 retinas of mice at four age groups: postnatal weeks (PW) 3, 5, 10, and 15, respectively. (Bi–Biv) Same as panel (A) but for age-matched wt mouse retinas. (Ci–Civ) Same as panel (A) but for age-matched rd10 mouse retinas. Profound thinning is observed in both ONL and IS/OS layer. Each vertical scale bar at bottom right of every panel indicates 50 μm. GCL: ganglion cell layer, IPL: inner plexiform layer, INL: inner nuclear layer, OPL: outer plexiform layer, ONL: outer nuclear layer, IS/OS: inner segment/outer segment of photoreceptor, RPE: retinal pigment epithelium.
FIGURE 4
FIGURE 4
Electrically-evoked responses from 6 representative RGCs in the three physiological types of rd8 retinas. At top of each panel, representative light-evoked responses of ON, OFF, and ON-OFF DS RGC to 1-s-long white spot flash are shown. (Ai,Aii) Raster plots of ON RGCs are shown in the order of peak firing rate (PFR), which is shown below each cell ID. Each vertical tick of raster plots indicates a single spike. Each cell contains responses to stimuli repeated for 6 or 7 times. Spiking patterns of ON RGCs were divided into either two (Ai) or three (Aii) bursts. (Bi,Bii) Same as panel (A) but for OFF RGCs. The responses of OFF cells were also divided into two types: abrupt spiking ending (Bi), and gradual tapering off of spiking activity (Bii). (C) Raster plots of ON-OFF DS RGCs are displayed in the descending order of direction selectivity index (DSI). Yellow vertical bands in raster plots indicate the range of early response of each cell type (i.e., 0–50, 0–6, and 0–55 ms for ON, OFF, and DS RGCs, respectively).
FIGURE 5
FIGURE 5
Electric responses are well correlated with light responses in both ON and OFF RGCs of the rd8 retinas, and ON but not OFF RGCs of the wt retinas. (Ai–Aiii) Scatter plots of peak firing rate (PFR) for electric response vs. PFR for light response of the ON RGCs in the rd8 retinas. Scatter plots are shown for (Ai) early, (Aii) late, and (Aiii) total response, respectively. Each data point is from a different cell. Dashed line indicates linear fitting curve of all data points, and the level of correlation (r-value) is shown in each plot. (Bi–Biii) Same as panels (Ai–Aiii) but for the OFF RGCs in the rd8 retinas. (Ci–Ciii) Same as panels (Ai–Aiii) but for the wild-type (wt) mouse retinas. (Di–Diii) Same as panels (Bi–Biii) but for the wt mouse retinas.
FIGURE 6
FIGURE 6
Electric response magnitudes (spike count) of DS RGCs in rd8 and wt retinas show opposite correlations with their direction selectivity indices and light response spike count. (Ai–Aiii) Scatter plots of electric response [early, late, and total responses in panels (Ai–Aiii), respectively] spike count vs. light response DSIAVG in the same cell for all DS RGCs recorded from rd8 retinas. Each data point is from a different cell. Level of correlation (r–value) is shown in each plot. Dashed line indicates linear fitting curve in each panel. (Bi–Biii) Scatter plots of electric response (spike count) vs. leading edge (ON) of moving bar light response (spike count) in the same cell for all DS RGCs recorded from the rd8 retinas. Scatter plots are shown for (Bi) early, (Bii) late, and (Biii) total responses, respectively. (Ci–Ciii) Same as panels (Ai–Aiii) but for trailing edge (OFF) of moving bar light response.
FIGURE 7
FIGURE 7
Spike timing of late response becomes less consistent in both ON and OFF RGCs of rd8 than wild-type (wt) retinas. (Ai) Color-coded heatmaps of the spike time tiling coefficients (STTCs) of early and late responses for each ON RGC from the rd8 retinas. (Aii) Same as panel (Ai) but for OFF RGCs in the rd8 retinas. (Aiii,Aiv) Same as panels (Ai,Aii) but for the wt mouse retinas. An identical stimulus repeated typically for 7 times (at least 6 times). Black color in matrices indicates no response was elicited in those trials. (B) Violin plots of all STTCs computed from all rd8 and wt RGCs. Red horizontal line indicates average STTC value of each group. Four violin plots on the left side are from RGCs of the rd8 retinas and the other four violin plots on the right side are from the wt retinas. Statistical significance was assessed using the one-way ANOVA with Holm-Sidak post-hoc comparisons; ***p < 0.001, **p < 0.01, and n.s. means not significant.
FIGURE 8
FIGURE 8
Spike timing consistencies of DS RGCs in rd8 retinas are comparable to those of DS RGCs in wt retinas. (A) Color-coded heatmaps of the spike time tiling coefficients (STTCs) of early and late responses in the rd8 DS RGCs. An identical stimulus repeated typically for seven times (at least six times). Black color in matrices indicates no response was elicited in those trials. (B) Violin plots of all STTCs computed from rd8 RGCs. Red horizontal line indicates average STTC value of each group. Statistical significance test was performed using the one-way ANOVA with Holm–Sidak post-hoc comparisons; ***p < 0.001. Statistical significance comparisons between rd8 and wt RGCs are shown in Table 2.
FIGURE 9
FIGURE 9
Schematic illustrations of different retinal circuits between non-DS and DS RGCs. (A) AII amacrine cell (AC) has a narrow field of bistratified dendrites to ON and OFF RGCs. (B) Starburst amacrine cells (SACs) stratify their dendrites to a relatively wide area to modulate direction-selective light responses of DS RGCs. IPL, Inner plexiform layer; BC, bipolar cell; RGC, retinal ganglion cell; AII AC, aII amacrine cell; SAC, starburst amacrine cell; DS RGC, directional selective retinal ganglion cell. Rod pathways are not illustrated for brevity.

Similar articles

Cited by

References

    1. Ahuja A. K., Dorn J. D., Caspi A., McMahon M. J., Dagnelie G., DaCruz L., et al. (2011). Blind subjects implanted with the Argus II retinal prosthesis are able to improve performance in a spatial-motor task. Br. J. Ophthalmol. 95 539–543. 10.1136/bjo.2010.179622 - DOI - PMC - PubMed
    1. Aleman T. S., Cideciyan A. V., Aguirre G. K., Huang W. C., Mullins C. L., Roman A. J., et al. (2011). Human CRB1-associated retinal degeneration: Comparison with the rd8 Crb1-mutant mouse model. Investig. Ophthalmol. Vis. Sci. 52 6898–6910. 10.1167/iovs.11-7701 - DOI - PMC - PubMed
    1. Aredo B., Zhang K., Chen X., Wang C. X. Z., Li T., Ufret-Vincenty R. L. (2015). Differences in the distribution, phenotype and gene expression of subretinal microglia/macrophages in C57BL/6N (Crb1rd8/rd8) versus C57BL6/J (Crb1wt/wt) mice. J. Neuroinflammation. 12:6. 10.1186/s12974-014-0221-4 - DOI - PMC - PubMed
    1. Baden T., Berens P., Franke K., Román Rosón M., Bethge M., Euler T. (2016). The functional diversity of retinal ganglion cells in the mouse. Nature 529 345–350. 10.1038/nature16468 - DOI - PMC - PubMed
    1. Battu P., Sharma K., Thangavel R., Singh R., Sharma S., Srivastava V., et al. (2022). Genotyping of clinical parameters in age-related macular degeneration. Clin. Ophthalmol. (Auckland, N.Z.) 16 517–529. 10.2147/OPTH.S318098 - DOI - PMC - PubMed

LinkOut - more resources