

The Therapeutic Mechanism of Schisandrol A and Its Metabolites on Pulmonary Fibrosis Based on Plasma Metabonomics and Network Analysis
- PMID: 36814892
- PMCID: PMC9939797
- DOI: 10.2147/DDDT.S391503
The Therapeutic Mechanism of Schisandrol A and Its Metabolites on Pulmonary Fibrosis Based on Plasma Metabonomics and Network Analysis
Abstract
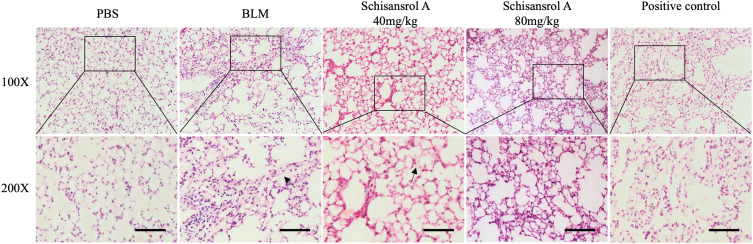
Background: Schisandrol A (Sch A) is the main active ingredient of Schisandra chinensis (Turcz.) Baill. Our previous study showed that Sch A has anti-pulmonary fibrosis (PF) activity, but its metabolic-related mechanisms of action are not clear.
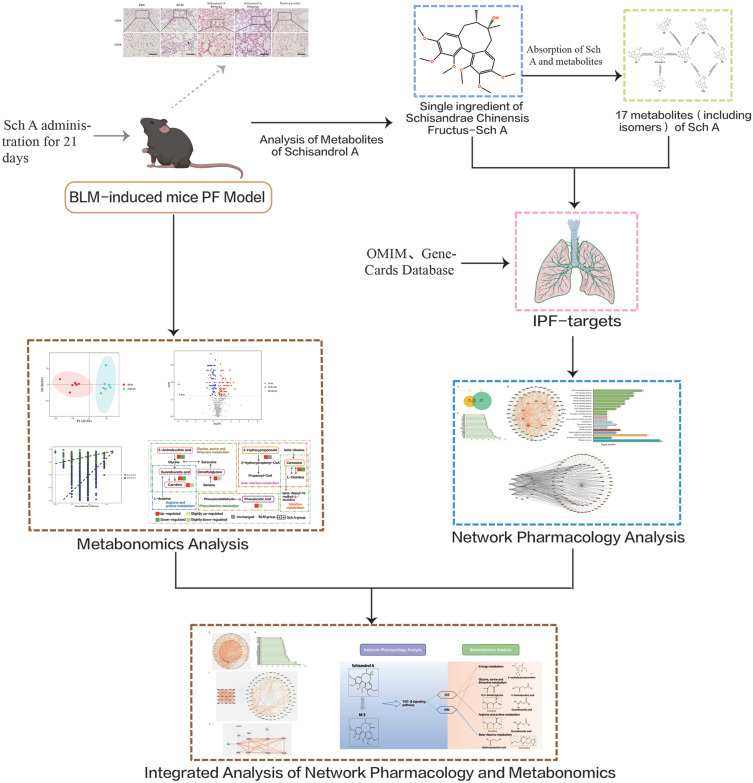
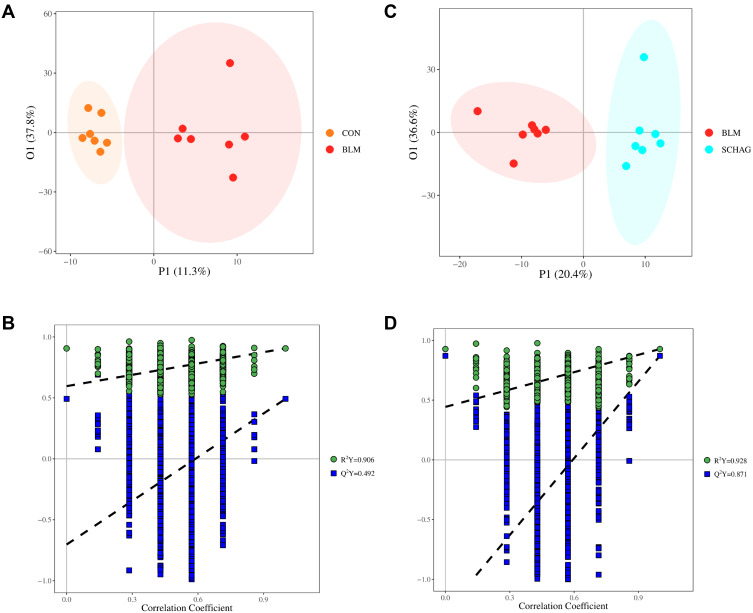
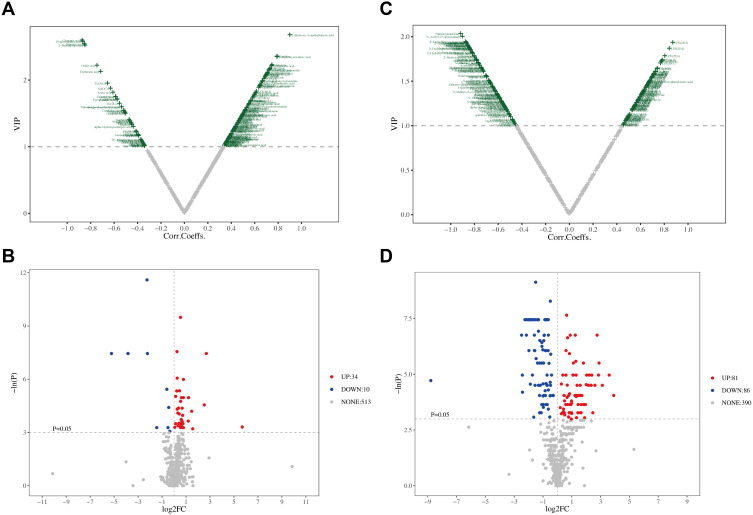
Methods: Here, we explored the therapeutic mechanisms of Sch A on PF by ultra-high performance liquid chromatography coupled with tandem mass spectrometry (UPLC-MS/MS) metabolomics approach and network analysis. The metabolites of Sch A in mice (bleomycin + Sch A high-dose group) plasma were identified based on ultra-high performance liquid chromatography-quadrupole time-of-flight mass spectrometry (UPLC-Q-TOF/MS).
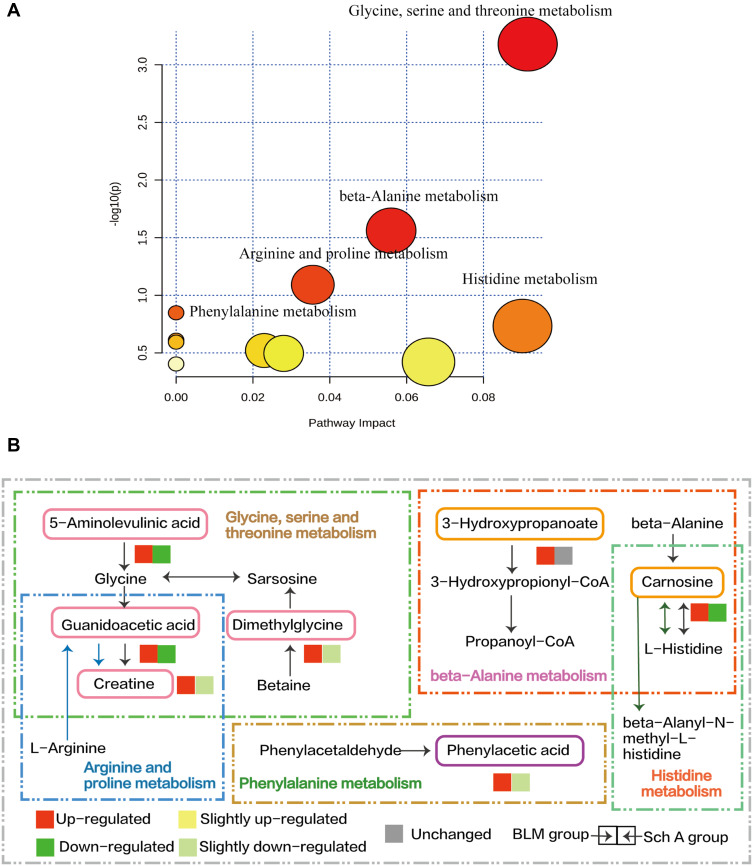
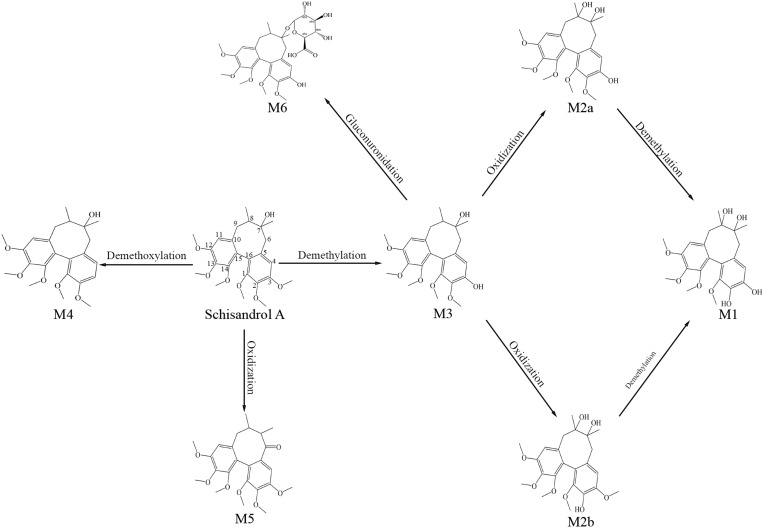
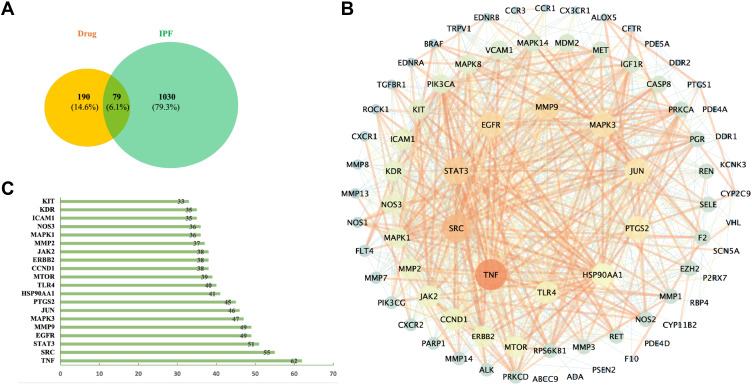
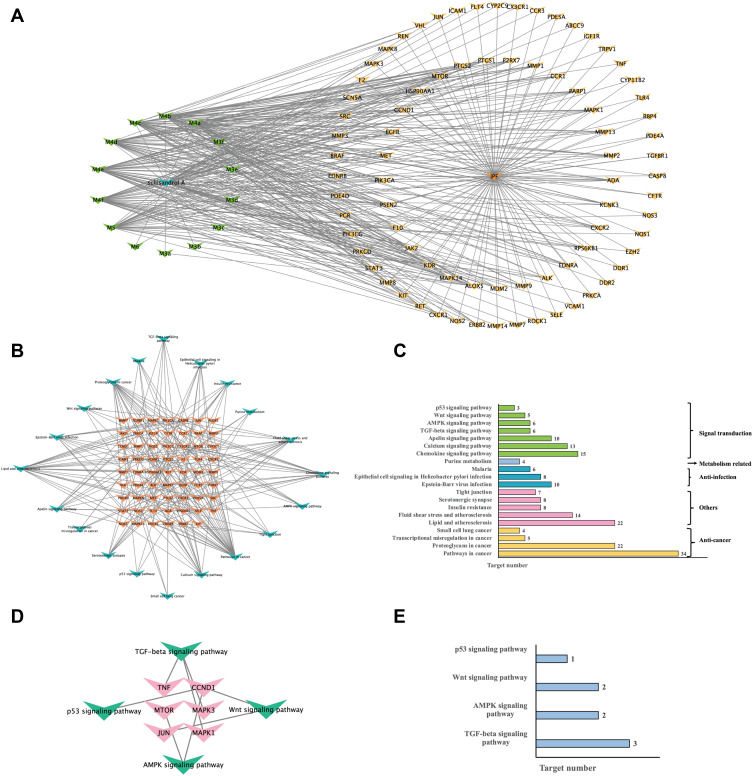
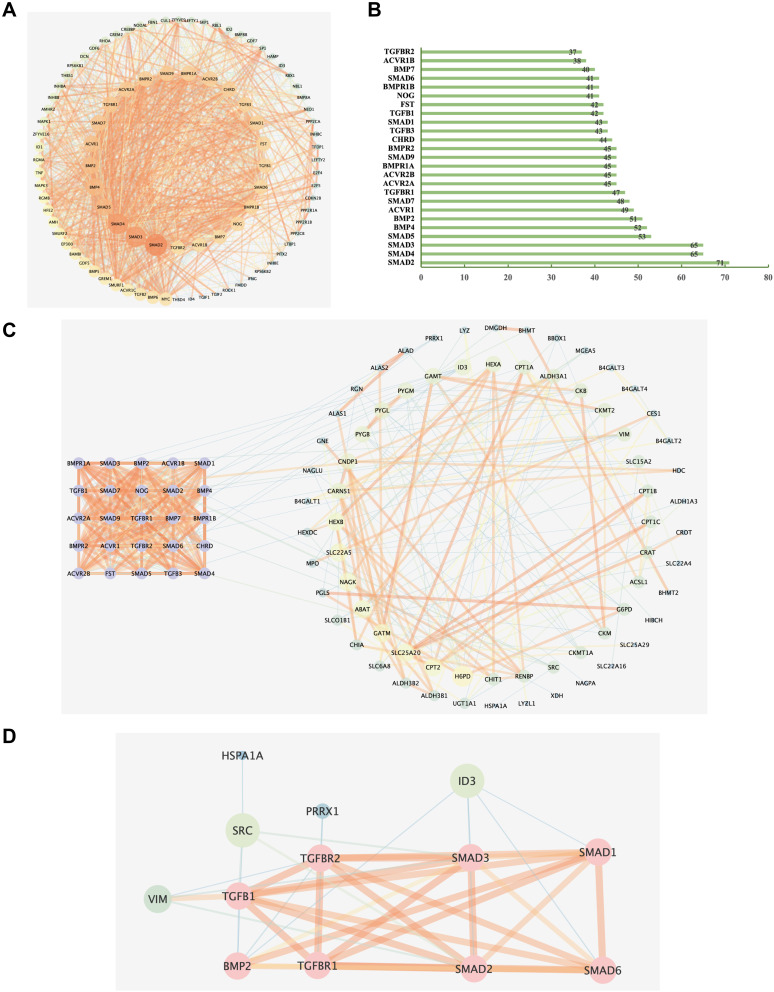
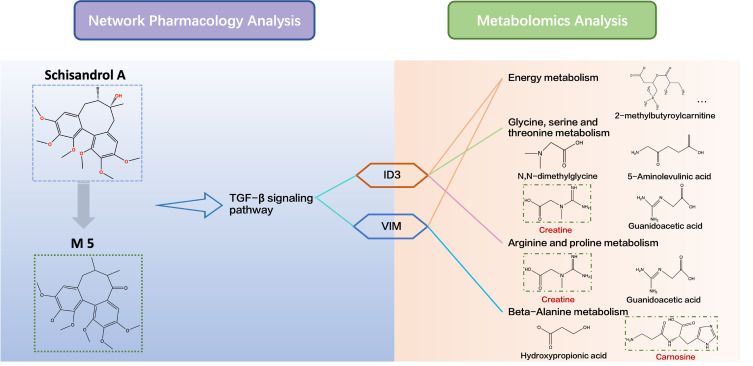
Results: 32 metabolites were detected reversed to normal level after treating bleomycin (BLM)-induced PF mice with Sch A. The 32 biomarkers were enriched in energy metabolism and several amino acid metabolisms, which was the first report on the therapeutic effects of Sch A on PF through rescuing the disordered energy metabolism. The UPLC-Q-TOF/MS analysis identified 17 possible metabolites (including isomers) of Sch A in mice plasma. Network analysis revealed that Sch A and 17 metabolites were related to 269 genes, and 1109 disease genes were related to PF. The construction of the Sch A/metabolites-target-PF network identified a total of 79 intersection genes and the TGF-β signaling pathway was determined to be the main signaling pathway related to the treatment of PF by Sch A. The integrated approach involving metabolomics and network analysis revealed that the TGF-β1-ID3-creatine pathway, TGF-β1-VIM-carnosine pathway were two of the possible pathways Sch A regulated to modulate metabolic disorders, especially energy metabolism, and the metabolite of Sch A M5 was identified as a most likely active metabolite.
Conclusion: The results suggested the feasibility of combining metabolomics and network analysis to reflect the effects of Sch A on the biological network and the metabolic state of PF and to evaluate the drug efficacy of Sch A and its related mechanisms.
Keywords: mechanism of action; metabonomics; network analysis; pulmonary fibrosis; schisandrol A.
© 2023 Qiaolongbatu et al.
Conflict of interest statement
The authors report no conflicts of interest in this work.
Figures
Similar articles
-
Schisandrol A, the main active ingredient of Schisandrae Chinensis Fructus, inhibits pulmonary fibrosis through suppression of the TGF-β signaling pathway as revealed by UPLC-Q-TOF/MS, network pharmacology and experimental verification.J Ethnopharmacol. 2022 May 10;289:115031. doi: 10.1016/j.jep.2022.115031. Epub 2022 Jan 26. J Ethnopharmacol. 2022. PMID: 35091014
-
Integrating metabolomics and network pharmacology analysis to explore mechanism of Pueraria lobata against pulmonary fibrosis: Involvement of arginine metabolism pathway.J Ethnopharmacol. 2024 Oct 5;332:118346. doi: 10.1016/j.jep.2024.118346. Epub 2024 May 21. J Ethnopharmacol. 2024. PMID: 38782311
-
Effects of N-butanol extract of Amygdalus mongolica on rats with bleomycin-induced pulmonary fibrosis based on metabolomics.Braz J Med Biol Res. 2023 Nov 3;56:e13045. doi: 10.1590/1414-431X2023e13045. eCollection 2023. Braz J Med Biol Res. 2023. PMID: 37937603 Free PMC article.
-
An animal research and a chemical composition analysis of a Chinese prescription for pulmonary fibrosis: Yangfei Huoxue Decoction.J Ethnopharmacol. 2019 Dec 5;245:112126. doi: 10.1016/j.jep.2019.112126. Epub 2019 Aug 14. J Ethnopharmacol. 2019. PMID: 31421181
-
Chemical composition analysis of the proteins of leech extract with anti-pulmonary fibrosis and their effects on metabolomics based on chromatography-mass spectrometry.J Pharm Biomed Anal. 2025 Sep 1;262:116868. doi: 10.1016/j.jpba.2025.116868. Epub 2025 Apr 3. J Pharm Biomed Anal. 2025. PMID: 40194473
Cited by
-
A comprehensive review on computational metabolomics: Advancing multiscale analysis through in-silico approaches.Comput Struct Biotechnol J. 2025 Jul 13;27:3191-3215. doi: 10.1016/j.csbj.2025.07.016. eCollection 2025. Comput Struct Biotechnol J. 2025. PMID: 40735430 Free PMC article. Review.
-
Integrating Network Pharmacology and Experimental Validation to Explore the Pharmacological Mechanism of Astragaloside IV in Treating Bleomycin-Induced Pulmonary Fibrosis.Drug Des Devel Ther. 2023 Apr 27;17:1289-1302. doi: 10.2147/DDDT.S404710. eCollection 2023. Drug Des Devel Ther. 2023. PMID: 37138582 Free PMC article.
-
Metabolomics for Clinical Biomarker Discovery and Therapeutic Target Identification.Molecules. 2024 May 8;29(10):2198. doi: 10.3390/molecules29102198. Molecules. 2024. PMID: 38792060 Free PMC article. Review.
References
MeSH terms
Substances
LinkOut - more resources
Full Text Sources
Medical
Miscellaneous
